5273
Comparison of BOLD and CBV impulse-response to visual stimulation in humans in the presence of Ferumoxytol1Advanced MRI section, LFMI, NINDS, National Institutes of Health, Bethesda, MD, United States, 2Translational Neuroradiology section, NINDS, National Institutes of Health, Bethesda, MD, United States
Synopsis
Ferumoxytol is a blood-pool-bound superparamagnetic iron-oxide particle (SPIO) that has been shown to yield CBV-dominated fMRI contrast in humans. Differences in impulse-response (IR) timing were previously demonstrated in animals when comparing SPIO-fMRI to BOLD-fMRI. Since BOLD IR is known to differ between humans and animals, we aimed to repeat this SPIO-fMRI to BOLD-fMRI comparison in humans. SPIO-fMRI was performed in human visual cortex and IR was compared to BOLD data from the same subjects. Shorter stimulus onset time and time-to-peak were found. Stimulus design minimized neuronal interaction effects between stimuli; residual inter-stimulus interaction effects, presumably vascular in origin, were found to be minor in SPIO-fMRI, on the same scale as in BOLD.
Introduction
Ferumoxytol, a blood-pool-bound superparamagnetic iron-oxide particle (SPIO) can yield CBV-dominated fMRI contrast in humans[1]. SPIO-based fMRI has the potential to yield increased contrast-to-noise ratio and specificity compared to conventional Blood Oxygen-Level Dependent (BOLD)-fMRI. Differences in impulse-response (IR) timing have been found in animals when comparing SPIO-fMRI to BOLD[2], e.g. due to BOLD signal being vein-dominated. Since BOLD-IR is known to be slower in humans than rodents[3], SPIO-fMRI was performed here in human visual cortex to measure human CBV-dominated IR and compared to BOLD-IR in the same subjects. An m-sequence stimulus paradigm[4] designed to suppress neuronal interaction effects was used.Materials and Methods
Ferumoxytol is an SPIO with ~17-31nm particles, half-life in humans is ~15h. Four healthy volunteers (age 22.4-44.2y) were administered 510mg (6.0-8.5mg/kg) Ferumoxytol intravenously. SPIO-fMRI was performed 1-3h post-injection, and compared to a pre-injection baseline (BOLD-fMRI) scan with the same parameters. Experiments were done at 7T. Rate-3 SENSE EPI was used: resolution=1.5x1.5x1.2mm3; slices=28; TE=16.2ms; TR=1s (one volunteer was scanned at 1.23mm3 resolution with 18 slices and 24.5ms TE). A 255-bin binary m-sequence pseudo-random stimulus paradigm was used to measure IR. The last 40s of the same m-sequence paradigm preceded the actual experiment to assure steady-state of the response, and an inverse-repeat of the m-sequence was added to simplify separation of interaction effects between stimuli, leading to 600-repetition experiments (10-min duration). Duration of each m-sequence bin (event) was 1s, but by limiting the stimulus (7.5Hz contrast-reversing checkerboard) in 'on'-bins to 800ms-duration, a 200ms minimal stimulus separation was assured to suppress neuronal interactions[5]. Measured IR were corrected for (minor) residual nonlinearities. Ten-fold zero-filling during correlation analysis was used to yield sinc-interpolated IR with 0.1s temporal resolution. Correction for slice-timing was performed before averaging. A 30s-off,30s-on block paradigm (300 repetitions; 5-min duration) using the same visual stimulus was used in each session to determine significantly-activated voxels. All scans from both BOLD and Ferumoxytol sessions were registered to the 10th volume in the BOLD block-paradigm scan.
Results
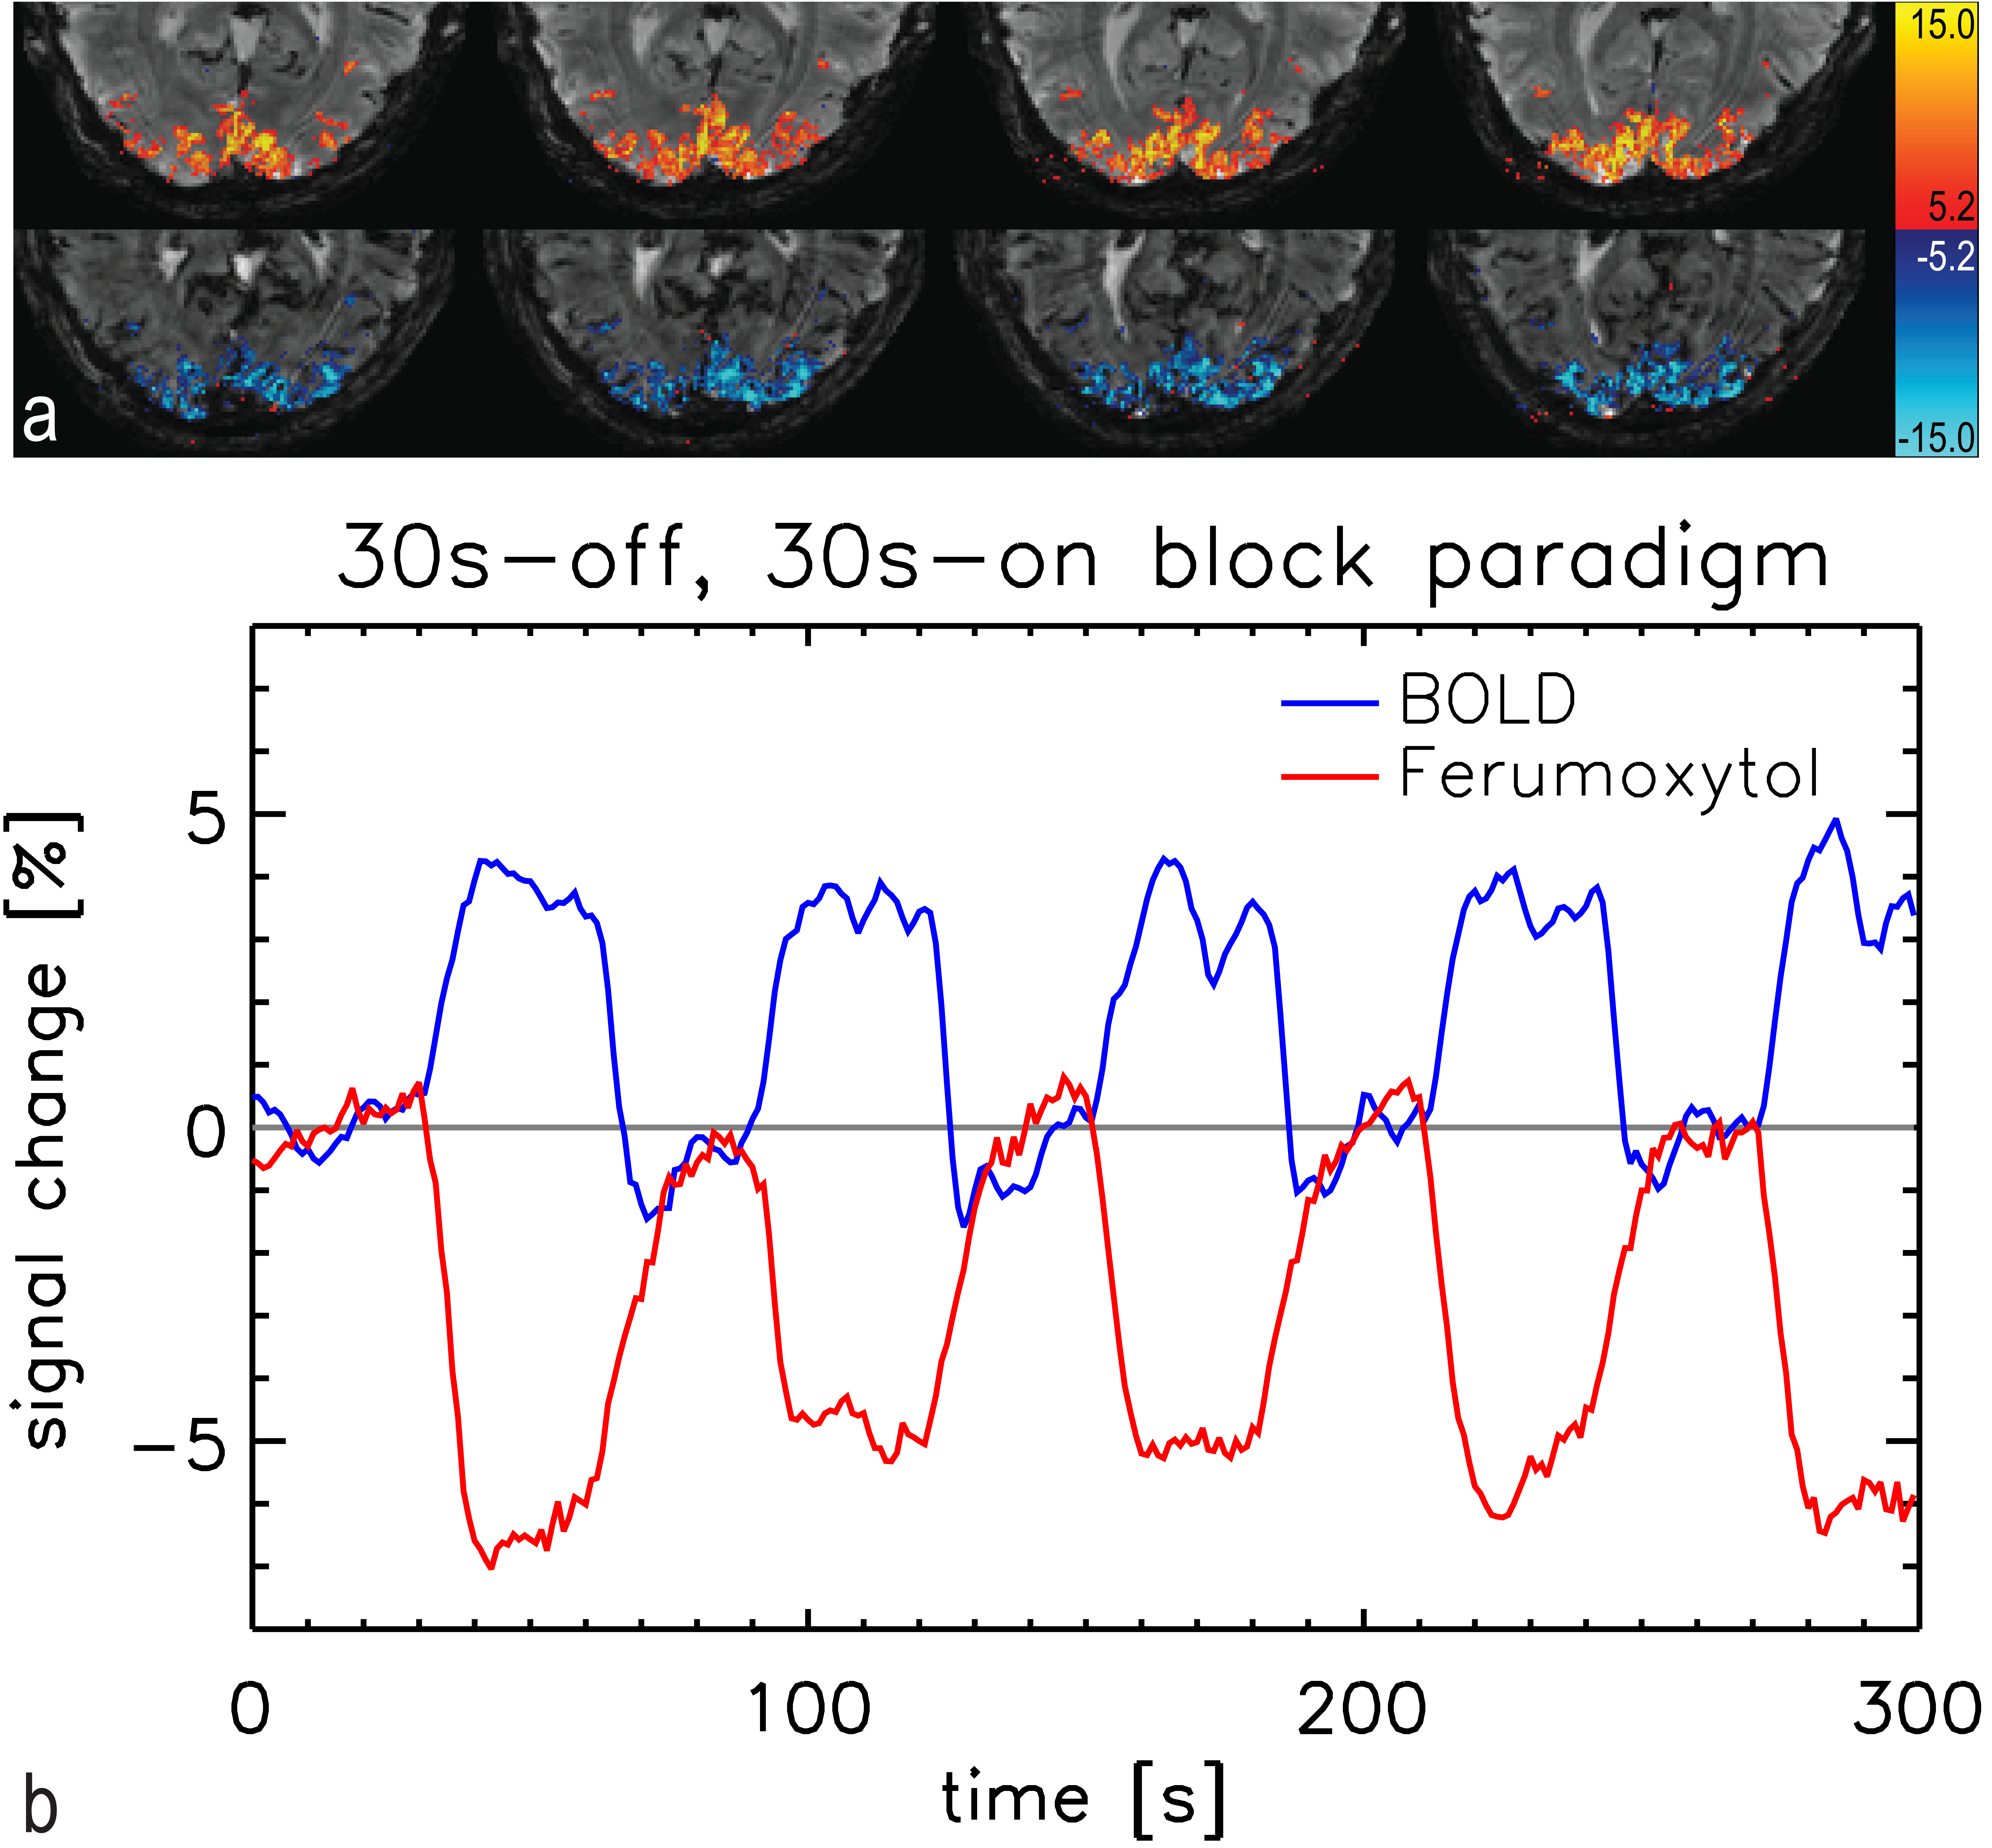
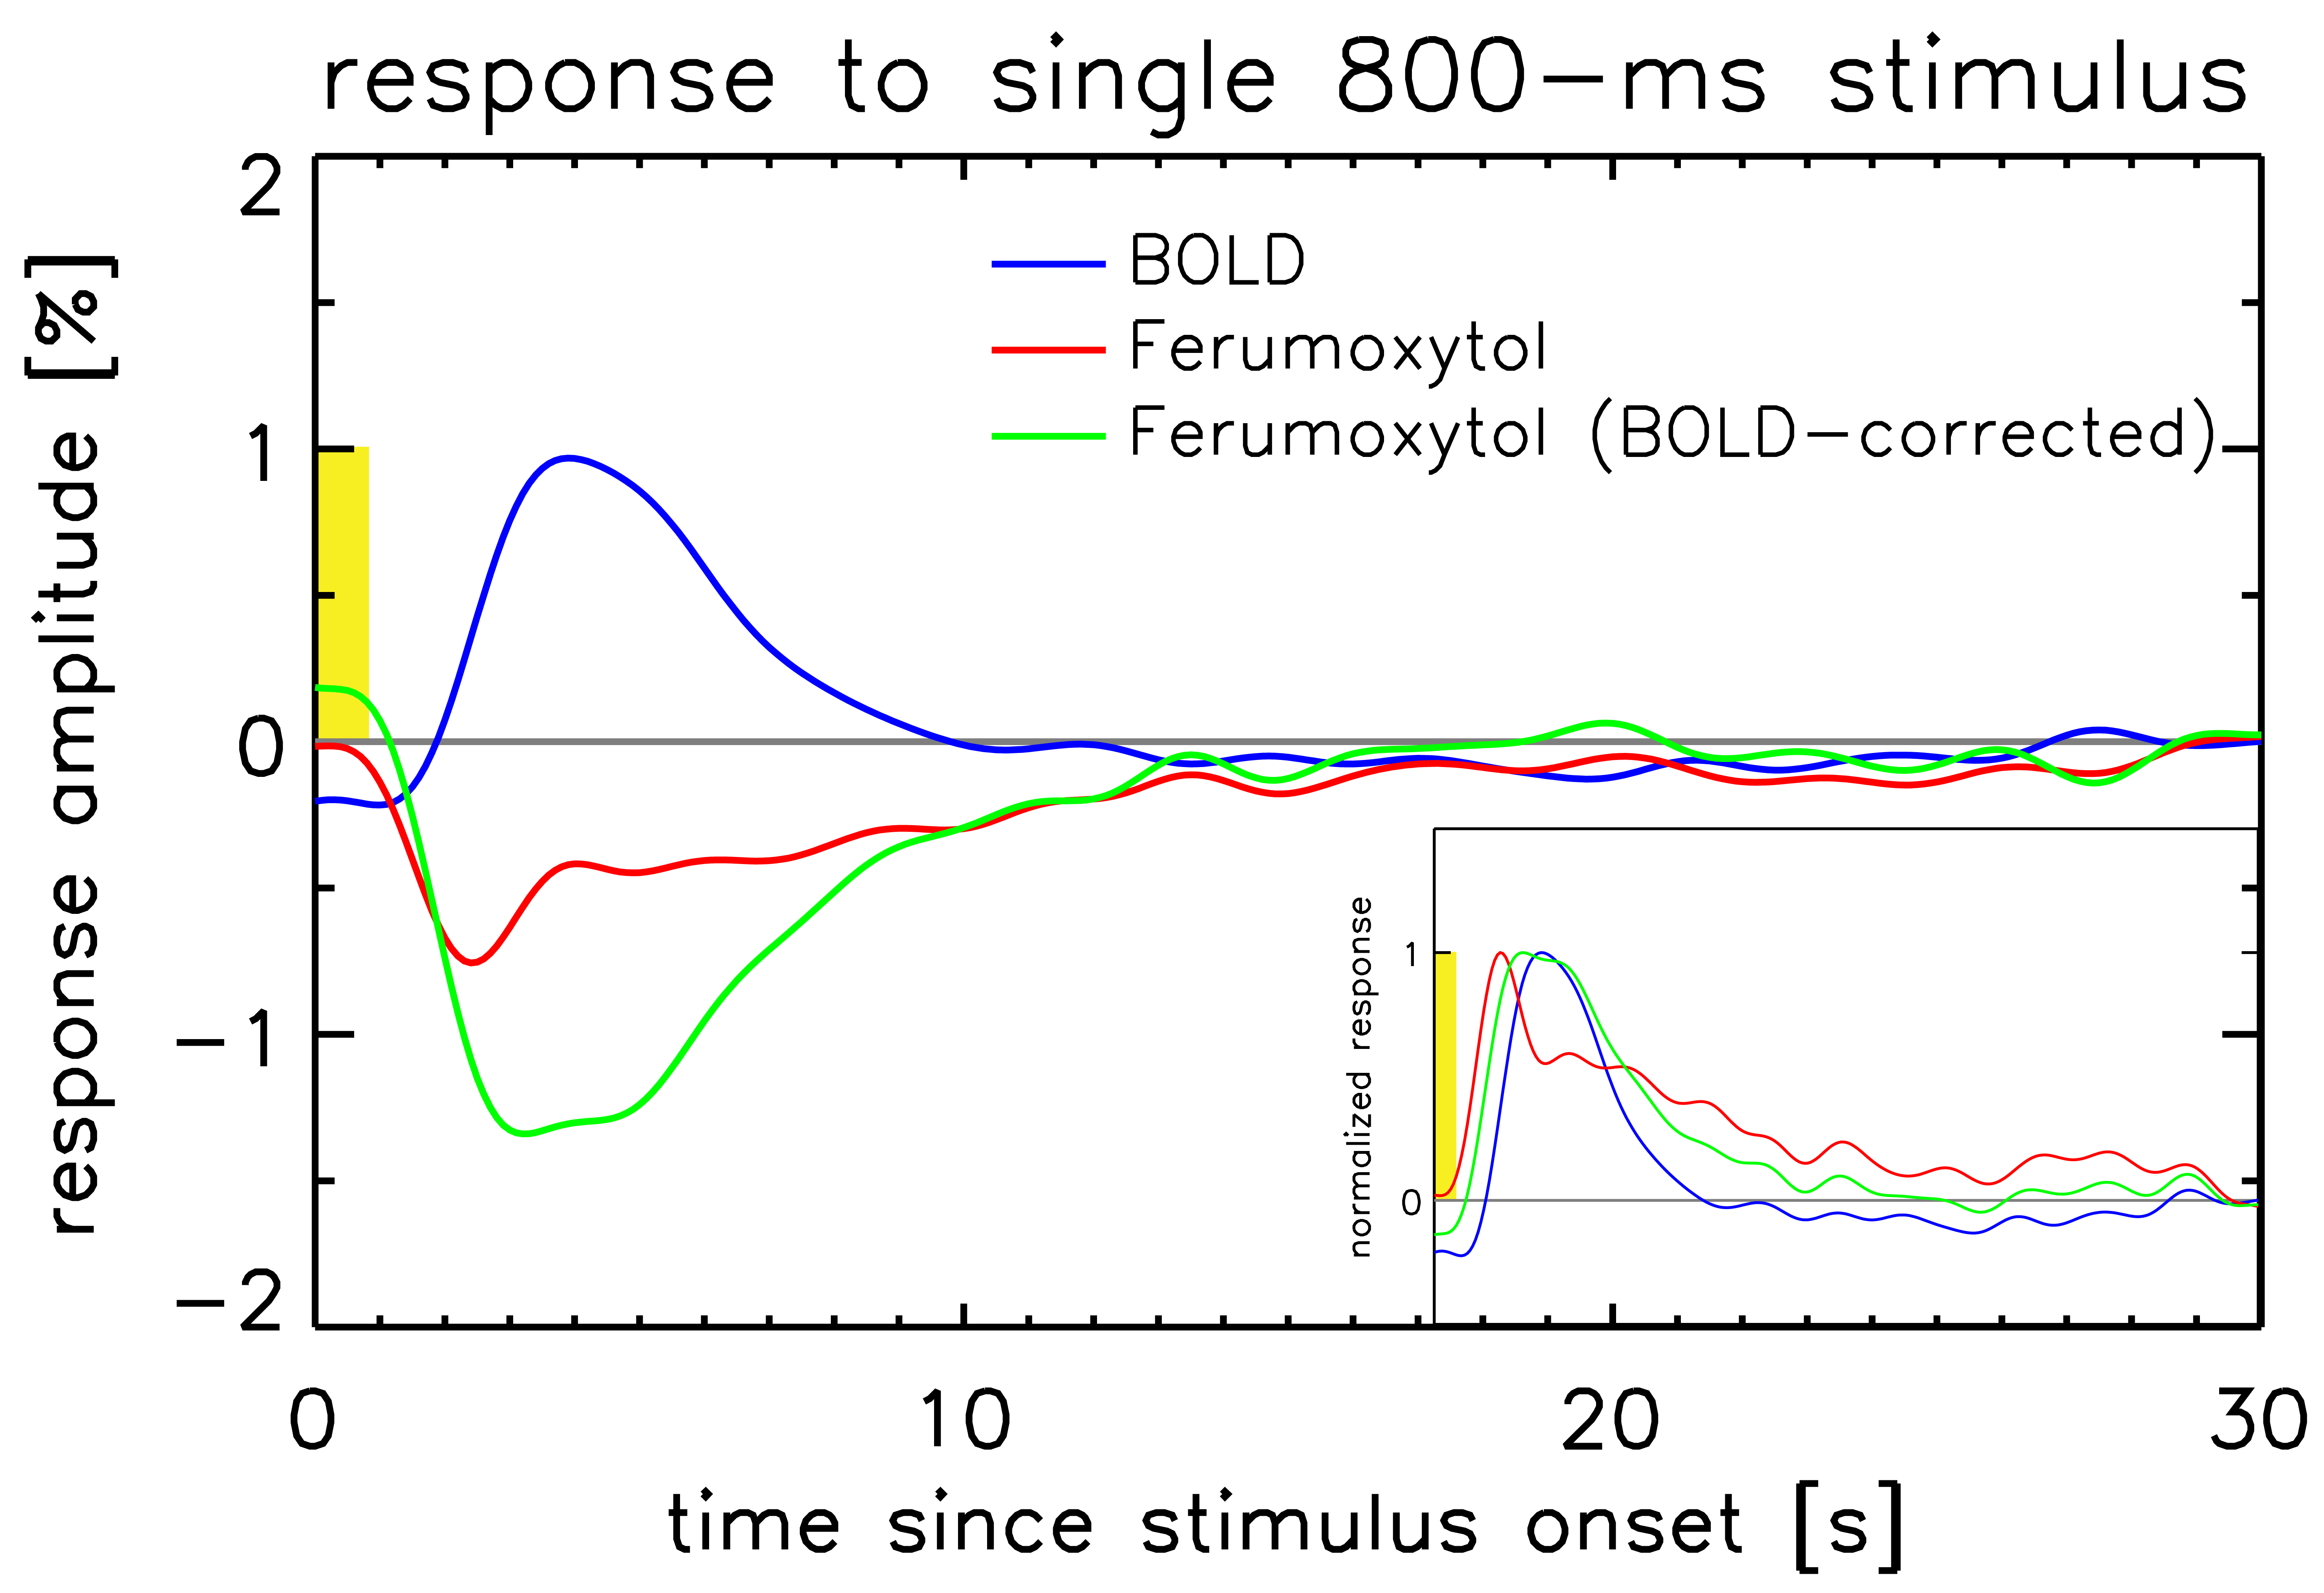
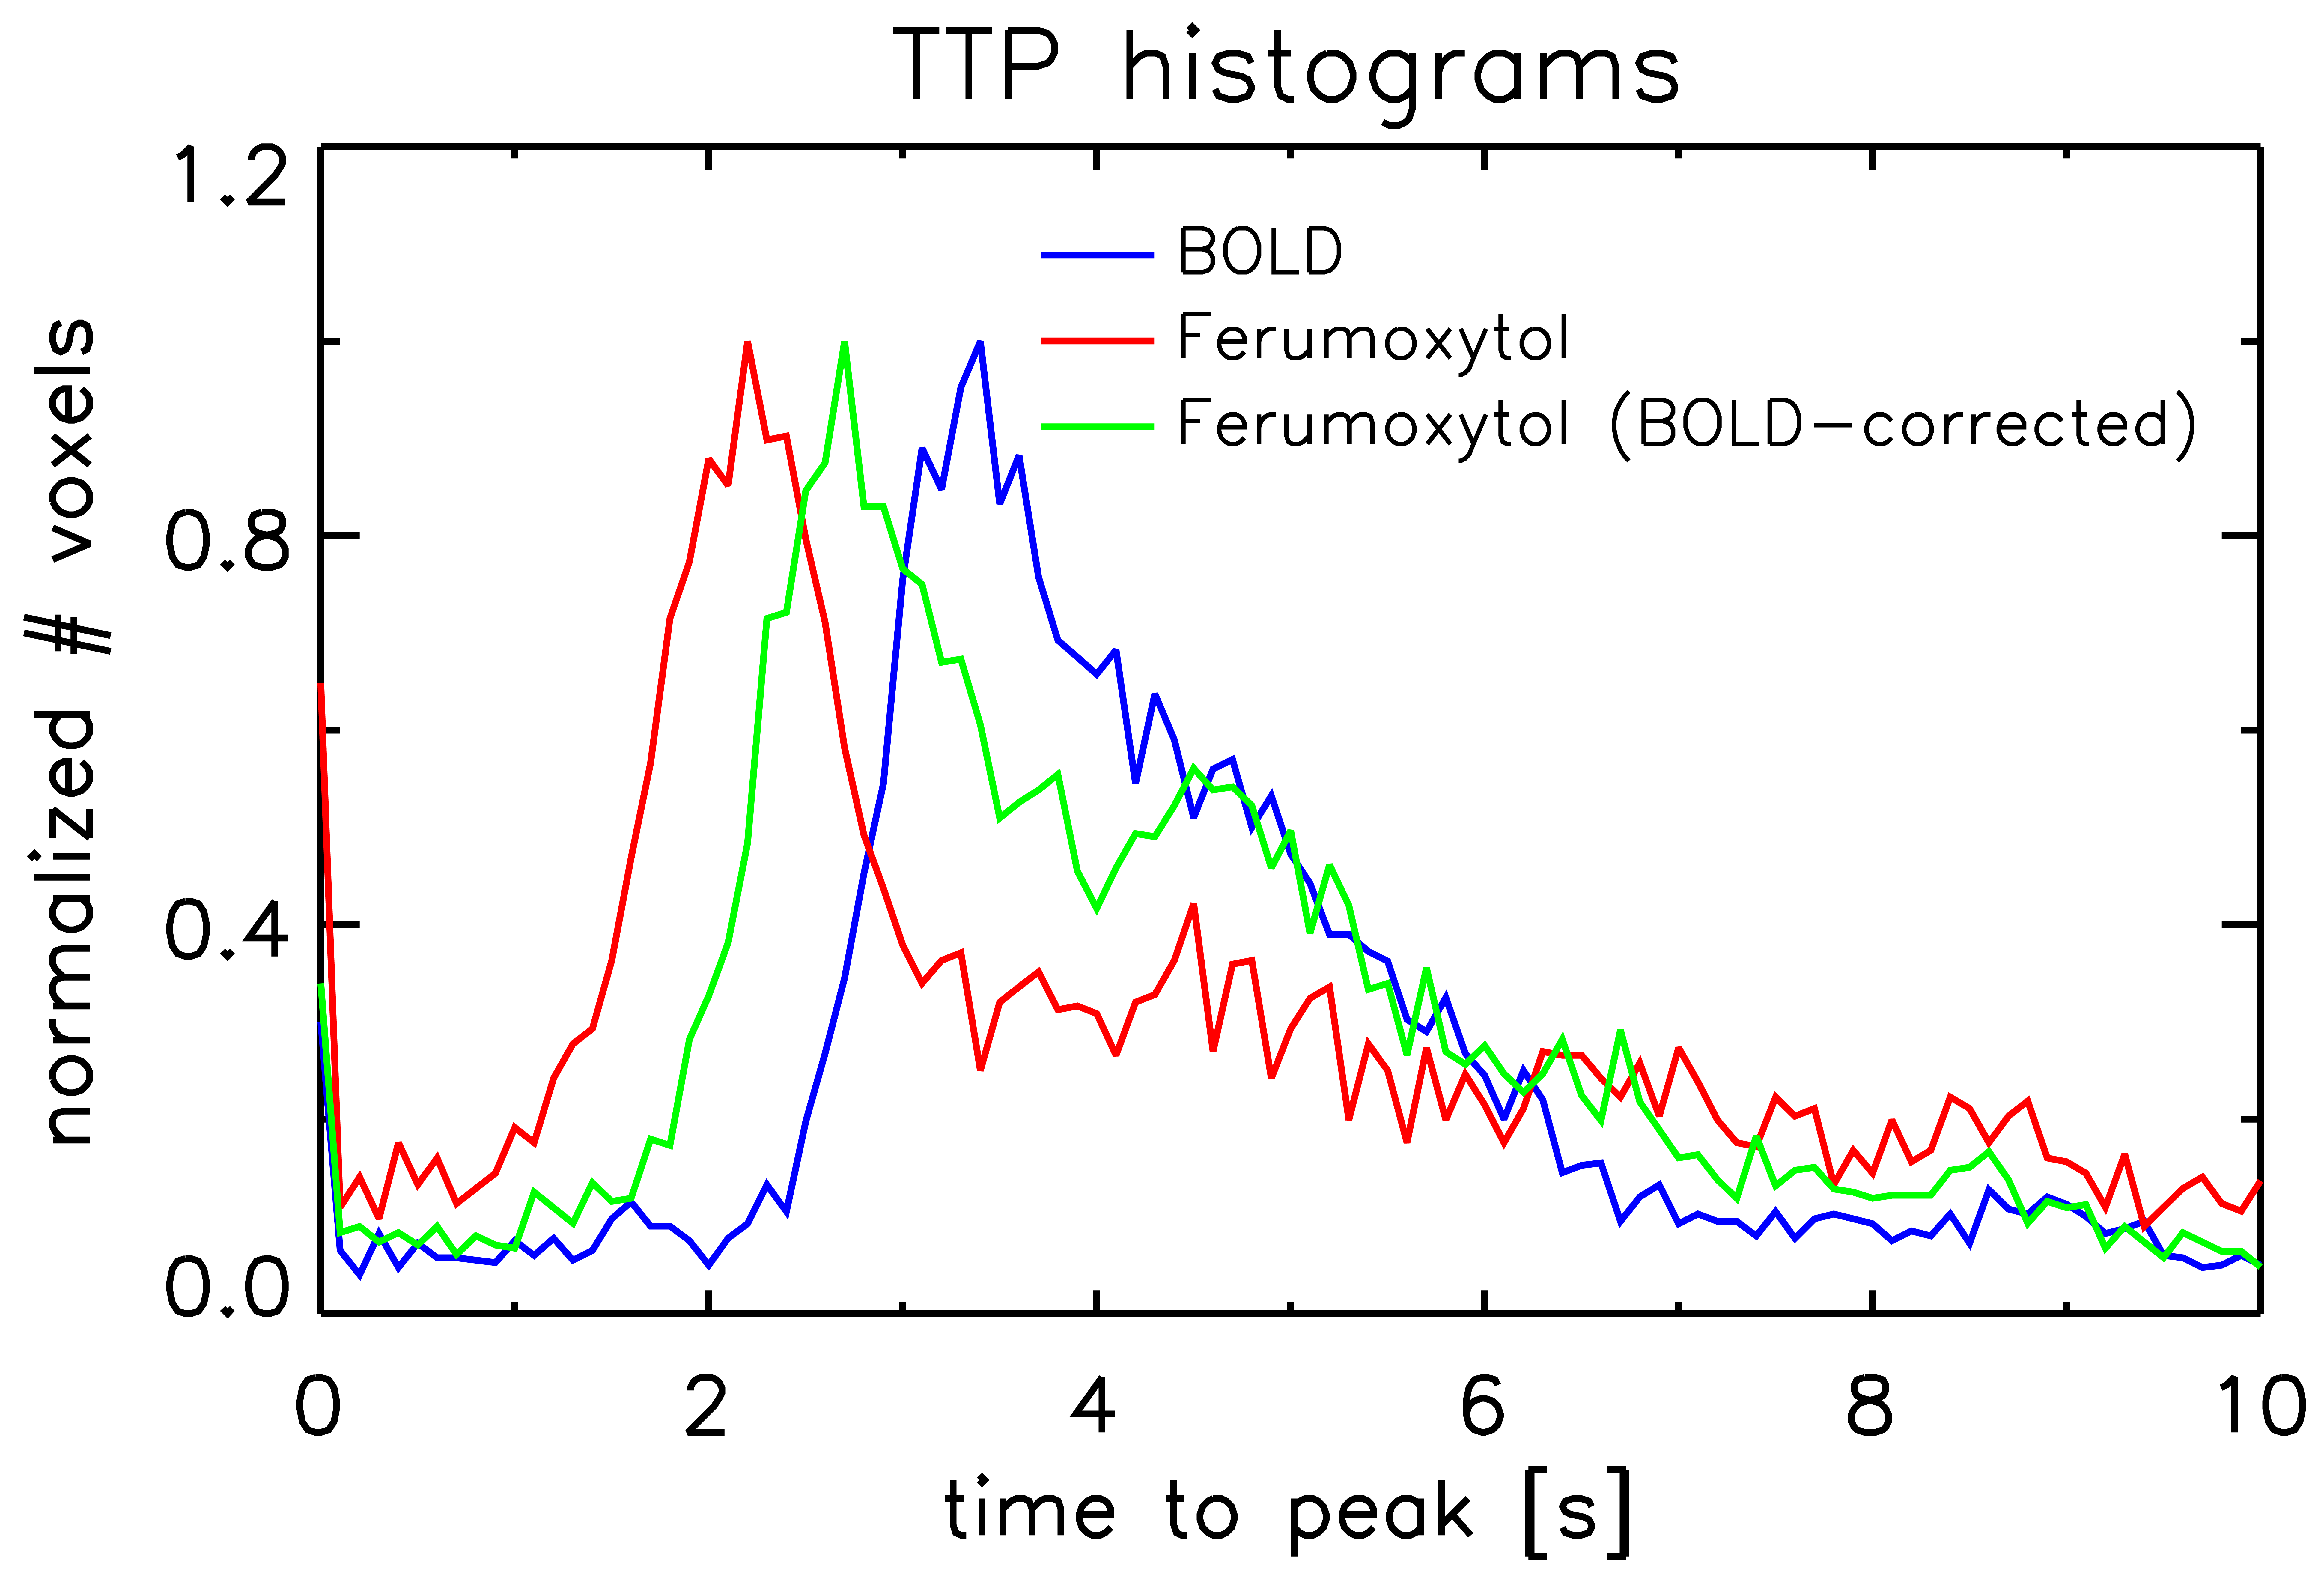
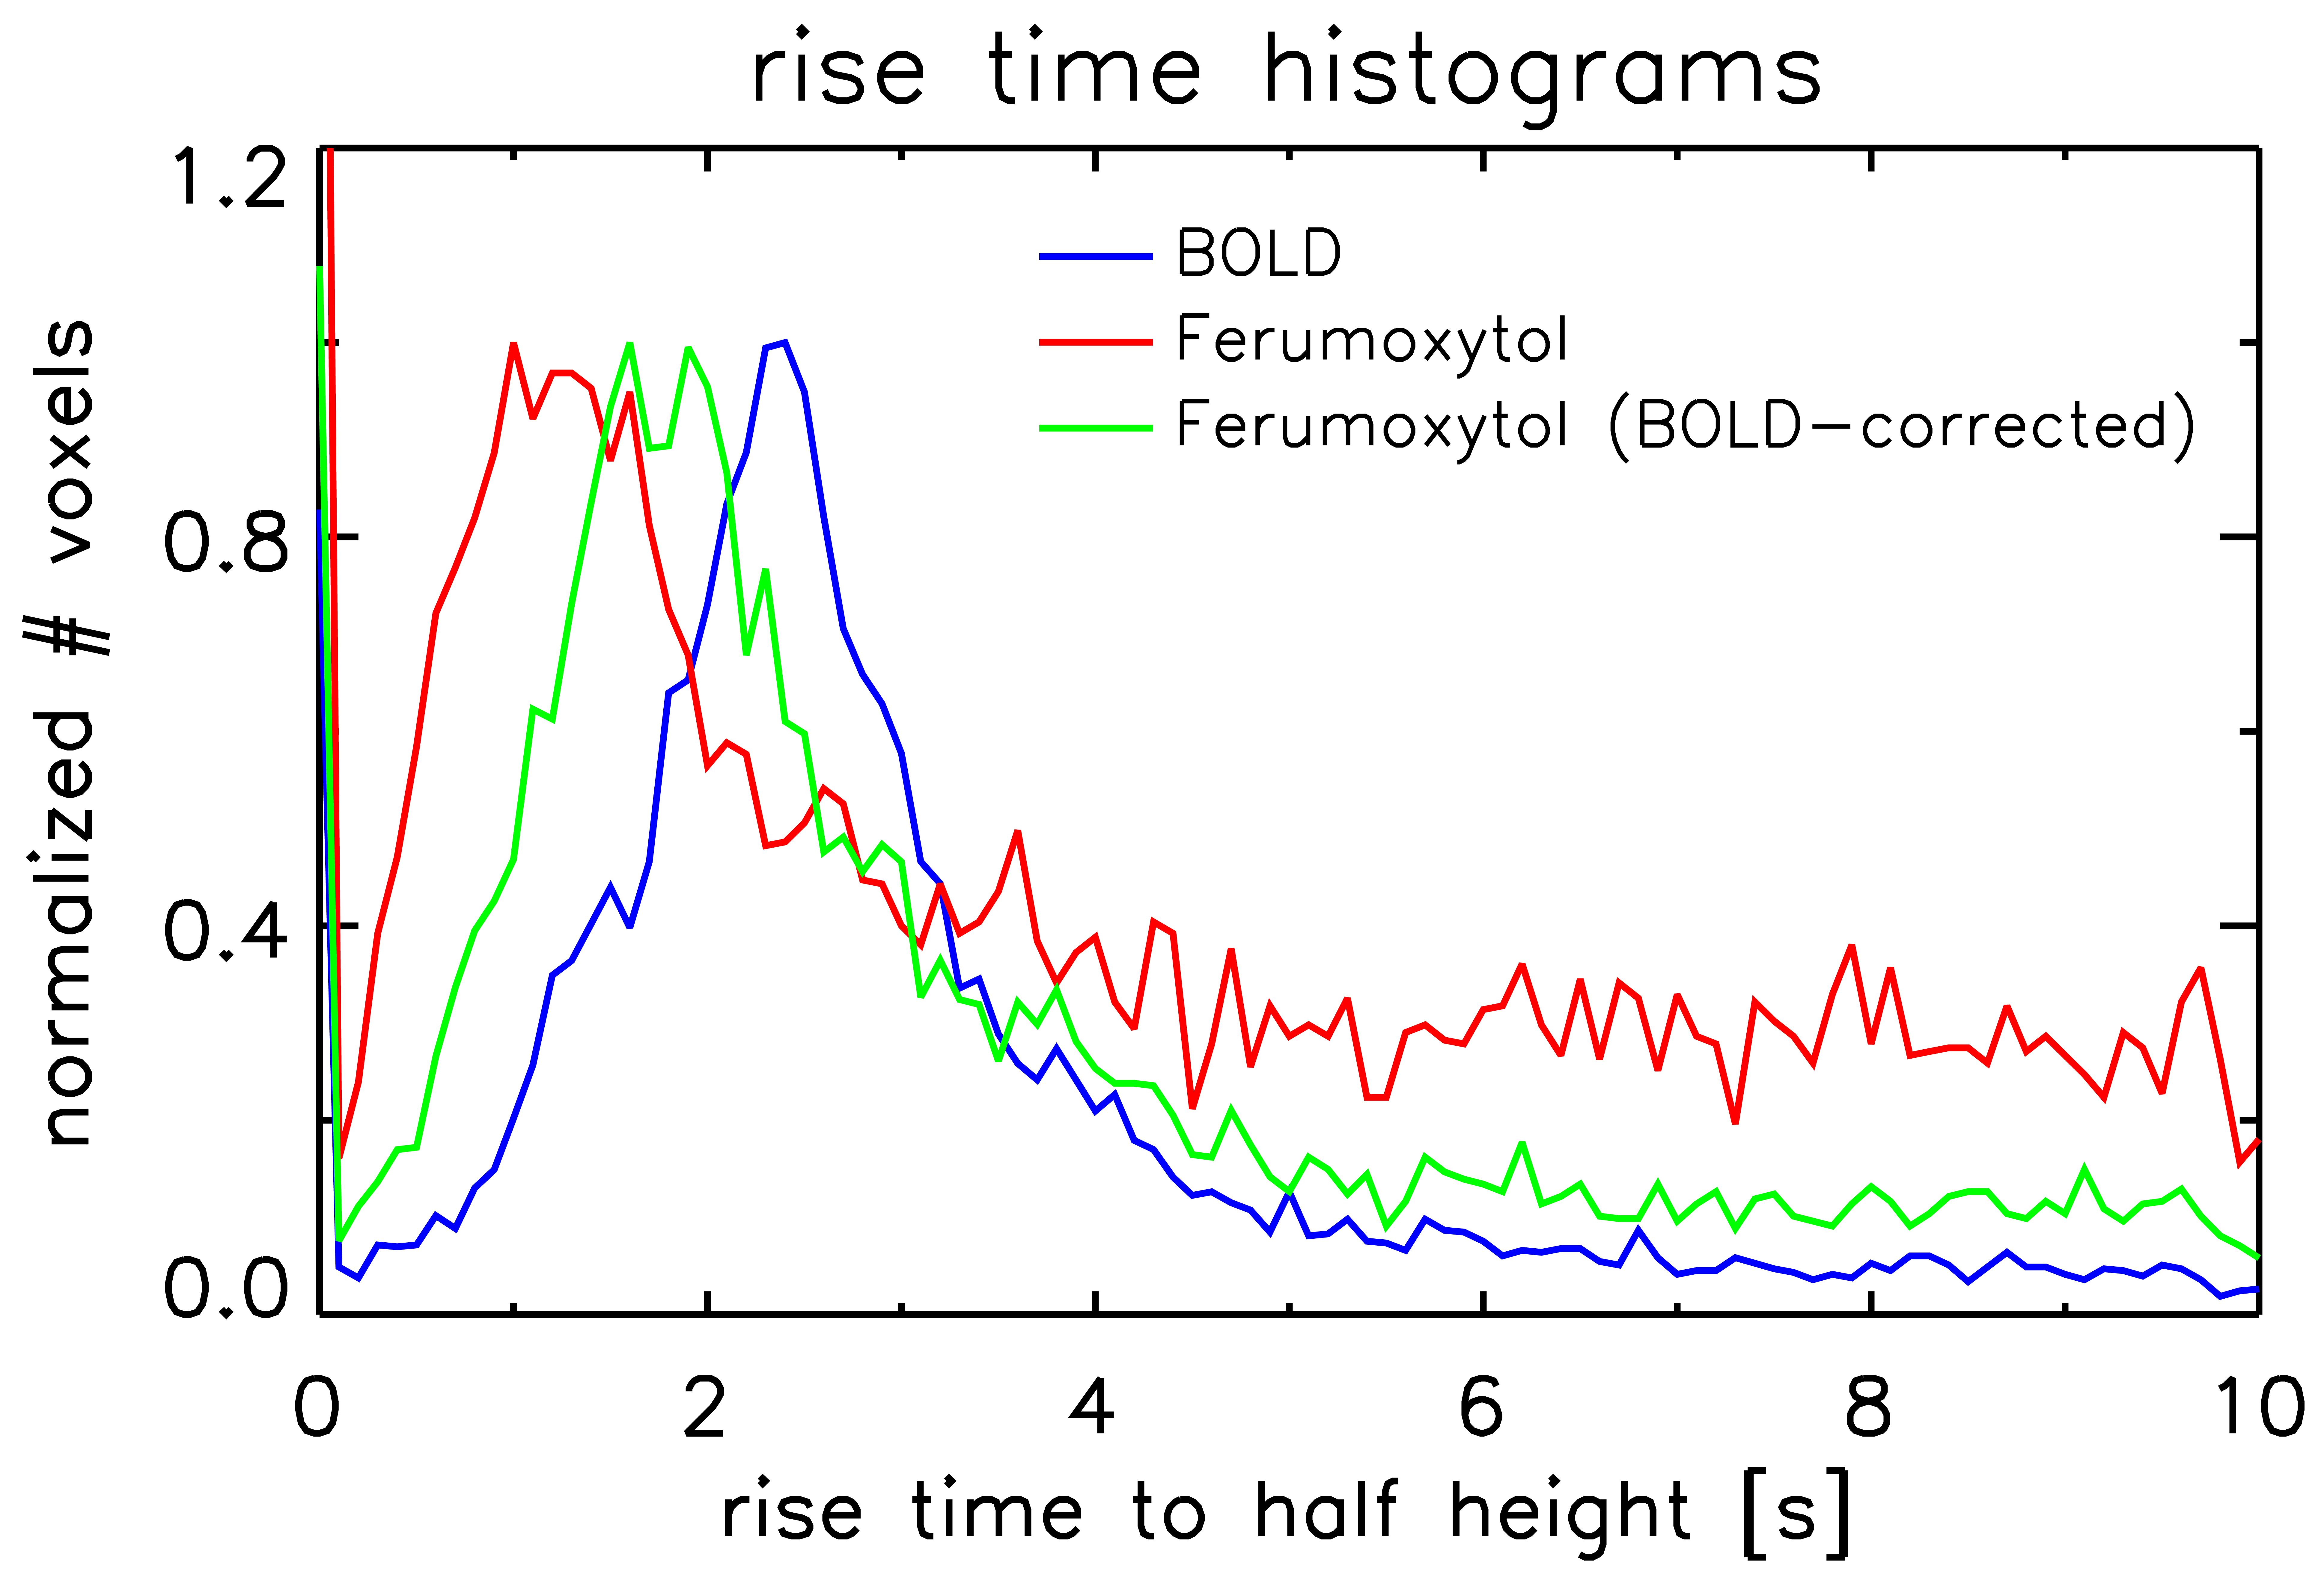
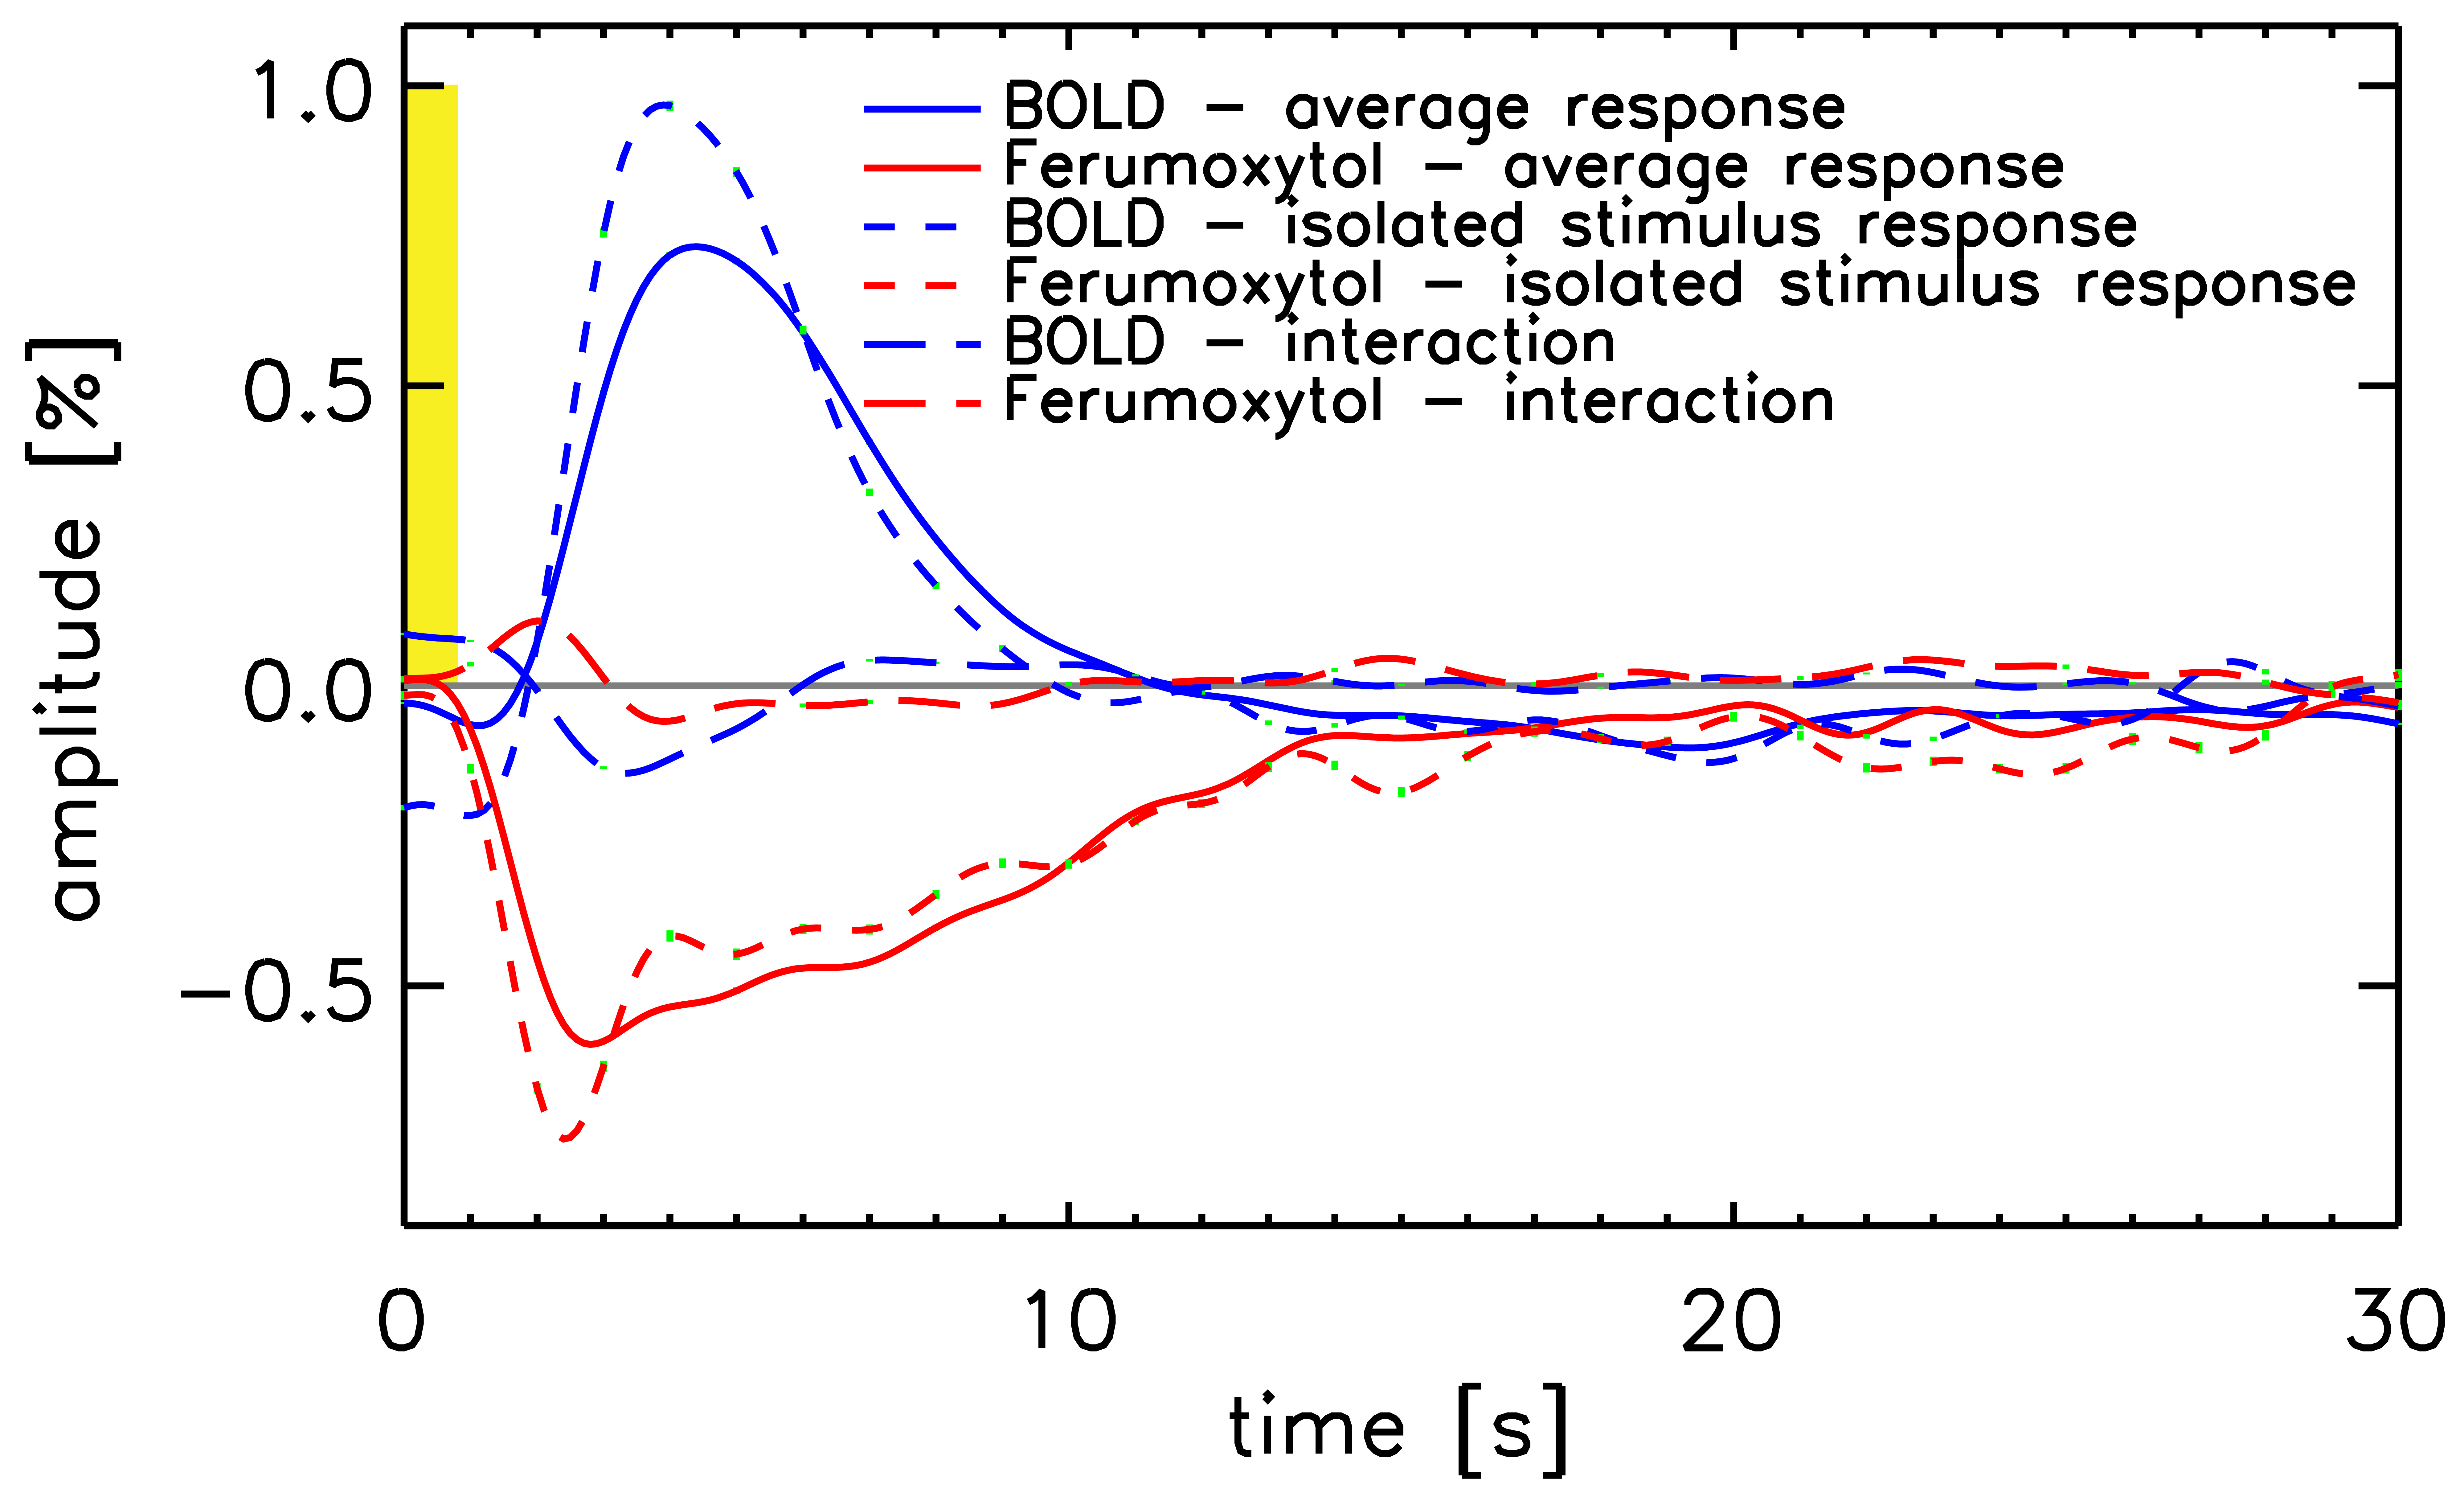
Figure 1 shows t-score maps for BOLD and Ferumoxytol block paradigm experiments for the same subset of slices from one volunteer (Figure 1a), as well as mean signal time-courses for all 11715 voxels (2929±730 per volunteer) that were significantly activated in both block paradigm experiments (Figure 1b). Paramagnetic Ferumoxytol causes signal decease when CBV is increased during activation, explaining the opposing contrast. Figure 2 shows the impulse-response to an 800ms-duration stimulus for BOLD and Ferumoxytol, averaged over the same 11715 voxels. Note that the BOLD response is still present in the Ferumoxytol data, counteracting the Ferumoxytol-driven negative signal change. The observed Ferumoxytol IR can be corrected for this by subtracting a scaled version of the corresponding BOLD response for each voxel. The resulting estimated CBV-IR curve is also shown in Figure 2. The insert shows normalized versions of the three IR curves, showing the earlier onset and peak of Ferumoxytol versus BOLD. Figures 3 and 4 further illustrate that time-to-peak and rise-time to half of peak height in a substantial fraction of the Ferumoxytol voxels are about a second faster than for BOLD. Figure 5 shows the measured responses and inter-stimulus interactions, presumably vascular in origin, that were observed in the BOLD and Ferumoxytol experiments. The measured IR curves, affected by this interaction, are shown, as well as the corrected IR curves to an isolated stimulus (which are the curves shown in Figure 2). Peak amplitude of the interaction was 14.9% and 13.9% of the maximum IR for BOLD and Ferumoxytol, respectively.Discussion
These results confirm previous findings from animal data, namely that onset time of SPIO-fMRI, which is CBV-dominated, is earlier than conventional BOLD. In most voxels, this timing difference was about a second. Arterial and capillary transit time are a likely source of this observation. The interaction-effects in BOLD and Ferumoxytol IR are similar in magnitude (~15% of the main response), and in line with what was found in earlier work investigating vascular nonlinearities using the same stimulus paradigm[5], in which care was taken to suppress neuronal interactions by using a minimal stimulus separation of 200ms. Ferumoxytol data were found to be noisier, presumably due to the lower contrast to noise ratio (similar percentage signal change in lower-SNR images), possibly exacerbated by increased motion sensitivity due to increased spatial image contrast. A larger spread in Ferumoxytol IR TTP is suggestive of both arterial and venous contributions. These data could be used to infer capillary transit time, but additional analysis, and possibly data, is required to test that hypothesis.Acknowledgements
The authors thank Drs. Silva and Koretsky (Laboratory of Functional and Molecular Imaging, NINDS, National Institutes of Health, Bethesda, MD, USA) for discussions. This research was supported by the Intramural Research Program of the National Institute of Neurological Disorders and Stroke, National Institutes of Health.References
[1]Qiu, Zaharchuk, Christen, Ni, Moseley (2012), Contrast-enhanced functional blood volume imaging (CE-fBVI): enhanced sensitivity for brain activation in humans using the ultrasmall superparamagnetic iron oxide agent ferumoxytol, Neuroimage 62:1762-1731
[2]Silva, Koretsky, Duyn (2009), Functional MRI impulse response for BOLD and CBV contrast in rat somatosensory cortex, Magn Reson Med. 57:1110-1118
[3]de Zwart, Silva, van Gelderen, Kellman, Fukunaga, Chu, Koretsky, Frank, Duyn (2005), Temporal dynamics of the BOLD fMRI impulse response, Neuroimage 24:667–677
[4]Sutter (1987), A practical nonstochastic approach to nonlinear time-domain analysis, Advanced methods of physiological system modeling 1:303-315
[5]de Zwart, van Gelderen, Jansma, Fukunaga, Bianciardi, Duyn (2009), Hemodynamic nonlinearities affect BOLD fMRI response timing and amplitude, Neuroimage 47:1649-1658
Figures