5272
Which fMRI contrast is most specific for high resolution layer-dependent fMRI? Comparison study of GE-BOLD, SE-BOLD, T2-prep BOLD and blood volume fMRI?1SFIM, NIMH, Bethesda, MD, United States, 2FM Kirby Research Center, Johns Hopkins, United States, 3MBIC, Maastricht University, Netherlands, 4NIMH, United States
Synopsis
fMRI at ultra-high field strengths (≥7T) allow submillimeter voxels across different cortical layers. A big challenge to infer layer-dependent activity information, however, is to find an fMRI contrast that has the best combination of local specificity to microvascular responses within cortical layers and sensitivity to detect activity changes. Here we compare contrast mechanisms that have been proposed to be applicable to layer-dependent fMRI, including blood volume fMRI with VASO, SE-BOLD, T2/T1ρ-prep-BOLD, diffusion weighted T2-prep-BOLD. We find that CBV-weighted VASO and T2-prep methods have a favorable compromise between sensitivity and specificity. Hence, we believe that these fMRI methods might be better suited for layer-dependent applications than conventionally used GE-BOLD and SE-EPI.
Purpose
High resolution, cortical depth-dependent (layer-specific) fMRI has the potential to address questions about top-down and bottom-up driven connectivity. There are two major limitations for the application of neuroscientific cortical depth dependent studies. A) the limited contrast-to-noise-ratio (CNR) with decreasing voxel volume, and B) the unwanted functional sensitivity to large locally-unspecific blood vessels distant of the activated cortical layer. Until today there is no consensus which kind of fMRI modality would provide the best compromise between CNR and local specificity to investigate depth-dependent activity signals. The purpose of this study is to compare a variety of fMRI methods including, GE-BOLD, SE-BOLD, VASO-CBV, T2-prep, and diffusion-weighted T2-prep. We do this comparison with the focus to layer-dependent activity in the human motor cortex during a finger tapping task.Methods
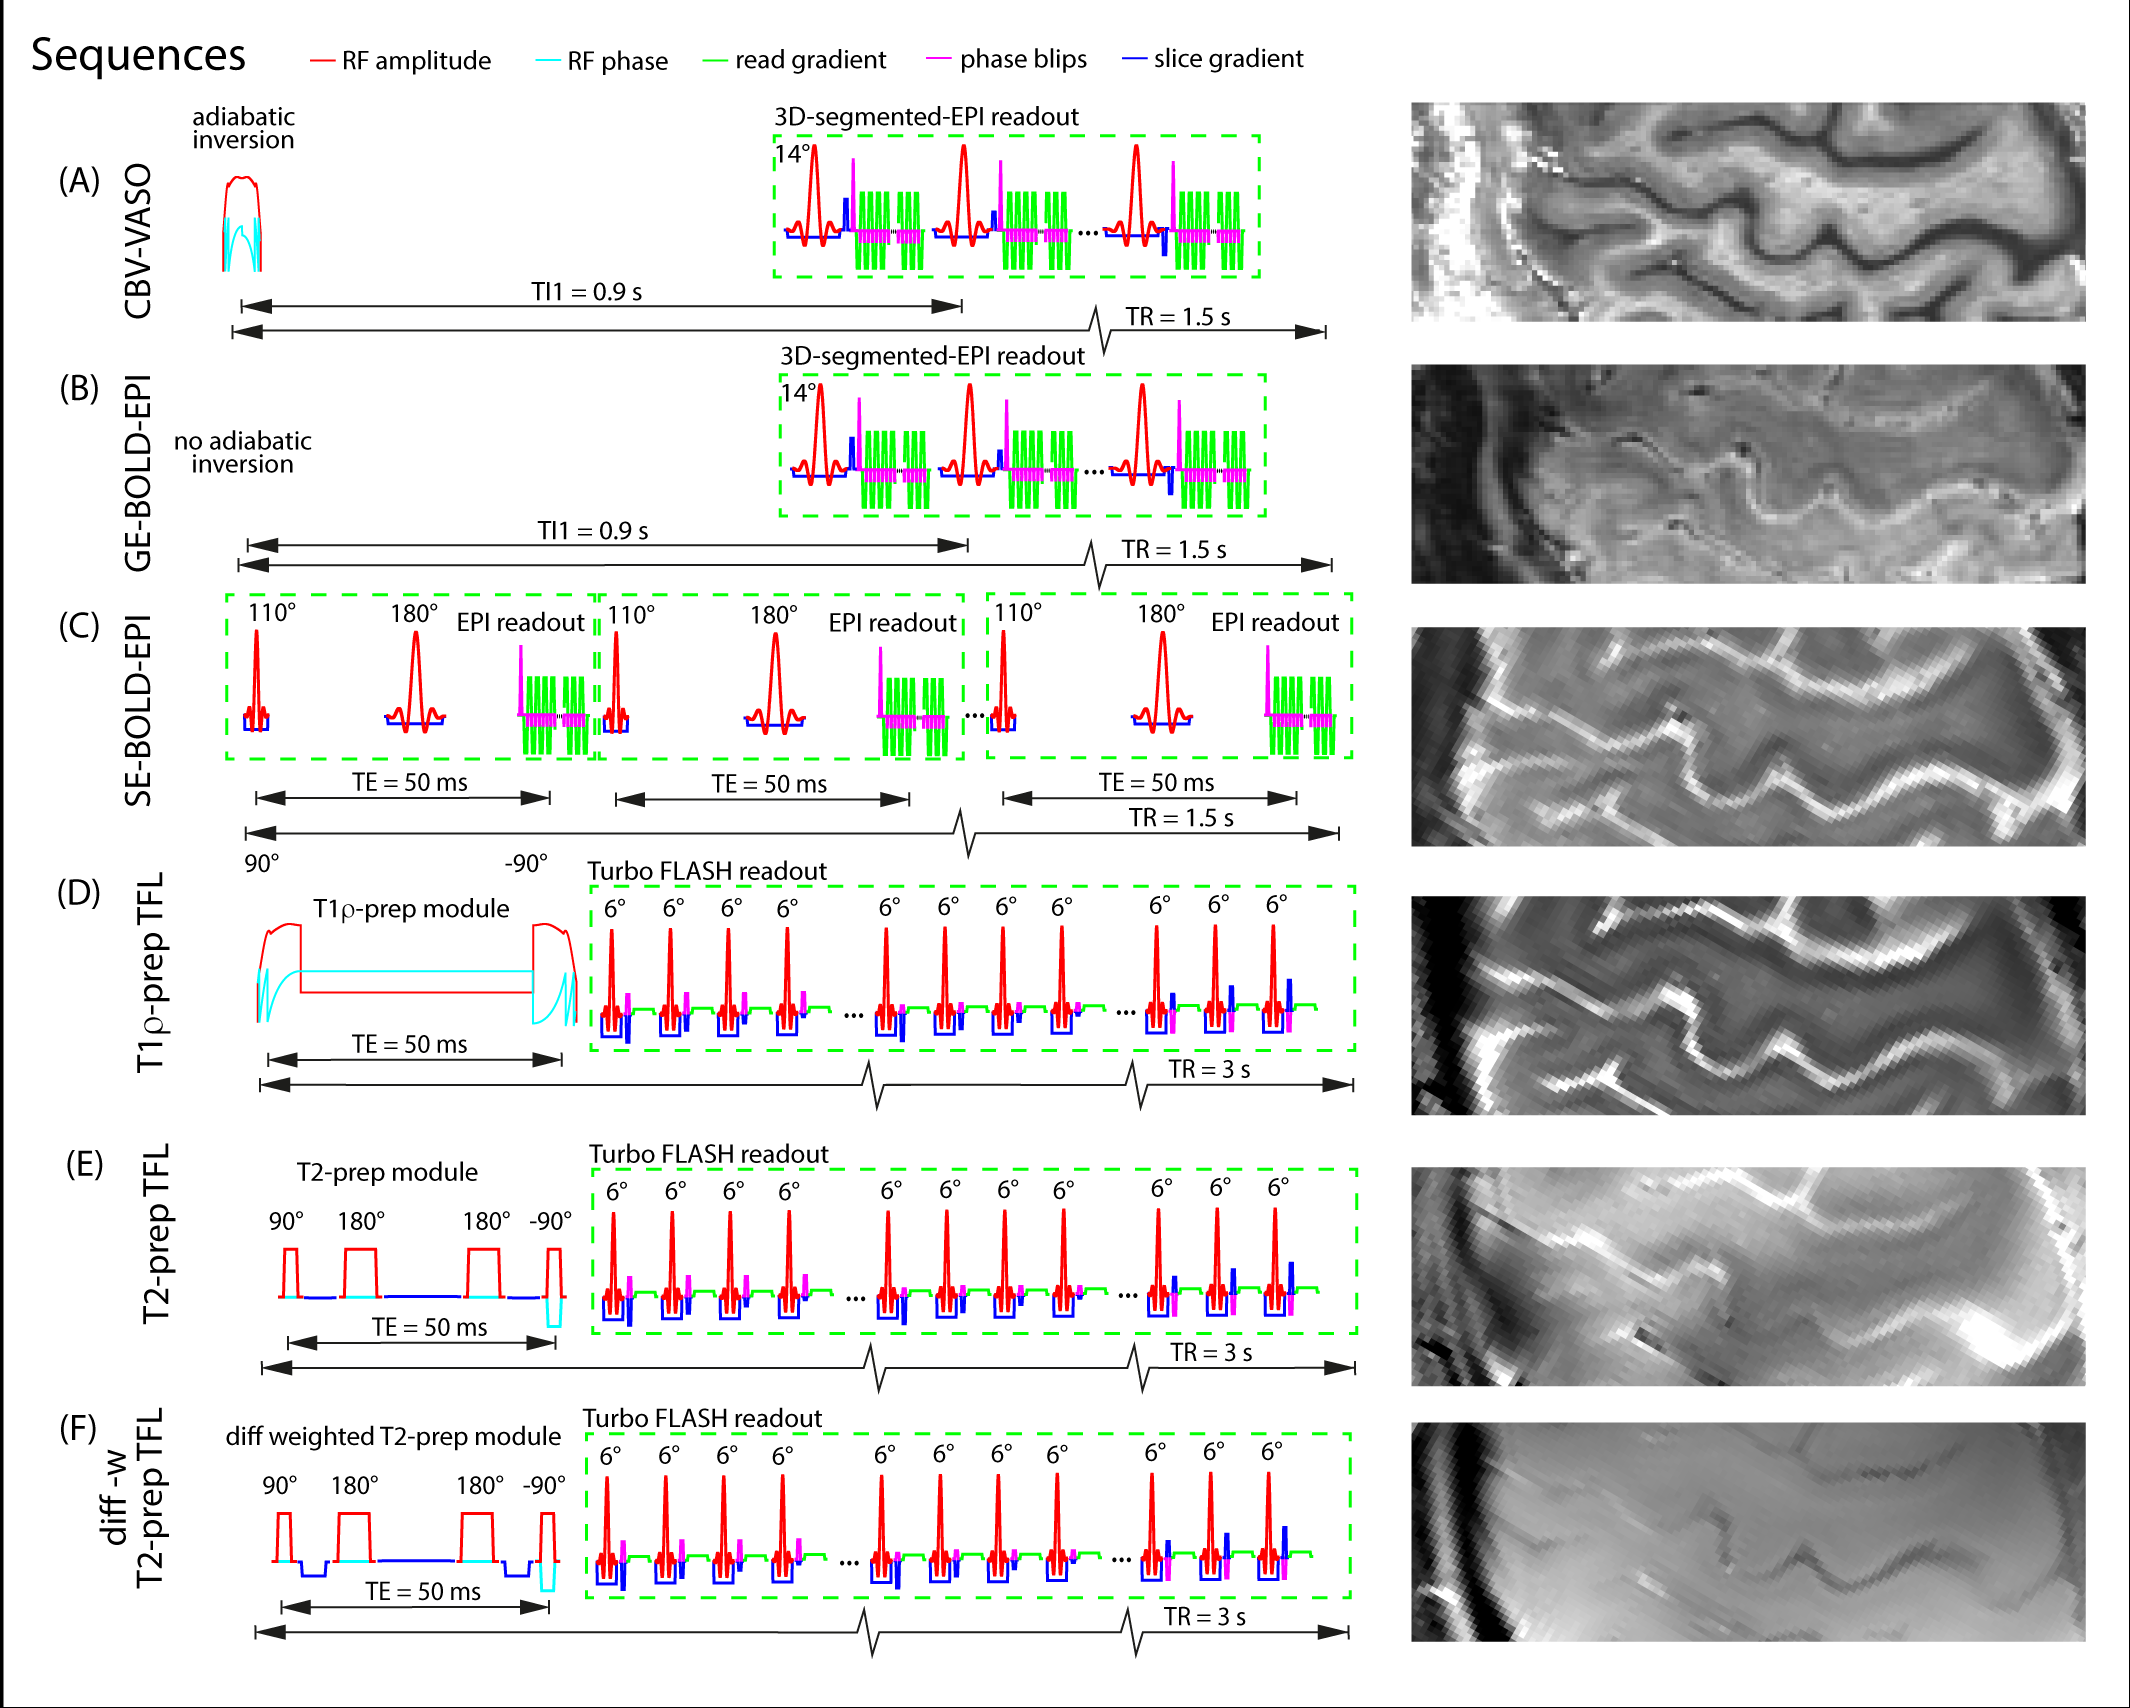
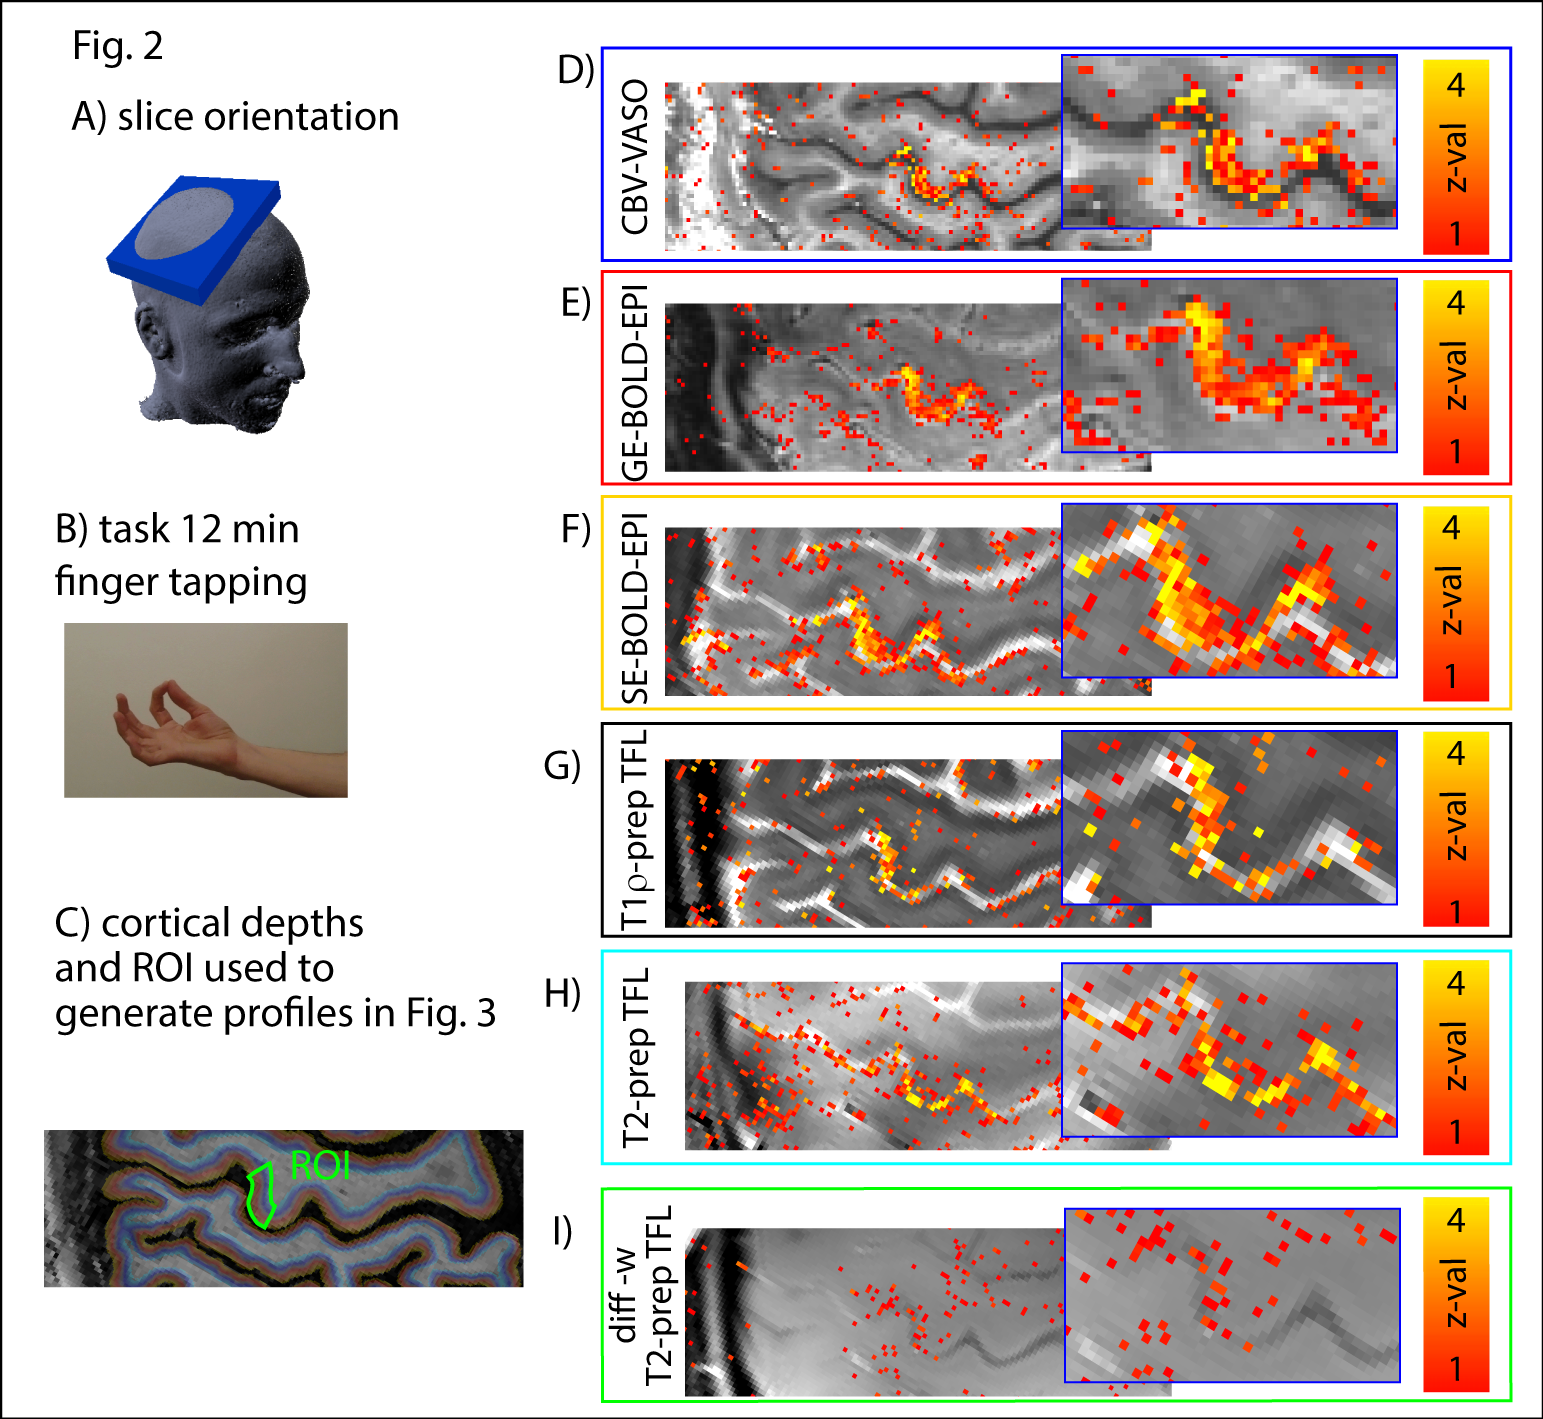
Experiments were performed on a 7T Siemens scanner with a 32-channel NOVA head-coil. Four volunteers participated in 18 experiments. Simultaneous CBV-VASO (Fig. 1A) and GE-BOLD (Fig. 1B) data are acquired analogously to [1] (TE = 22ms). The SE-BOLD (Fig. 1C) was acquired with a C2P sequence is from (https://www.cmrr.umn.edu/multiband/) (TE = 50 ms) [2]. For functional T2-weighting, T1ρ-prep [3] was implemented with a spin locking pulse on resonance, where T1ρ ≈ T2 [4]. We included a custom-designed adiabatic spin-locking pulse that is optimized for 7T. The magnetization is kept in the transverse plain (on-resonance) for TE = 50 ms (Fig. 1D). An alternative T2-prep (Fig. 1E) contrast was generated by re-implementing the Phillips sequence from [5] into the SIEMENS environment (prep TE = 50 ms). In order to minimize unwanted unspecific intravascular T2-BOLD signal within large pial veins, we included small diffusion weighting crusher gradients [6]. All experiments were conducted with 0.7 mm x 0.7 mm in-plane nominal resolution. 1.5 mm thick slices are aligned to be perpendicular to the cortical surface of M1 (Fig. 2A). All scans used GRAPPA 2 acceleration (left-right). A 12-min finger-tapping paradigm was used here to investigate the layer-specificity of the different methods. Layering analysis was done in the respective functional datasets analogous to [1].Results
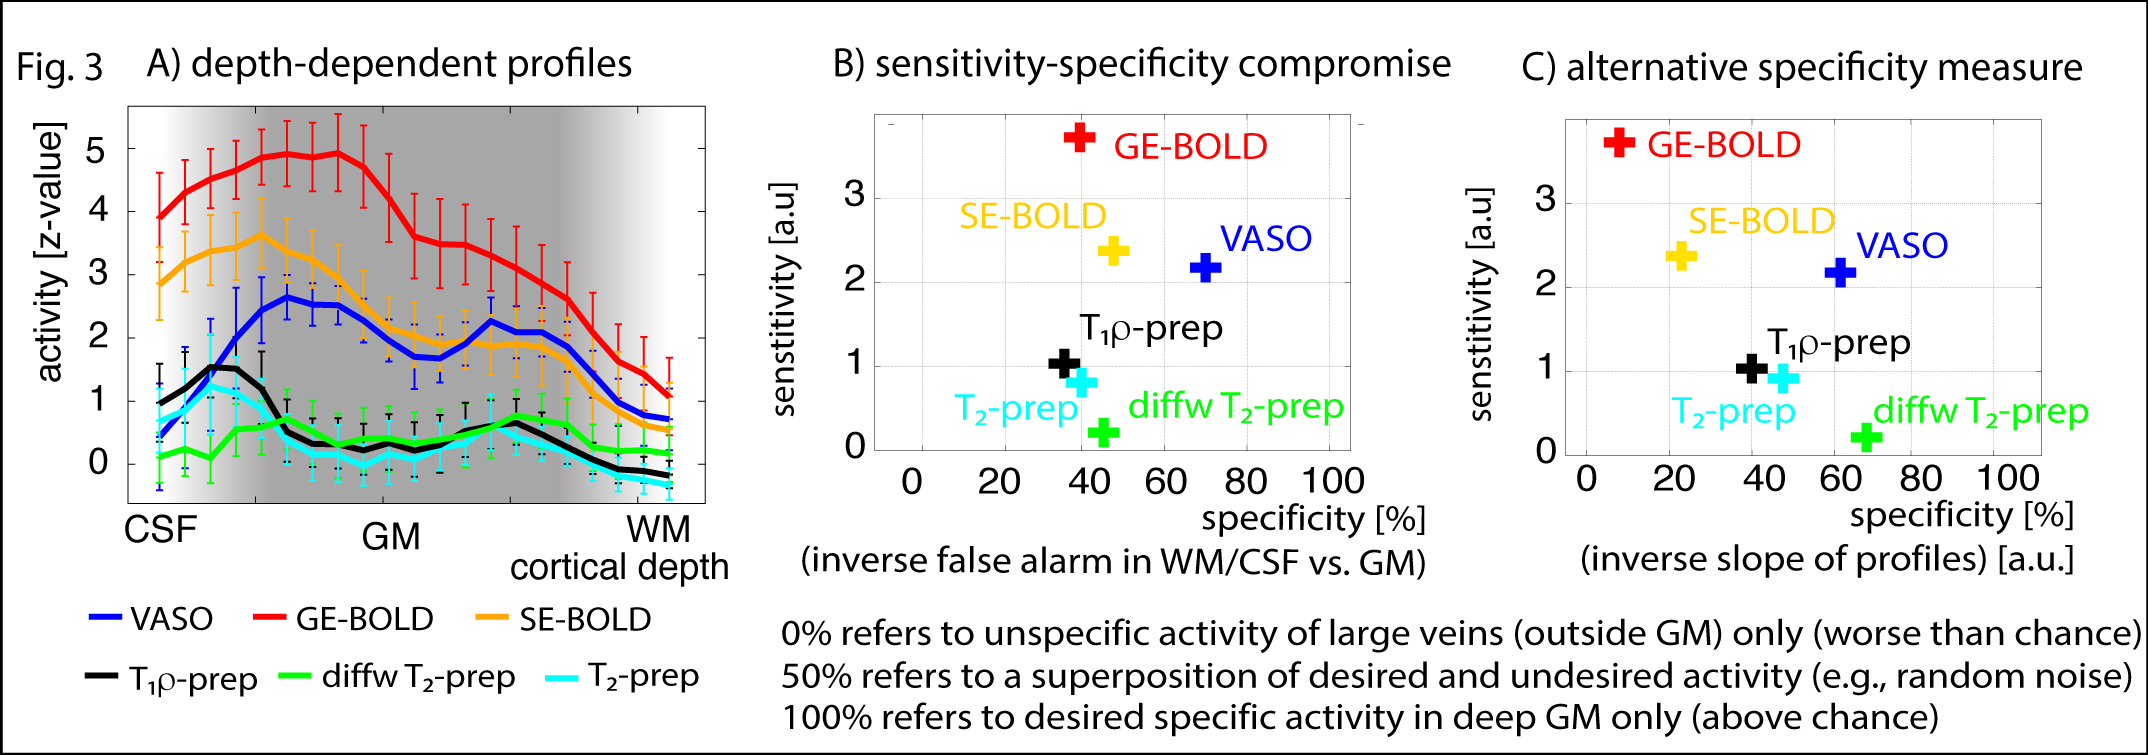
High resolution tapping induced activity is depicted in Fig. 2. GE-BOLD signal has the highest CNR but the strongest contamination of large veins. T2-prep sequences and VASO seem to be less dominated from locally unspecific big blood vessels above the cortical surface, but they are more limited by CNR. CNR is estimated here as the signal change times the tSNR, normalized by the square root of the repetitions per unit of time. VASO, T1ρ/T2-prep, are able to reveal distinct layer-dependent activity in deeper cortical depths (Fig. 2 D/G/H and Fig. 3A). GE-BOLD and SE-BOLD fail to reveal layer-dependent peaks presumably due to their limited specificity, while diffusion-weighted T2-prep seems to fail to reveal layer-dependent peaks presumably due to its limited sensitivity.Discussion
The fact that SE-BOLD with EPI-readout has large unwanted sensitivity to pial veins might be coming from T2*-contaminations in off-center k-space lines as shown in [7,8]. This T2* component can be minimized in a T1ρ-prep method using a TurboFLAH readout. When diffusion gradients are applied, the additionally unwanted sensitivity to intravascular blood in large pial veins is reduced. This, however, is accompanied with a substantial loss of activation detectability. The limited SNR in the diffusion weighted T2-prep might also come from incomplete refocusing in the 90º-180º-180º-90º module, when B1+-inhomogeneities are present. Future comparisons with alternative promising functional T2-weighted imaging modalities, such as 3D-GRASE [8], RARE/TSE [9], SSFP [10] could make this comparison study more complete.Conclusion
Fig. 3B/C shows that in a simplified picture, those functional contrasts that have a high CNR have in turn a low specificity and vice versa. Dependent on the expected functional contrast change expected VASO might provide a good compromise between CNR and specificity, as is an outlier in the negative correlation between sensitivity and specificity in Fig. 3C.Acknowledgements
The research was supported by the NIMH Intramural Research Program (#ZIA-MH002783).References
[1] Huber et al., ISMRM, 2016, #948;
[2] Auerbach et al., MRM, 2013, 69:1261-1267;
[3] Rane et al., MRI, 2014, 32:813-818;
[4] Taheri and Sood, MRI, 2006, 24:51-59;
[5] Hua et al., MRM, 2014, 72:1530-1540;
[6] Boxermann et al., MRM, 1995, 34:4-10;
[7] Goense et al., MRI, 2006, 24:381-392;
[8] Kemper et al., Front Neurosci, 2015, 9:163;
[9] Poser et al., MAGMA, 2007, 20:11-17;
[10] Gao et al., Front Neurosci, 2014, 8:49.
Figures