5270
A study of identifying patients with Alzheimer’s disease based on resting-state fMRI1Harbin Institute of Technology Shenzhen Graduate School, Shenzhen, People's Republic of China
Synopsis
Based on resting-state fmri (rs-fMRI) data, this study aims to investigate the method of identifying AD and normal controls through the procedure of feature extraction and pattern recognition. We extracted the ALFF and ReHo parameters based on pre-processed resting-state fMRI data, and calculated some key parameters in graph theory through the functional connectivity network. Then the examination of the reliability of those features shows a satisfactory recognition rate of 94.4% to distinguish AD and normal controls.
Introduction
Previous researches shows progresses on extracting latent fmri characteristic parameters of Alzheimer’s disease (AD), such as ALFF1, ReHo2 and several others from the analysis of the graph theory on functional brain networks. In this article, we comprehensively extracted the characteristics of AD incorporating the ALFF, ReHo combined with the parameters of graph theory on functional brain networks, then tested the reliability of these selected features with Support Vector Machine (SVM), which shows a 94.4% recognition rate of AD.Methods
Rs-fmri data of 20 AD and 20 normal controls, with no significant difference detected in their age or gender, were acquired from the Alzheimer’s Disease Neuroimaging Initiative (adni.loni.usc.edu) database. Functional imaging parameters are as follows: TR=3s, TE=30ms, flip angle=80°, FOV: RL=3.3125mm/AP=198.75mm/FH=159mm, slice thickness=3.31mm, slices = 48; T1-weighted MPRAGE sagittal imaging parameters are : TR=6.8s, TE=3.1s, FOV: RL=204mm/AP=240mm/FH=256mm, slice thickness=1.2mm, flip angle=9°, slices =170 voxel size=1mm×1mm×1.2mm. Rs-fMRI data preprocessing was carried out using Data Processing Assistant for Resting-State fMRI (DPARSF)3. The first 10 functional images were discarded for the instability of the initial signal. Then, After slice-time correction, motion correction was performed. Using echo-planar imaging (EPI) template, the data was normalized into the Montreal Neurological Institute(MNI)space , images were resampled into 3-mm isotropic voxels. Then the spatial smoothing and band-pass filtering (0.01-0.08 Hz) were performed. At last, the whole-brain signal, the white matters, the cerebrospinal fluid and six head motion signals were removed by a multiple linear regression analysis. The ALFF and ReHo of each voxel were extracted using DPARSF, being divided by the global mean ALFF value and the global mean ReHo value respectively. ALFF and ReHo maps were divided into 90 regions using Anatomical Atlas Labeling (AAL) template, in each region of interest (ROI), mean and variance of ReHo and ALFF were calculated. The functional connectivity matrices were built and analyzed with Graph Theoretical Network Analysis (GRETNA)4 toolbox, each ROI in the AAL atlas was defined as a node, then we calculated the Pearson correlation coefficients between the time sequence of all pairs of nodes to construct the functional connectivity networks. Among the results of network analysis, area under the curve (AUC) of clustering coefficient and shortest path length of each node with respect to 36 network sparse degrees from 0.05 to 0.4 were chosen as network parameters. Similarly, AUC of global efficiency of the node, AUC of degree and betweeness of a node, were employed. The ALFF, ReHo and these network parameters of 90 ROIs went through Two-sample t-test (p=0.05) between the AD cohort and normal controls. Parameters with significant difference were chosen as features to train the SVM classifier, recognition accuracy was obtained by the leave-one-out cross validation (LOOCV).Results
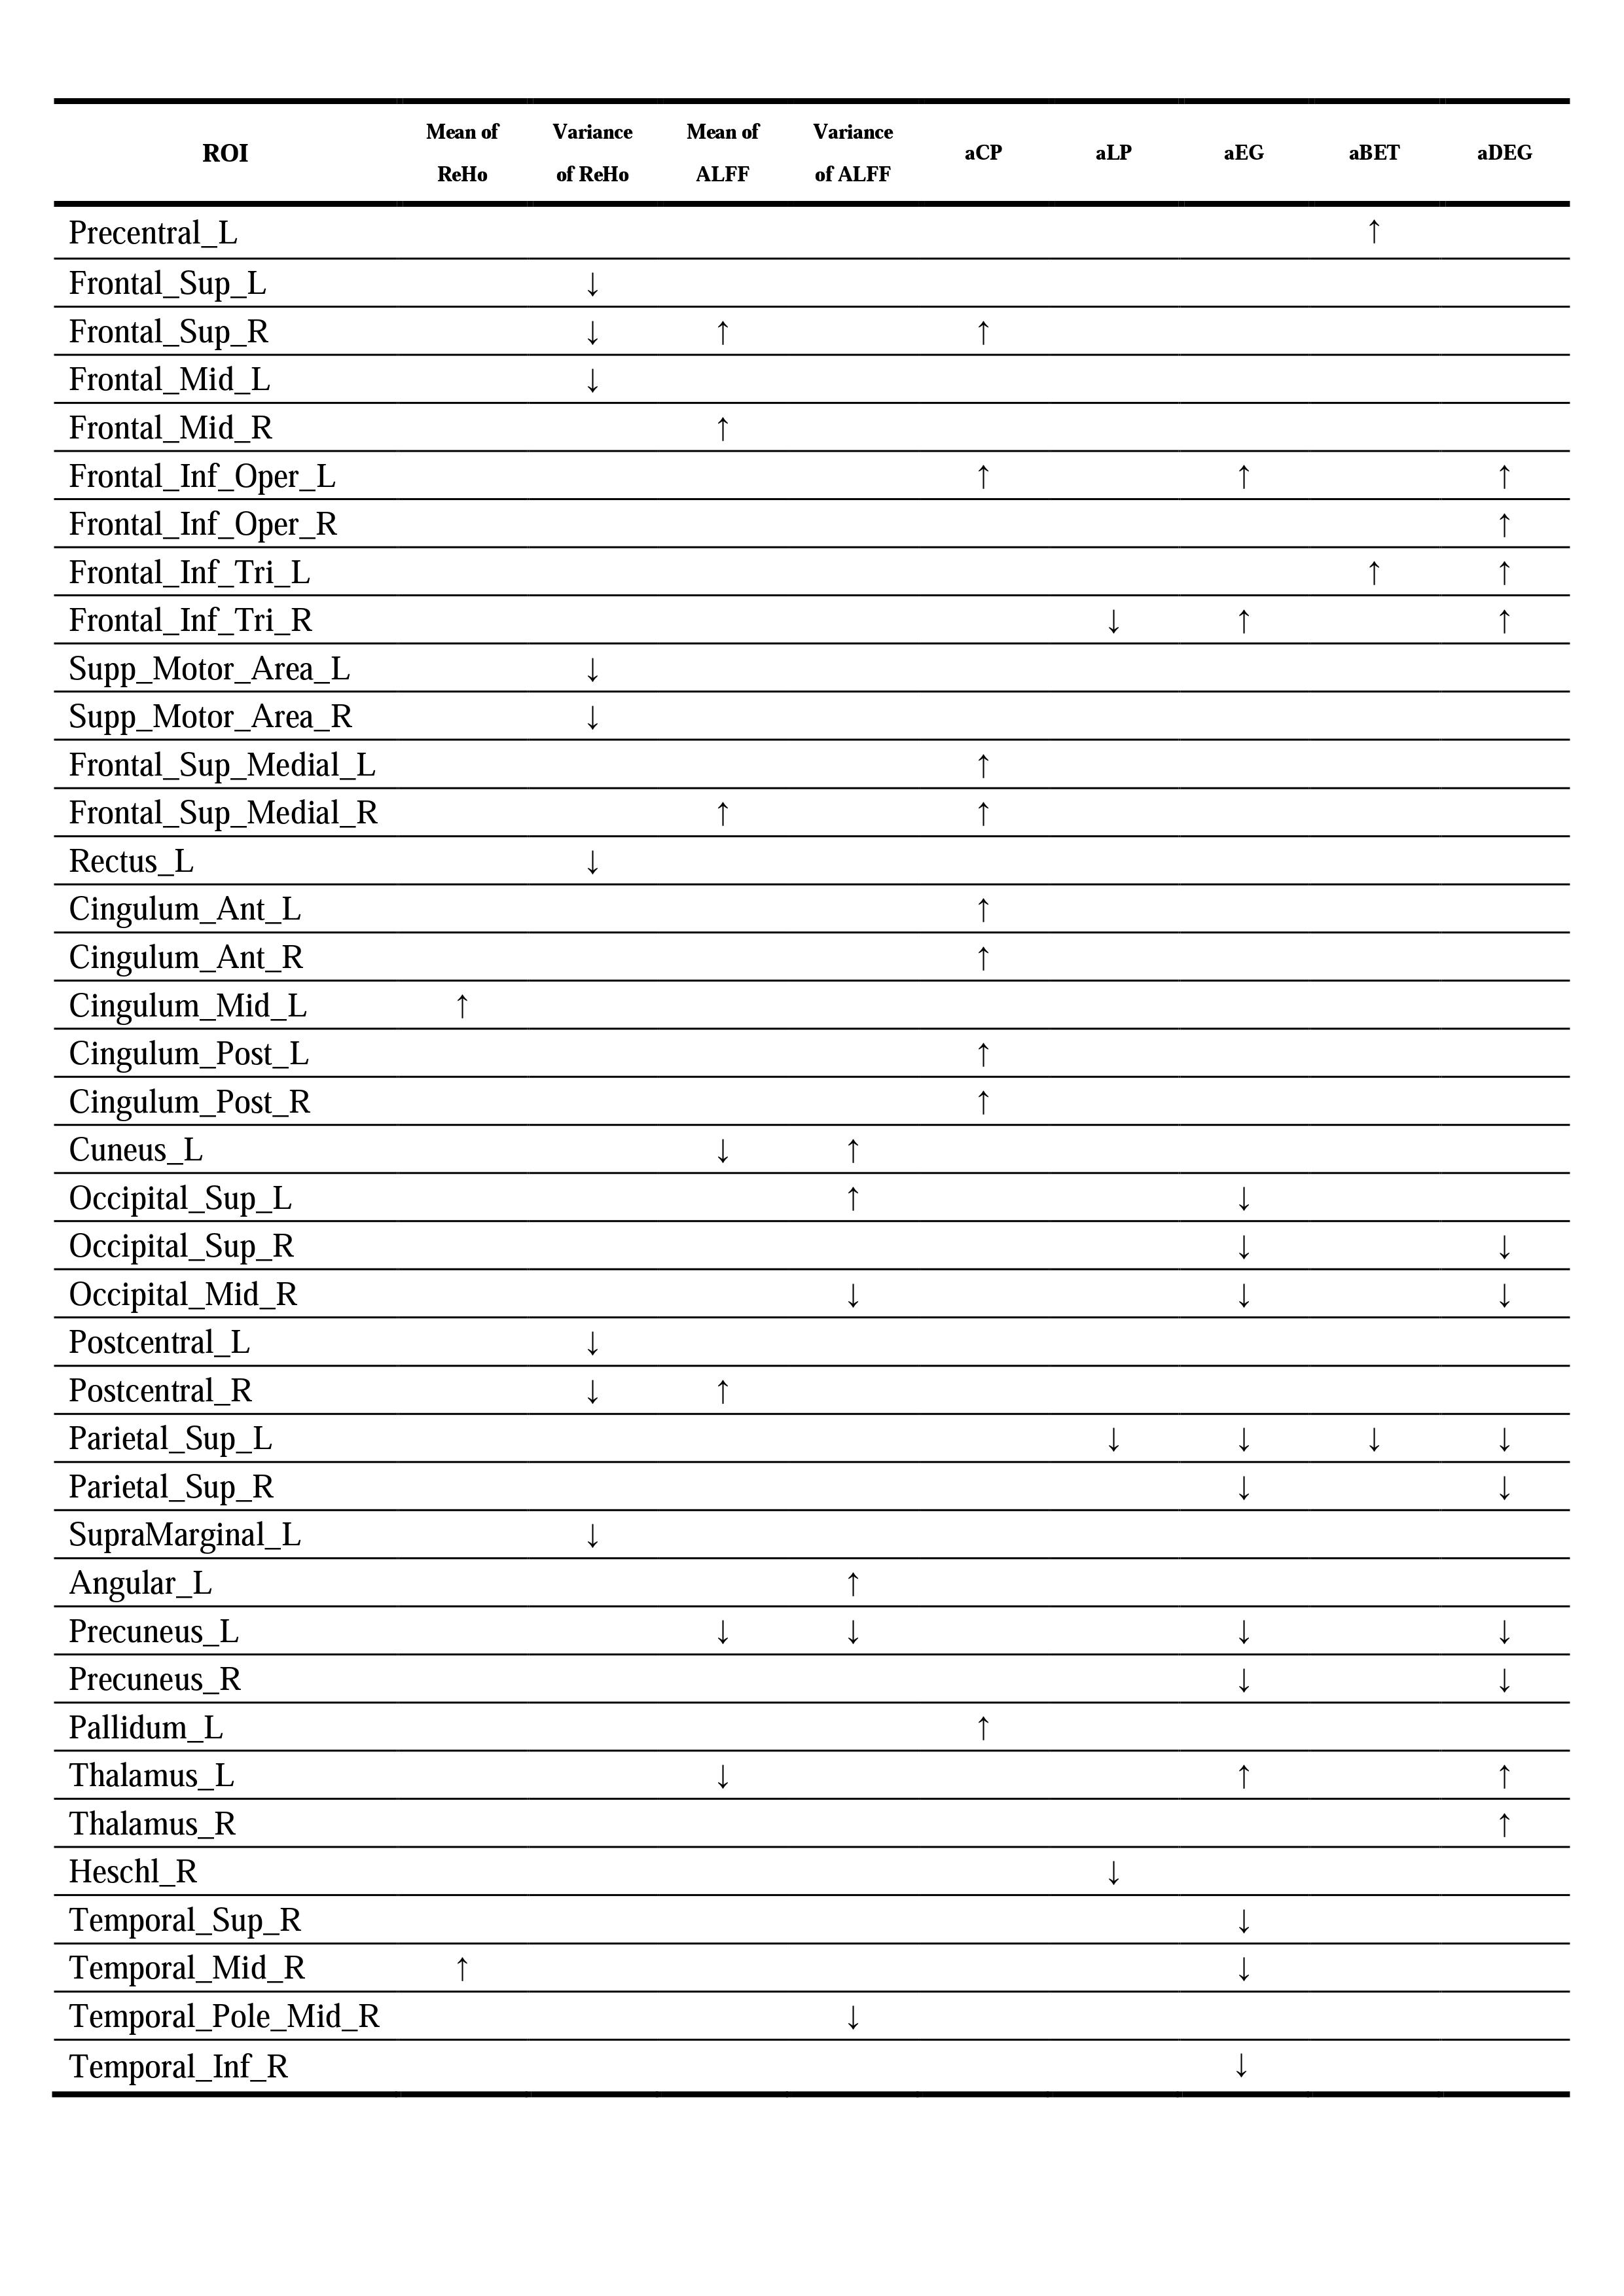
39 ROIs showed significant difference in these parameters, as shown in Table 1. Some structures in frontal lobe, occipital lobe, parietal lobe, temporal lobe, thalamus and so on shows significant changes in more than one parameters. The SVM-LOOCV of these selected features finally shows a 94.4% accuracy rate to identify the AD and normal controls.Discussion
Some rs-fMRI studies investigated the automatic recognition of brain diseases recently. Most of these researches simply studied the functional correlation between different ROIs of brain, which is not enough, since the graph theory models have been widely used in functional connectivity network researches. ALFF and ReHo which were employed as additional feature component are also important parameters in comparing patients with normal controls. SVM was used to test the reliability of these selected features, showing a high accuracy of recognition. Results are shown in Table 1, structures such as Cingulum_Mid_L, Temporal_Mid_R shows an increased mean ReHo, indicating increased regional coherence in these structures of AD cohort compared with normal controls. Significant increase also appeared in the mean ALFF of Frontal_Sup_R, Frontal_Mid_R, Frontal_Sup_Medial_R and Postcentral_R, meanwhile significant decrease appeared in Cuneus_L, Precuneus_L and Thalamus_L, this indicates the alteration of regional spontaneous activity in corresponding ROIs. Increased clustering coefficient in frontal cortex and cingulate gyrus and decreased shortest path length in frontal and parietal cortex may related to the disorder of brain executive control network which will result in the disablement of AD patients. Meanwhile, decreased nodal efficiency in some regions may indicate the degeneration of brain function. This prediction also demonstrated by its correlation with nodal degree and betweeness, which reflect the value of a node plays as a part of the functional network. This study may provide new insights for AD diagnosis through the rs-fMRI.Acknowledgements
Research supported by the Basic Research Foundation of Shenzhen Science and Technology Program (JCYJ20150403161923510), the Key Cultivating Project of Harbin Institute of Technology, and High-end Talent Oversea Returnees Foundation of Shenzhen (KQC201109020052A).References
[1] Zang, Y. F., et al. "Altered baseline brain activity in children with ADHD revealed by resting-state functional MRI. " Brain & Development29.2(2007):83-91.
[2] Zang, Y., et al. "Regional homogeneity approach to fMRI data analysis. "Neuroimage 22.1(2004):394-400.
[3] Chao-Gan, Y, and Z. Yu-Feng. "DPARSF: a MATLAB toolbox for "pipeline" data analysis of resting-state fMRI." Frontiers in Systems Neuroscience 4.13(2010):: 13.
[4] Wang, Jinhui, et al. "GRETNA: a graph theoretical network analysis toolbox for imaging connectomics." Frontiers in Human Neuroscience9(2014):386.
Figures