5269
Bayesian Inference of Brain Oxygenation and Deoxygenated Blood Volume in Acute Stroke using Streamlined Quantitative BOLD1Institute of Biomedical Engineering, Department of Engineering Science, University of Oxford, Oxford, United Kingdom, 2FMRIB Centre, Nuffield Department of Clinical Neuroscience, University of Oxford, Oxford, United Kingdom, 3Acute Stroke Programme, Radcliffe Department of Medicine, University of Oxford, Oxford, United Kingdom
Synopsis
Streamlined Quantitative-BOLD provides a method for quantifying brain oxygen metabolism, in particular, deoxygenated blood volume and oxygen extraction fraction, based on linear fitting of values obtained from an asymmetric spin-echo sequence. It is possible that a curve-fitting approach may yield more robust values for these parameters. This study investigated the feasibility of estimating brain metabolic and vascular parameters through a Bayesian framework, through simulations, and analysis of patient data. It was found that under the current model, simultaneous estimation of oxygen extraction fraction and blood volume was not reliable, suggesting a limit to the model or acquisition protocol.
Introduction
The BOLD MRI signal can be quantified to measure oxygen extraction fraction (OEF) and deoxygenated blood volume (DBV) in the brain1. By streamlining this quantitative BOLD (qBOLD) approach2, its potential in imaging acute stroke has been demonstrated3. Current Asymmetric Spin Echo (ASE) approaches4 have relied on a simple analysis of the qBOLD signal by fitting the signal acquired in two regimes: the spin-echo regime (with ASE refocusing pulse offset τ=0ms) and long τ ASE (τ>15ms). This study aims to fit a continuous model of the qBOLD signal to utilize data from both regimes, and from previously unused short τ values. A Bayesian statistical framework was employed to ascertain the possibility of simultaneously extracting values for OEF and DBV by applying a curve-fitting approach to ASE-qBOLD over a range of τ values.Methods
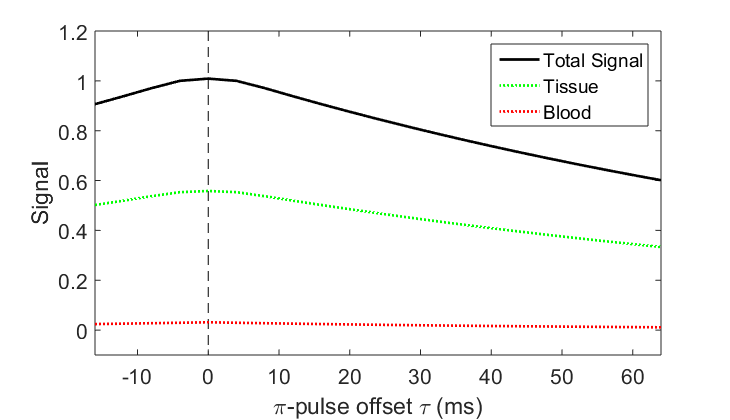
ASE signals from a single voxel with two compartments (parenchyma and venous blood) were simulated with TR/TE=3s/74ms, pulse offset τ=-16:64ms, in steps of 8ms, OEF=0.4, DBV=0.03 (Figure 1). A grid search over parameter space was used to estimate possible distributions of values for OEF and DBV in the presence of Gaussian noise (SNR=50), in order to ascertain estimability.
Patients with acute ischemic stroke were recruited and scanned at 3T under a National Ethics Committee approved protocol. GESEPI ASE scans were acquired with a FLAIR preparation (TI=1210ms) to null CSF signal5 (FOV=220mm2, 96x96 matrix, nine 5mm slabs, 1mm gap, TR/TE=3s/74ms, BW=2004Hz/px, scan duration 4.5 minutes, using the above τ values). Data were processed in FSL6 using standard procedures. The same model as in the simulations was applied as a forward model in FABBER, a variational Bayesian (VB)7 tool within FSL8. Since the preliminary analysis suggested estimation of parameters was not possible, they were estimated independently, with others assigned fixed values9. Data was normalized to the values at the spin echo (τ=0) to remove some of the effect of different R2 values across voxels. Spatial regularization was applied to the posterior distribution of OEF, which is expected to be fairly homogeneous across the brain, but not to DBV, which was expected to have more spatial variability.
Results
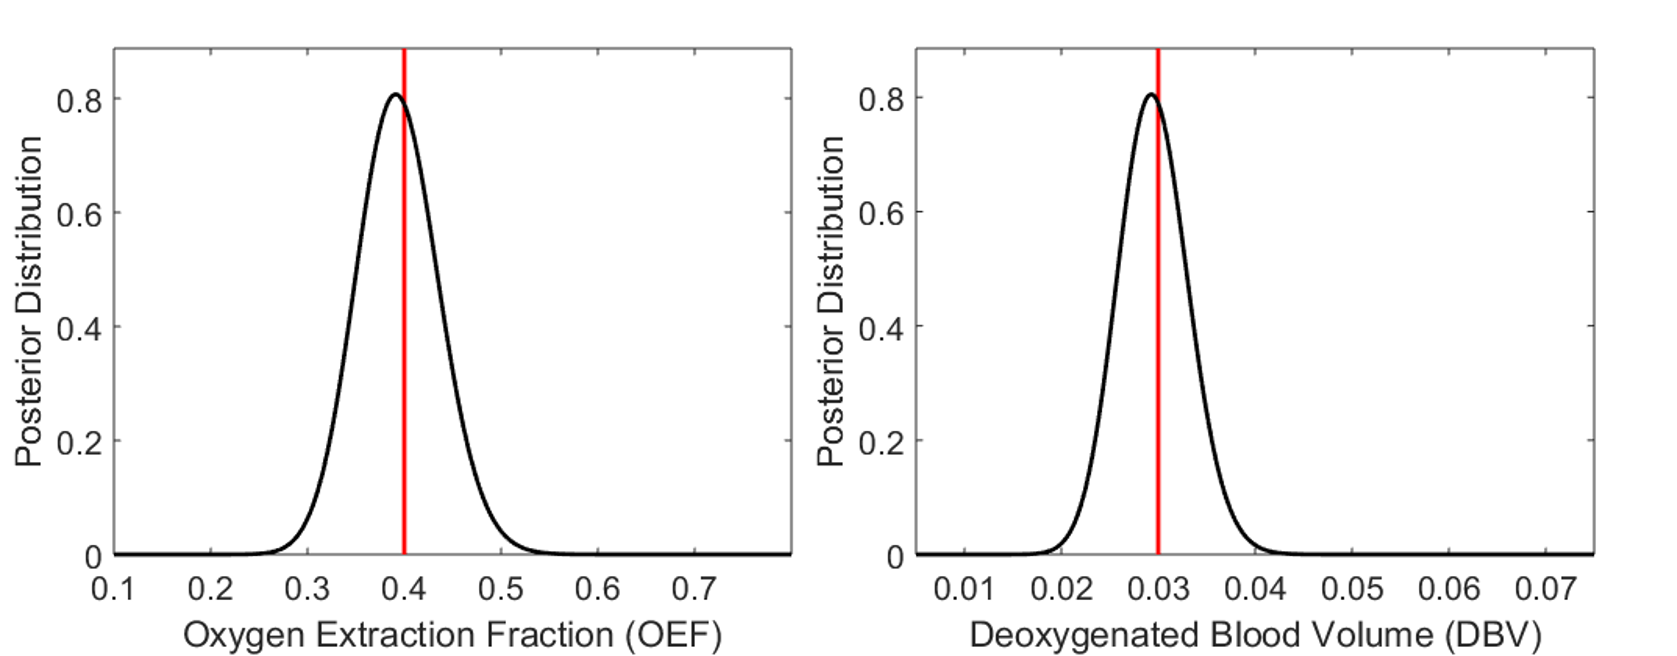
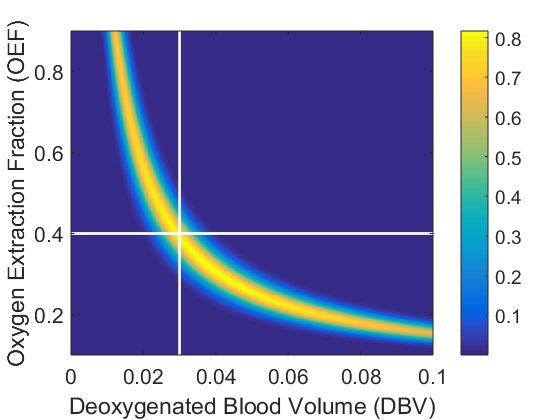
Figure 2 shows the result of 1D grid searches over OEF and DBV separately, with all other parameters fixed at the values that were used in the simulation. OEF was estimated to be 0.39±0.06 (mean±s.d., true value 0.40) and DBV 0.029±0.005 (true value 0.030). Figure 3 shows the result of a 2D grid search, where distributions of both OEF and DBV are estimated simultaneously. In this case, the distribution was non-Gaussian, and demonstrated clear collinearity of the two parameters.
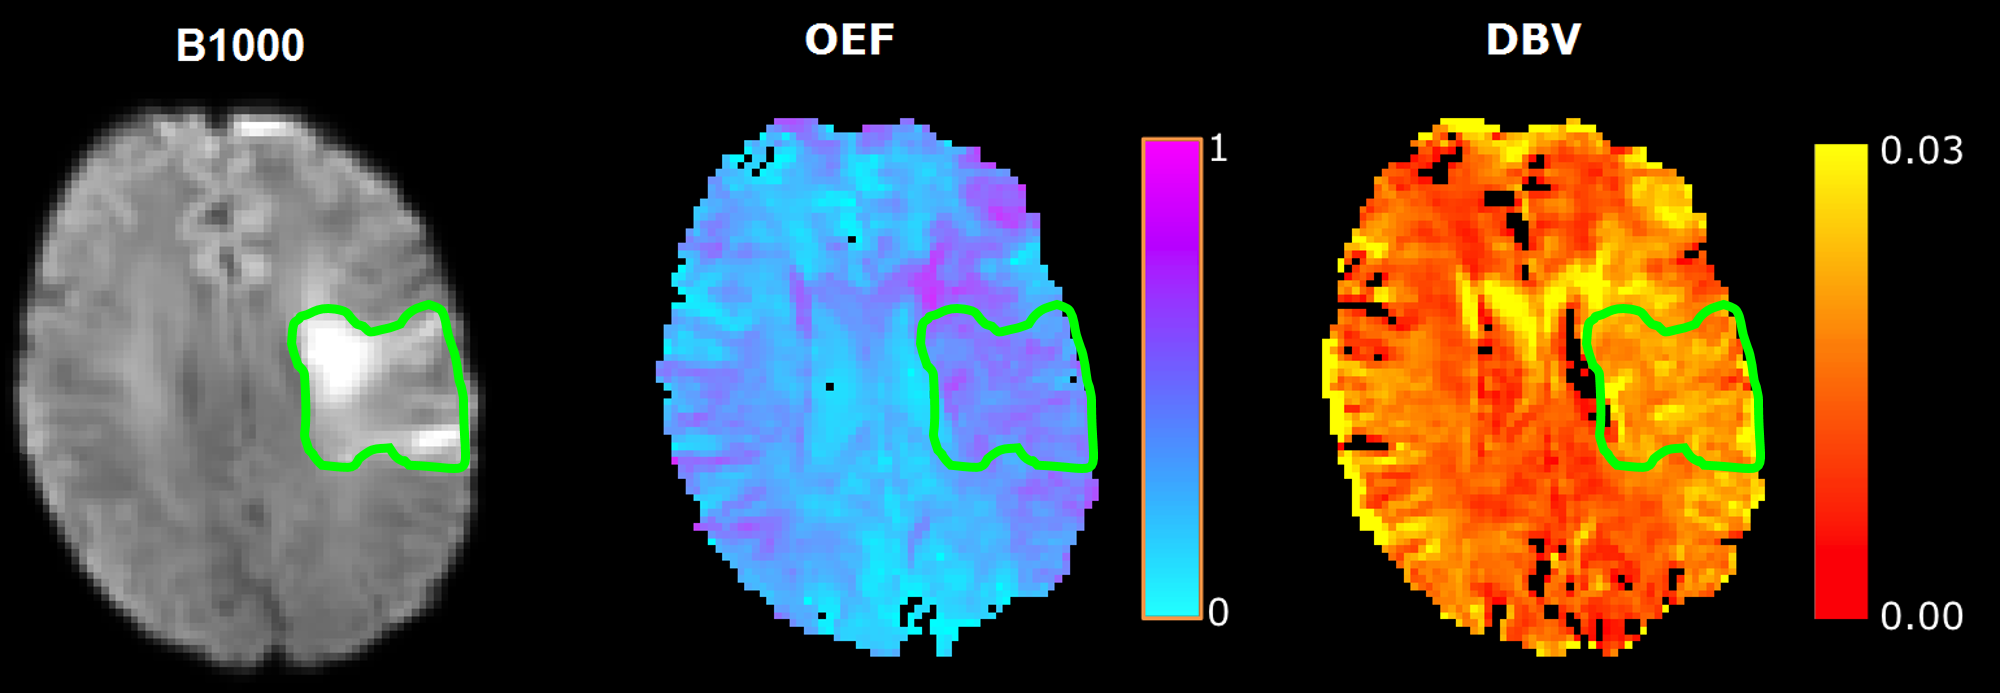
Figure 4 compares maps of fitted OEF and DBV with the b=1000 s/mm2 diffusion map of the same ischemic stroke patient. As expected, OEF and DBV are elevated in the ischemic area; however, the extent of variation in the OEF map is much greater than expected9.
Discussion
Simulations presented here have shown that a curve-fitting approach based on the two-compartment static dephasing model of ASE is not able to reliably estimate OEF and DBV simultaneously. However, the use of a VB framework is valuable in fitting some aspects of the model, and works well in other cases10. It is possible that incorporating prior knowledge of R2 variations (which could not be quantified using ASE alone) could help in separating signal contributions from different components. Modifying the acquisition protocol to incorporate R2 sensitivity (such as by varying TE) may help in this regard.
The assumption of zero diffusion may also have limited the validity of the model, as simulations have shown that incorporating diffusion terms has a significant impact on signal11. It is our intention to develop a model which describes brain physiology more accurately, and to evaluate it using real and simulated data12, to inform further modifications to the acquisition method.
In spite of these limitations, the ASE sequence, combined with fitting values from the static dephasing model, shows potential in improving the quality of stroke diagnosis and assessment because of its ability to show the extent of affected penumbral areas before there is any detectable change to diffusion5.
Conclusion
We have used simulations and patient data to apply curve-fitting within a Bayesian framework to extract parameters from ASE data. Our results suggest that this is not straightforward, and that there is collinearity between OEF and DBV in the regimes considered, which makes quantifying both of them simultaneously problematic. It will therefore be necessary to incorporate further information, such as R2 weighting, or to employ a model that accounts for diffusion, in order to successfully measure both.Acknowledgements
This work was supported by funding from the Engineering and Physical Sciences Research Council (EPSRC) and Medical Research Council (MRC) [grant number EP/L016052/1], EPSRC [grant number EP/K025716/1], the National Institute for Health Research Oxford Biomedical Research Centre Programme, the National Institute for Health Research Clinical Research Network, the Dunhill Medical Trust [grant number OSRP1/1006] and the Centre of Excellence for Personalized Healthcare funded by the Wellcome Trust and EPSRC [grant number WT088877/Z/09/Z].References
1. Yablonskiy DA, Haacke EM. Theory of NMR signal behavior in magnetically inhomogeneous tissues: the static dephasing regime. Magn. Reson. Med. 1994;32(6).
2. Stone AJ, Blockley NP. A streamline approach to mapping the oxygen extraction fraction (OEF) and deoxygenated blood volume (DBV) using the quantitative BOLD technique. Proc. Intl. Soc. Mag. Reson. Med. 23 2015:0219
3. Stone AJ, Harston GWJ, Carone D, Ngwako M, Licenik R, Kennedy J, Blockley NP. Serial quantification of Brain Oxygenation using Streamlined-qBOLD in Acute Stroke Patients. Proc. Intl. Soc. Mag. Reson. Med 24 2016:600
4. Wismer GL, Buxton RB, Rosen BR, et al. Susceptibility induced MR line broadening: applications to brain iron mapping. J. Comput. Assist. Tomo. Tomography, 1988;12(2).
5. Stone AJ, Blockley NP. Serial quantification of Brain Oxygenation using Streamlined-qBOLD in Acute Stroke Patients. Proc. Intl. Soc. Mag. Reson. Med, 24, 2016:600.
6. Jenkinson M, Beckmann CF, Behrens TE, et al. Fsl. NeuroImage, 2012; 62(2).
7. Chappell MA, Groves AR, Whitcher B, Woolrich, MW. Variational Bayesian inference for a nonlinear forward model. IEEE Trans. Signal Process. 2009; 57(1).
8. Groves AR, Chappell MA, Woolrich MW. Combined spatial and nonspatial prior for inference on MRI time-series. NeuroImage, 2009; 45(3).
9. He X, Yablonskiy DA. Quantitative BOLD: mapping of human cerebral deoxygenated blood volume and oxygen extraction fraction: default state. Magn. Reson. Med. 2007; 57(1).
10. Simon AB, Dubowitz DJ, Blockley NP, Buxton RB. A novel Bayesian approach to accounting for uncertainty in fMRI-derived estimates of cerebral oxygen metabolism fluctuations. NeuroImage, 2016; 129.
11. Dickson JD, Ash TWJ, Williams GB. Quantitative BOLD: the effect of diffusion. J. Mag. Reson. Imag. 2010; 35, 953-961.
12. Blockley NP, Holland NC, Stone AJ. The effect of diffusion on quantitative BOLD parameter estimates acquired with the Asymmetric Spin Echo technique. Proc. Intl. Soc. Mag. Reson. Med 24 2016:3731.
Figures