5266
Diffusion functional MRI (dfMRI) yields highly defined tonotopic representation in the in vivo mouseCristina Chavarrias1, Guilherme Blazquez Freches1, and Noam Shemesh1
1Champalimaud Neuroscience Programme, Champalimaud Centre for the Unknown, Lisbon, Portugal
Synopsis
Diffusion fMRI (dfMRI) is highly promising for improving the detection of active regions with higher spatial accuracy, as well as for its potential of resolving faster dynamics than its BOLD counterpart. To test this hypothesis, we compared BOLD and dfMRI in the auditory pathway of the mouse, which exhibits clear tonotopy in electrophysiology. Our findings suggest that dfMRI activation maps are more localized and are in agreement with the expected area of activation in the inferior colliculus; dfMRI signals were also ~3s faster than BOLD signals. These results are expected to enable brainwide characterization of auditory reorganization, function, and plasticity.
Purpose
Functional magnetic resonance imaging (fMRI) provides invaluable information on brain function. However, BOLD may lack spatial accuracy due to recruitment of upstream vasculature, and fast brain dynamics are elusive since vascular couplings are slow surrogate reporters to neuronal activity[1-2]. Diffusion fMRI (dfMRI) has been proposed as a promising alternative to improve spatial accuracy and resolve fast(er) dynamics, through a debated cell-swelling mechanism[3]; however, whether dfMRI could provide a more accurate spatial representation of activity is not yet clear. The rodent auditory system may serve well to investigate such potential advantages. The auditory circuit is highly complex, yet well-characterized electrophysiologically, with the inferior colliculus (IC) in particular exhibiting high degrees of tonotopic representations[4-9]. Here, for the first time, we studied the auditory pathway in mice using both BOLD fMRI and dfMRI, and compared their spatial and temporal fidelities.Methods
All experiments were preapproved by the Institute’s animal ethics committee. Experiments were performed on a Bruker BioSpec 9.4T scanner (20 cm bore) equipped with gradients capable of producing up to 660 mT/m. For transmittance, an 86 mm quadrature resonator was used, while signal detection utilized a 4-channel array cryocoil. Three male C57BI6J mice (~25g) were induced with 4% isoflurane vaporized in enriched air (27% O2) and maintained by a constant subdermal infusion of medetomidine (0.4 mg/kg bolus and 0.8 mg/kg/h[10]). Animal temperature was maintained at 37°C and breathing was monitored throughout. Auditory stimulation (pure-tone) was delivered to a single ear through an in-house sound-delivery setup described in detail elsewhere (ISMRM 2017, submitted). Briefly, the right ear was completely sealed with wax to facilitate acoustic isolation from the environment while the tip of the stimulation tube was inserted in the animals’ left ear pinna. Double Spin Echo EPI experiments were acquired for both BOLD and dfMRI, by setting b-values to 0 and 1500 s/mm2, respectively (specific experimental parameters can be found in Figure caption 1). Each functional run consisted of blocks of 21s stimulation (OFF 45s, ON 21s, 250 images in total) with pure tones sampled from 35:1:39 kHz, and presented in a randomized fashion to avoid habituation; animals were allowed to rest ~3 min between runs. For each animal 4-12 dfMRI and BOLD-fMRI runs were interleaved, leading to a total scan time of ~2h per subject. To spatially compare the brains, they were realigned to mean, normalized together, spatially smoothed with FWHM = 0.3 mm and pooled into 2 groups (BOLD: n=12 runs, and dfMRI: n=18 runs) for GLM fitting and statistical inference. The temporal comparison of BOLD and dfMRI was performed by selecting an ROI (IC) for all animals, baseline correction, and computation of the average cycle for each group. All analyses were performed through SPM®, fMRat[11], MRIcron and Matlab scripts.Results
The SNR measured in the IC was in the range of 17.5-22.5 in the dfMRI EPIs, and 31.6-43.5 in the BOLD EPIs. An example volume is displayed in Figure 1, demonstrating the quality of the raw data in the in-vivo mouse. BOLD contrast (Figure 2) exhibited significant activation of main auditory pathway components, including IC, auditory nerve (AN), lateral lemniscus (LL) and ipsilateral auditory cortex (AuD, Au1), as well as superior colliculus (SC) and the temporal association cortex (TeA). By contrast, dfMRI shows a much sparser activation pattern in IC, SOC, LL and a negative signal in AN. IC activation is known for its tonotopy[9], and therefore we compared dfMRI and BOLD statistical maps via overlay for visual comparison (Figure 3). Clearly, dfMRI activation is localized to a smaller region compared with BOLD. To examine activation dynamics, the overlaid average cycle is plotted in Figure 4, showing a sharper rising slope for dfMRI, which precedes the BOLD curve in approximately 2 repetition times (~3s).Discussion and conclusions
We present the first dfMRI study of auditory pathway in mice. Prior electrophysiological findings describe 35-40kHz stimuli to activate solely the medioventral IC[12]. We find that, in IC, BOLD shows a much larger activation extent, whereas the dfMRI activation extent represents better the expected medioventral preference. Hence, dfMRI appears to better represent the underlying neural activity in terms of spatial localization. Further, when the temporal dynamics of dfMRI and BOLD were compared, we found a clearly faster response onset in dfMRI. This could be highly useful for future mapping of at least some aspects of activation dynamics in the brain through a mechanism different than BOLD. We conclude that in the IC, dfMRI provides a more localized and faster activation information compared with BOLD.Acknowledgements
The authors acknowledge funding from the European Research Council (ERC) under the European Union’s Horizon 2020 research and innovation programme (Starting Grant, agreement No. 679058). We thank Dr. Daniel Nunes for technical assistance.References
[1] Logothetis NK, Pauls J et al., Neurophysiological investigation of the basis of the fMRI signal. Nature. 2001;412(6843):150-157. [2] Heeger DJ, Ress D. What does fMRI tell us about neuronal activity? Nat Rev Neurosci. 2002;3(2):142-151. [3] Tsurugizawa T, Ciobanu L, Le Bihan D. Water diffusion in brain cortex closely tracks underlying neuronal activity. Proc Natl Acad Sci . 2013;110(28):11636-11641. [4] Winer, J.A., Schreiner, C., 2005. The Inferior Colliculus: With 168 Illustrations. Springer, New York, NY. [5] C. Lau, M. Pienkowski, J. W. Zhang, B. McPherson, and E. X. Wu, Chronic exposure to broadband noise at moderate sound pressure levels spatially shifts tone-evoked responses in the rat auditory midbrain, NeuroImage 2015, vol. 122, pp. 44–51. [6] Gao PP, Zhang JW et al., The inferior colliculus is involved in deviant sound detection as revealed by BOLD fMRI. Neuroimage. 2014; 91:220-227. [7] Gao PP, Zhang JW et al., Auditory midbrain processing is differentially modulated by auditory and visual cortices: An auditory fMRI study. Neuroimage. 2015; 123:22-32. [8] M. M. Cheung, C. Lau, I. Y. Zhou, K. C. Chan, J. W. Zhang, S. J. Fan, and E. X. Wu, High fidelity tonotopic mapping using swept source functional magnetic resonance imaging, NeuroImage 2012, vol. 61, no. 4, pp. 978–986. [9] Yu, X., Sanes, D. H., Aristizabal, O., Wadghiri, Y. Z. and Turnbull, D. H. Large-scale reorganization of the tonotopic map in mouse auditory midbrain revealed by MRI, Proceedings of the National Academy of Sciences 2007, 104(29), pp. 12193–12198. [10] Adamczak, J. M., Farr, T. D., Seehafer, J. U., Kalthoff, D. and Hoehn, M. High field BOLD response to forepaw stimulation in the mouse. NeuroImage 2010. 51(2), pp. 704–712. [11] C. Chavarrias, V. García-Vázquez, Y. Alemán-Gómez, P. Montesinos, J. Pascau, and M. Desco, fMRat: an extension of SPM for a fully automatic analysis of rodent brain functional magnetic resonance series, Medical & Biological Engineering & Computing 2016, 54(5), pp. 743–752. [12] Romand, R. and Ehret, G. Development of tonotopy in the inferior colliculus. I. Electrophysiological mapping in house mice. Brain research. Developmental brain research. 1990. Netherlands, 54(2), pp. 221–234.Figures
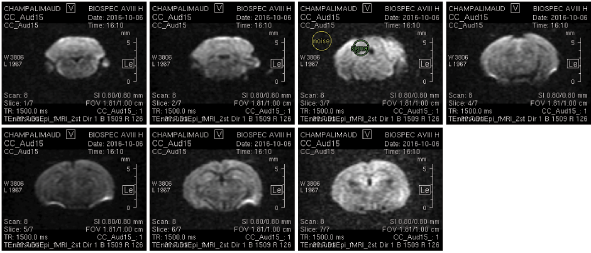
Figure 1. Example of the raw dfMRI axial slices to demonstrate their quality.
SNR as measured in the inferior colliculus was 22.5 in this case. Parameters
for the experiments were TR/TE = 1500/30.7 ms, 7 slices of thickness = 0.8 mm,
FOV = 18.1 x10 mm2, matrix size 98 x 54 and 1.5 partial FT leading
to an in-plane resolution of 185x185 (μm)2. In case of non-zero
b-value, b=1500 s/mm2 Δ/δ =18.83/1.40.
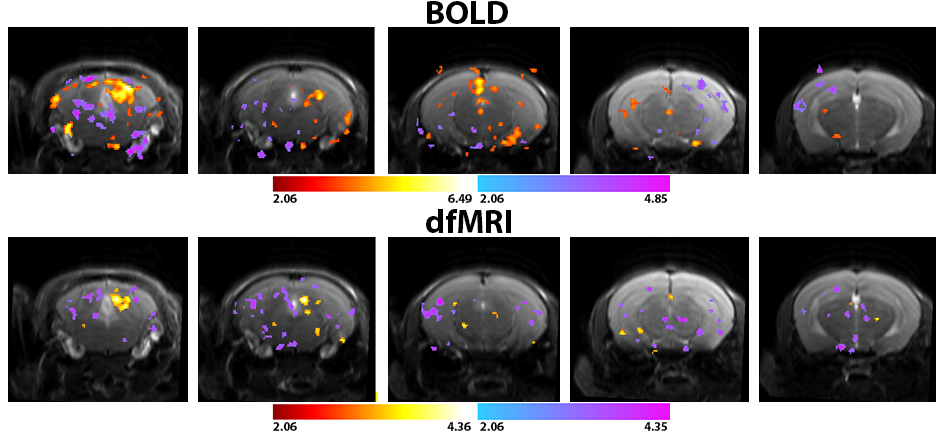
Figure 2. Statistical t maps thresholded at p=0.02 and cluster size of 4
voxels for both BOLD (n=12) and dfMRI (n=18) pooled datasets.Although the
significance in the BOLD map is higher, the shape of the inferior colliculus is
better delineated by the dfMRI study.
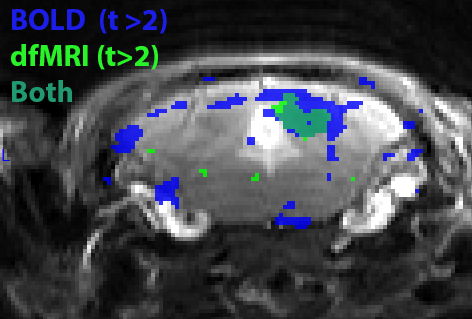
Figure 3. Overlay of the BOLD and dfMRI positive activation maps in the
inferior colliculus. dfMRI shows a more localized activation pattern than BOLD.
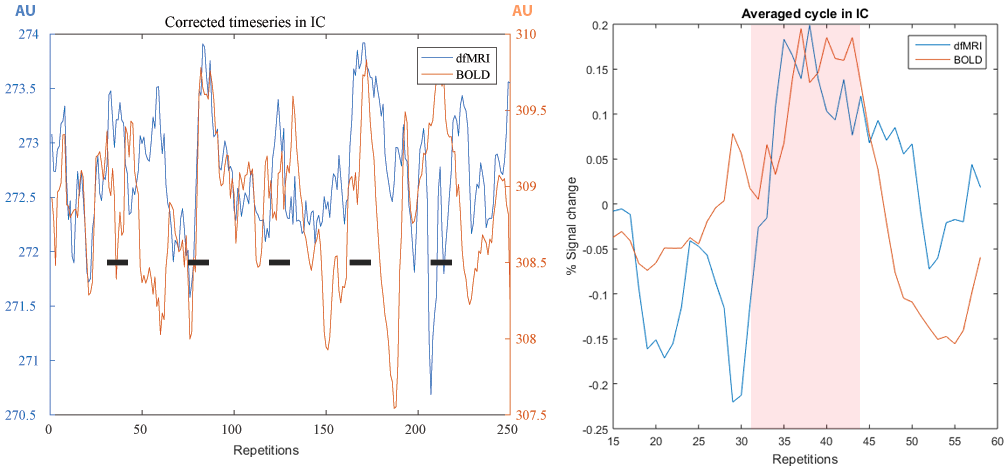
Figure 4. Left: Timecourses for BOLD and dfMRI before GLM fitting. Right:
averaged cycle from the blocked paradigm, stimulation period is shadowed in
red.