5265
The Role of Microvascular Blood Motion in BOLD fMRI1Department of Biomedical Engineering, Stony Brook University, Stony Brook, NY, United States, 2Syosset High School, Syosset, NY, United States, 3Department of Psychology, Stony Brook University, Stony Brook, NY, United States, 4Department of Radiology, Stony Brook University, Stony Brook, NY, United States, 5Department of Psychiatry, Stony Brook University, Stony Brook, NY, United States
Synopsis
While the existing BOLD signal model often use a single-compartmental, empirical relationship among fMRI response, blood flow and neural metabolic demand, some model parameters can only be determined from calibration challenges. In this study, for the first time, the role of intravascular blood motion on BOLD response is evaluated by Monte-Carlo simulation. Combined with an analytical description of extravascular contribution, a unified BOLD signal model without the need for calibration can be established, enabling the quantification of neurovascular coupling efficiency in both goal directed and spontaneous neuronal activations.
Purpose
Methods
The mean straight capillary segment length in brain is 10-20µm (blood velocity of 0.5 to 1.0 µm/ms) [5]. Post-capillary venules have mean straight segments length between 50 to 200µm depending on the branching order (mean velocity between 2 to 10 µm/ms) [6]. Hence, during TE of 30-40ms, blood spin may traverse multiple vessel segments with different resonance frequency, leading to reduced phase dispersion thus reduced signal attenuation. A simulated brain microvasculature model was created. The mean length of straight vessel segments was chosen as 40±20 µm (length for first-generation post-capillary branching). Meanwhile, the blood velocity (v) was varied from 1.0µm/ms to 20.0µm/ms, and the blood oxygenation level (Y) was varied between 20% and 90%. For each variation of velocity and blood oxygenation, 1000 microvascular models, each with 200 vessel segments, were generated for statistical significance. Note that the normalized intravascular blood signal only depends on the ratio between vessel segment length and the velocity of blood spin.
Three healthy subjects were recruited for this IRB approved study conducted on Siemens 3T Prisma scanner. Simultaneous ASL and BOLD signal were acquired using double-echo pCASL-BOLD sequence. MR parameters were: labeling time of 1.6 s; post-labeling delay of 1.2 s; voxel size of 3.5 ×3.5×6.0mm3; TR of 4000 ms; TE1 of 11 ms (ASL) and TE2 of 30 ms (BOLD).
Results & Discussions
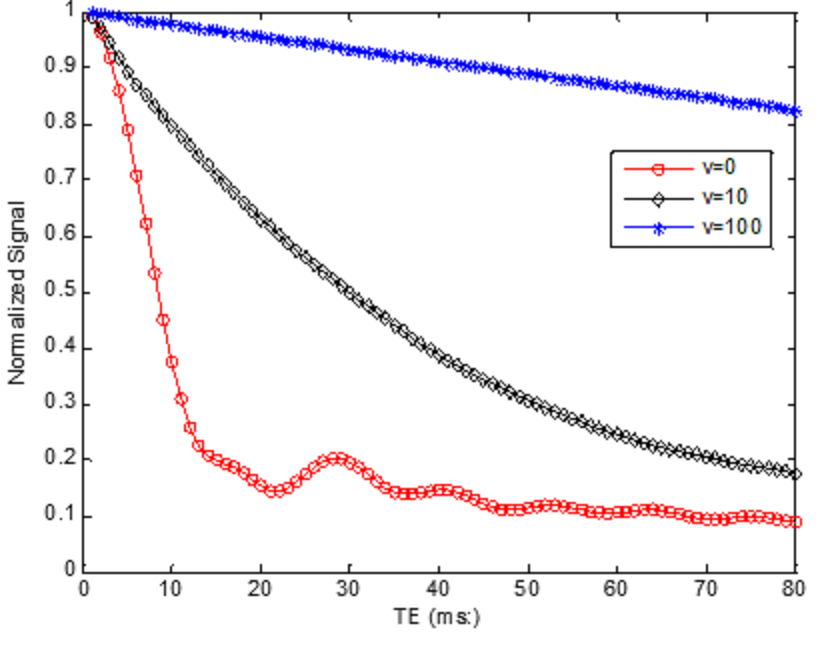
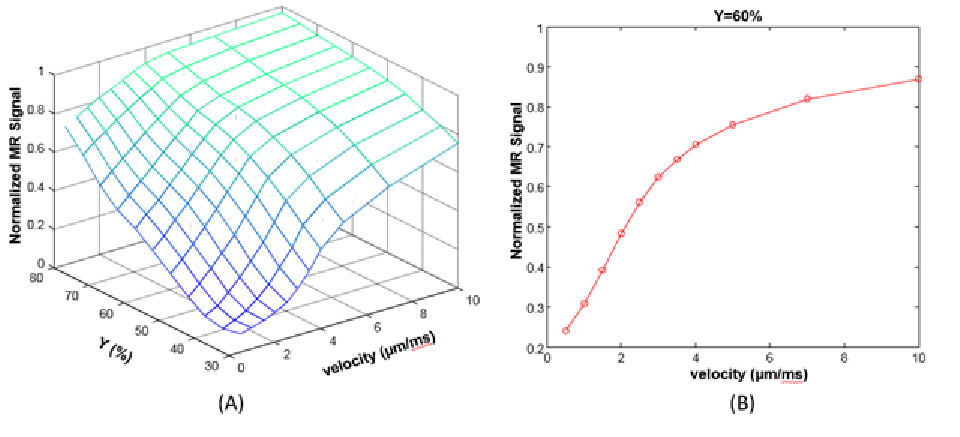
Fig. 1 shows the normalized intravascular signal at different TE and velocity (Y=60%). The standard “powder” effect (v=0) is significantly attenuated than for v=10 µm/ms. At v=100 µm/ms, signal attenuation becomes negligible since the accumulated spin phase approaches to a non-zero constant and therefore only depends on blood oxygenation. Additional simulations were conducted at TE=30ms (Fig. 2), demonstrating the effect of blood velocity on BOLD contrast. For a typical visual stimulation fMRI study at 3T, a 40% increase of CBF [7], using Grubb’s formula, results in ~25% increase of blood velocity (from 1.0 to 1. 25µm/ms). Assuming a 5% increase of CMRO2 (Y change from 60% to 70%) [7], the normalized intravascular signal will increase from 0.39 to 0.63. Assuming vCBV of 1.7% [8], then the intravascular contribution is:
$$\frac{\Delta S_b}{S_0}=\tt v \it CBV\cdot\left[0.63e^{ -\frac{TE}{R2_b,act}}-0.39e^{- \frac{TE}{T2_b,0}}\right]\times e^{\frac{TE}{R2_GM}}=1.7\% \times\left[0.63e^{- \frac{30}{48}}-0.39e^{ - \frac{30}{31} }\right]\times e^{\frac{30}{60}} \approx 0.53\%$$ , representing ~35% of the total estimated BOLD fMRI changes of 1.5%, consistent with experimental observations [9]. In contrast, if the velocity-induced effect is ignored (v=0), the resultant intravascular BOLD contribution will be only ~0.2%.
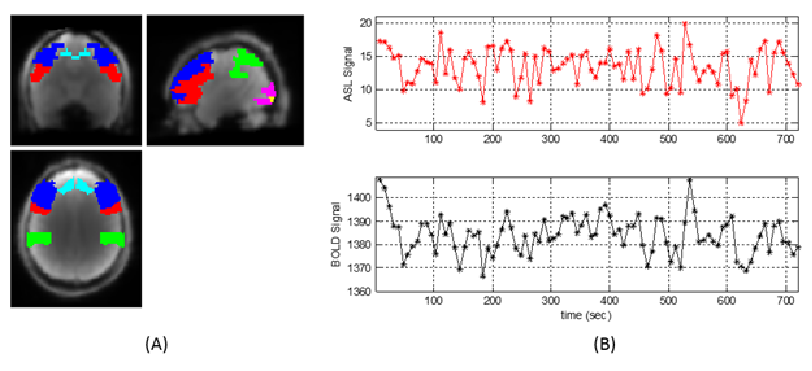
Fig. 3 shows a typical simultaneously acquired ASL and BOLD temporal profile in a resting-state fMRI study. The relative brain perfusion fluctuation is ~14%, while the mean BOLD fluctuation is ~0.48%. Three hypotheses for rs-fcMRI were assessed: (a) no blood oxygenation change; (b) constant metabolism; (c) same metabolism change as in goal-directed activation. Hypotheses (a) and (b) create ~0.03% and ~0.81% BOLD fluctuation respectively, inconsistent with experimental observation. For hypothesis (c), a 5% increase on CMRO2 during spontaneous neural activation (Y changes from 60% to 63.5%) will create 0.17% BOLD changes from intravascular origin, and 0.30% from extravascular origin, consistent with the observed 0.48% BOLD fluctuation.
Hence, this study indicates that the spontaneous neural activation in the resting-state requires a similar level of metabolism demand but is accompanied with a significantly lower perfusion increase. This reflects the reduced level of neurovascular coupling efficiency in spontaneous neural activities than in goal-directed neural activation, consistent with the reduced degree of synnchronization of neuronal firing due to the lack of focal attention [10].
Conclusion
In this study, for the first time, the effect of blood velocity was investigated in fMRI and rs-fcMRI studies. Combined with analytical description of extravascular MR signal, a unified analytical BOLD signal model, without the need for calibration, can be derived. This enables the non-invasive quantification of neural vascular coupling efficiency.Acknowledgements
No acknowledgement found.References
1. Buxton, R.B., Dynamic models of BOLD contrast. Neuroimage, 2012. 62(2): p. 953-61.
2. Chen, J.J. and G.B. Pike, Global cerebral oxidative metabolism during hypercapnia and hypocapnia in humans: implications for BOLD fMRI. J Cereb Blood Flow Metab, 2010. 30(6): p. 1094-9.
3. Yablonskiy, D.A. and E.M. Haacke, Theory of NMR signal behavior in magnetically inhomogeneous tissues: the static dephasing regime. Magn Reson Med, 1994. 32(6): p. 749-63.
4. Sukstanskii, A.L. and D.A. Yablonskiy, Theory of FID NMR signal dephasing induced by mesoscopic magnetic field inhomogeneities in biological systems. J Magn Reson, 2001. 151(1): p. 107-17.
5. Tata, D.A. and B.J. Anderson, A new method for the investigation of capillary structure. Journal of neuroscience methods, 2002. 113(2): p. 199-206.
6. Lorthois, S., F. Lauwers, and F. Cassot, Tortuosity and other vessel attributes for arterioles and venules of the human cerebral cortex. Microvasc Res, 2014. 91: p. 99-109.
7. Duong, T.Q., Cerebral blood flow and BOLD fMRI responses to hypoxia in awake and anesthetized rats. Brain Res, 2007. 1135(1): p. 186-94.
8. He, X. and D.A. Yablonskiy, Quantitative BOLD: mapping of human cerebral deoxygenated blood volume and oxygen extraction fraction: default state. Magn Reson Med, 2007. 57(1): p. 115-26.
9. Lu, H. and P.C. van Zijl, Experimental measurement of extravascular parenchymal BOLD effects and tissue oxygen extraction fractions using multi-echo VASO fMRI at 1.5 and 3.0 T. Magn Reson Med, 2005. 53(4): p. 808-16.
10. Steinmetz, P.N., et al., Attention modulates synchronized neuronal firing in primate somatosensory cortex. Nature, 2000. 404(6774): p. 187-90.
Figures