5263
Targeted fMRI using radial acquisition and polar reconstruction1Biomedical Engineering, Amirkabir University of Technology (Tehran Polytechnic), Tehran, Iran, 2School of Cognitive Sciences, Institute for Research in Fundamental Sciences (IPM), Tehran, Iran
Synopsis
Recently there has been growing interests in radial fMRI. However, the reconstruction algorithm is also an important issue in K-space radial sampling. In this work, we have investigated the effect of a novel reconstruction method based on polar Fourier transform, for radially acquired fMRI data in polar coordinates. Based on its special features such as central focusing behavior, the obtained results demonstrate the capability of this method in reliable activity detection in targeted regions and also show a higher temporal stability in those areas.
Introduction
Radial sampling of K-space is a well-known approach in MRI data acquisition which results in more robustness to motion artifacts. Recently it has been shown that radial acquisition in fMRI can also be efficient1. The conventional method for reconstruction of image from radial samples of K-space is gridding, in which data is interpolated to Cartesian grid for 2D FFT. However, these methods degrade the advantages of denser sampling in the center of K-space, assuming a uniform grid for all the K-space samples. Recently, an innovative reconstruction approach based on radial acquisition has been proposed in which data analysis is performed in polar coordinate using Polar Fourier Transform (PFT) followed by a simple gridding step for visualization in Cartesian coordinate2. The efficiency of this method has been previously examined in reconstruction of radially tagged cardiac images. The PFT method is based on Hankel transform that special behavior of its Bessel functions leads to a central focusing behavior2. We hypothesize this behavior can help in several fMRI studies, where a focal area for activity exists. Choosing the center of the image in such a focal area would result in a targeted study with higher temporal SNR (t-SNR) and better achievable resolution for that area. Our main goal in this study is to investigate this hypothesisMethod
The experiment was performed on a 3 Tesla Prisma Siemens scanner. Balanced Steady State Free Precession (b-SSFP) sequence has been utilized to acquire functional images which benefits from a better specificity and lower susceptibility induced artifacts. Data were acquired during a right handed finger tapping task with a block design of 5 cycles (15s rest/ 15s act). Five oblique slices and a total of 50 volumes were collected in 2.5 minutes. K-space was radially sampled with 102 spokes and 224 sample points along each spoke. Other imaging parameters are as follows: TE/TR = 2.92/3000 s, FOV = 112*112 cm, voxel size = 1.96*1.96*3.75 mm3. In addition to DICOM images, raw data were exported from the scanner and reconstructed using PFT algorithm. The resultant images in polar coordinate were analyzed with FSL. Preprocessing steps included removing tree first volume, brain extraction, high-pass temporal filtering (bandwidth of 30Hz) and motion correction (using MCFLIRT). The volume images were then processed for activation detection using cluster threshold of 2.3 and then transferred to Cartesian coordinate. DICOM images, reconstructed by scanner through gridding, were similarly analyzed using FSL. For both reconstruction techniques, t-SNR was calculated as the average signal intensity of the time series divided by the standard deviation across that times series for each voxel. The maps of t-SNR was then normalized by a factor of voxel volumes in both images to eliminate the effect of sample density variations of polar coordinate.Results
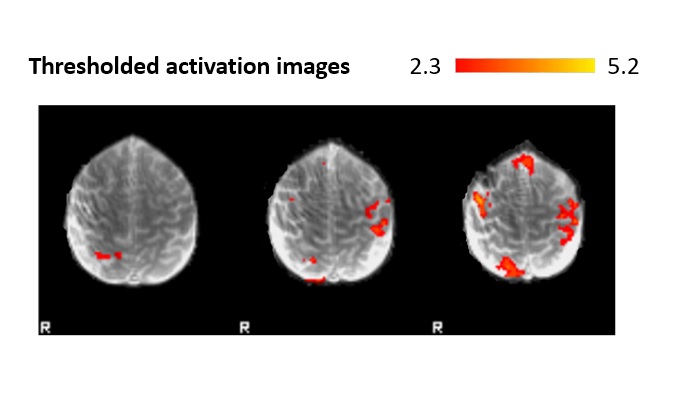
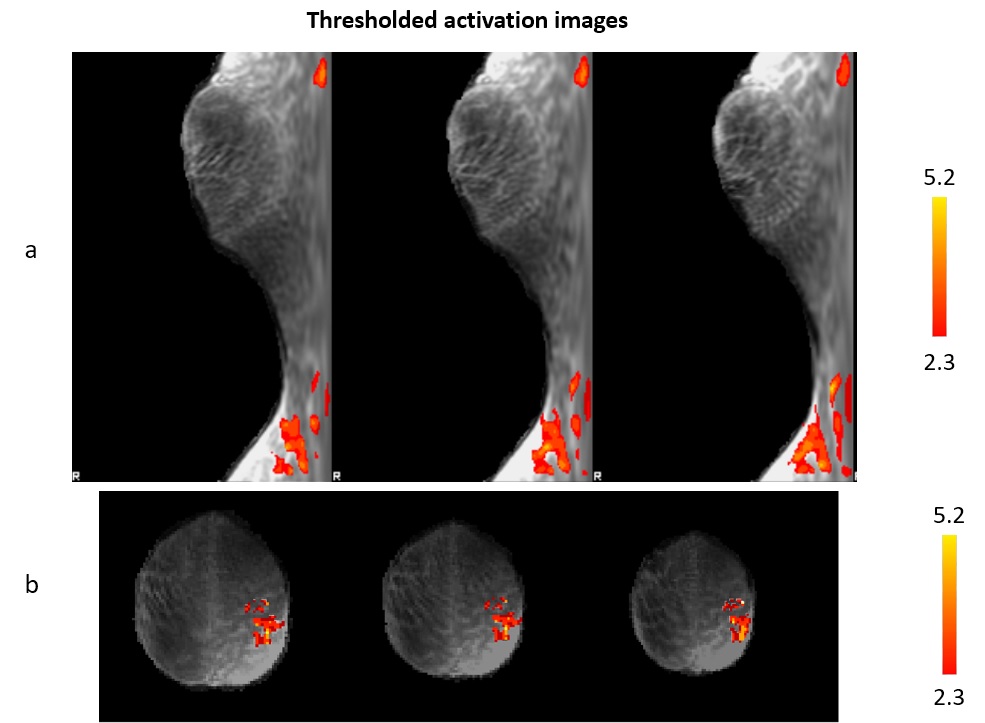
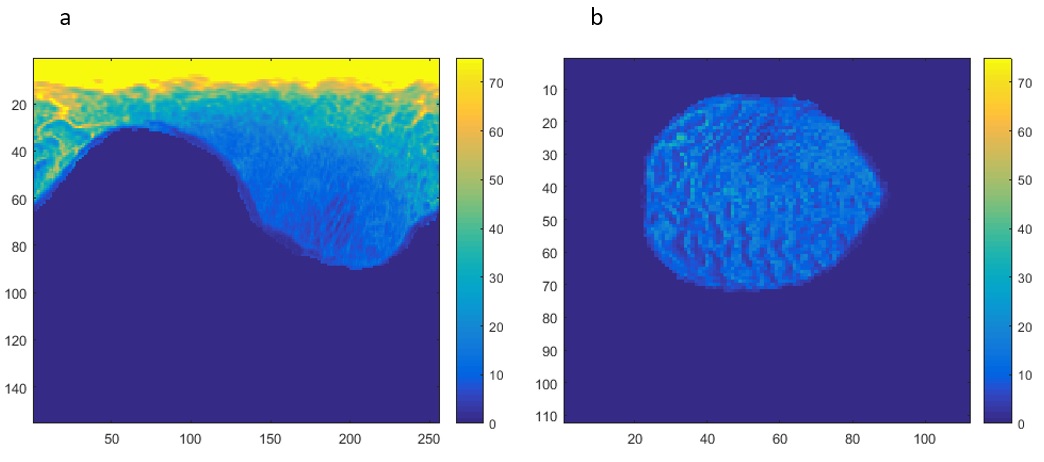
Fig.1; illustrates activity map of DICOM images reconstructed by scanner. Analyzed images in polar coordinate along with their visualization in Cartesian coordinate are shown in Fig.2. Three slices with both reconstruction techniques and similar z-scores are shown for comparison. Calculated normalized temporal SNR maps for first slices of both techniques are illustrated in Fig.3. (Color bar units are 1 per mm2). The mean value for nonzero voxels of DICOM images and polar reconstructed ones are 11.32 and 57.47, respectively. For the polar reconstruction the points located closer to the center of the image clearly have higher normalized t-SNR which suggests more reliable results for this area when we have fewer number of time points.Discussion
The results shown in Fig.1 and Fig.2, demonstrated that more locally focused pattern of activation can be detected by analyzing functional image in polar coordinate. Furthermore, regarding color bar of thresholded images, higher activity level can be found in Fig.2. According to Fig.3, temporal SNR map of polar analyzed data benefits from higher average value rather than scanner reconstructed data. As it can be seen, temporal SNR in small radii is higher which indicates the higher temporal stability in center of the activity. This important achievement provides the possibility of using fewer time points.Conclusion
In this work, we have presented the feasibility of polar analyzing of radial fMRI acquisition. Usage of the PFT reconstruction method for radially acquired fMRI, enables us to obtain higher t-SNR in adjusted center of image. The proposed method according to calculated t-SNR maps provides the possibility of activation detection in down sampled radial K-space that leads to faster data acquisition.Acknowledgements
This study is supported by Cognitive Sciences and Technologies Council, Tehran, Iran (No. 2603).References
[1] M. Chiew, N. N. Graedel, J. A. McNab, S. M. Smith, and K. L. Miller, “Accelerating functional MRI using fixed-rank approximations and radial-cartesian sampling,” Magn. Reson. Med., 2016.
[2]
shekoofeh Golshani and A. N. Moghaddam, “Efficient Radial Tagging CMR Exam: A
Coherent k-Space Reading and Image Reconstruction Approach,” 2016.
Figures