5261
Functional brain imaging with high spectral and spatial resolution MRI at 3T1Radiology, University of Chicago, Chicago, IL, United States
Synopsis
Functional data were acquired of a finger tapping experiment using a conventional EPI approach as well as using high spectral and spatial resolution water spectra acquired using EPSI at 3T. Activation maps of both acquisition strategies were produced and compared. Expected task dependent areas of activation were seen in both, however, activation volumes were smaller in EPSI data. This could indicate that different Fourier components of the water spectrum are differentially affected by the BOLD effect. If this is the case, detailed analyses of the water spectrum could contribute to our understanding of the relationship between cognitive processes and the hemodynamic response.
Introduction
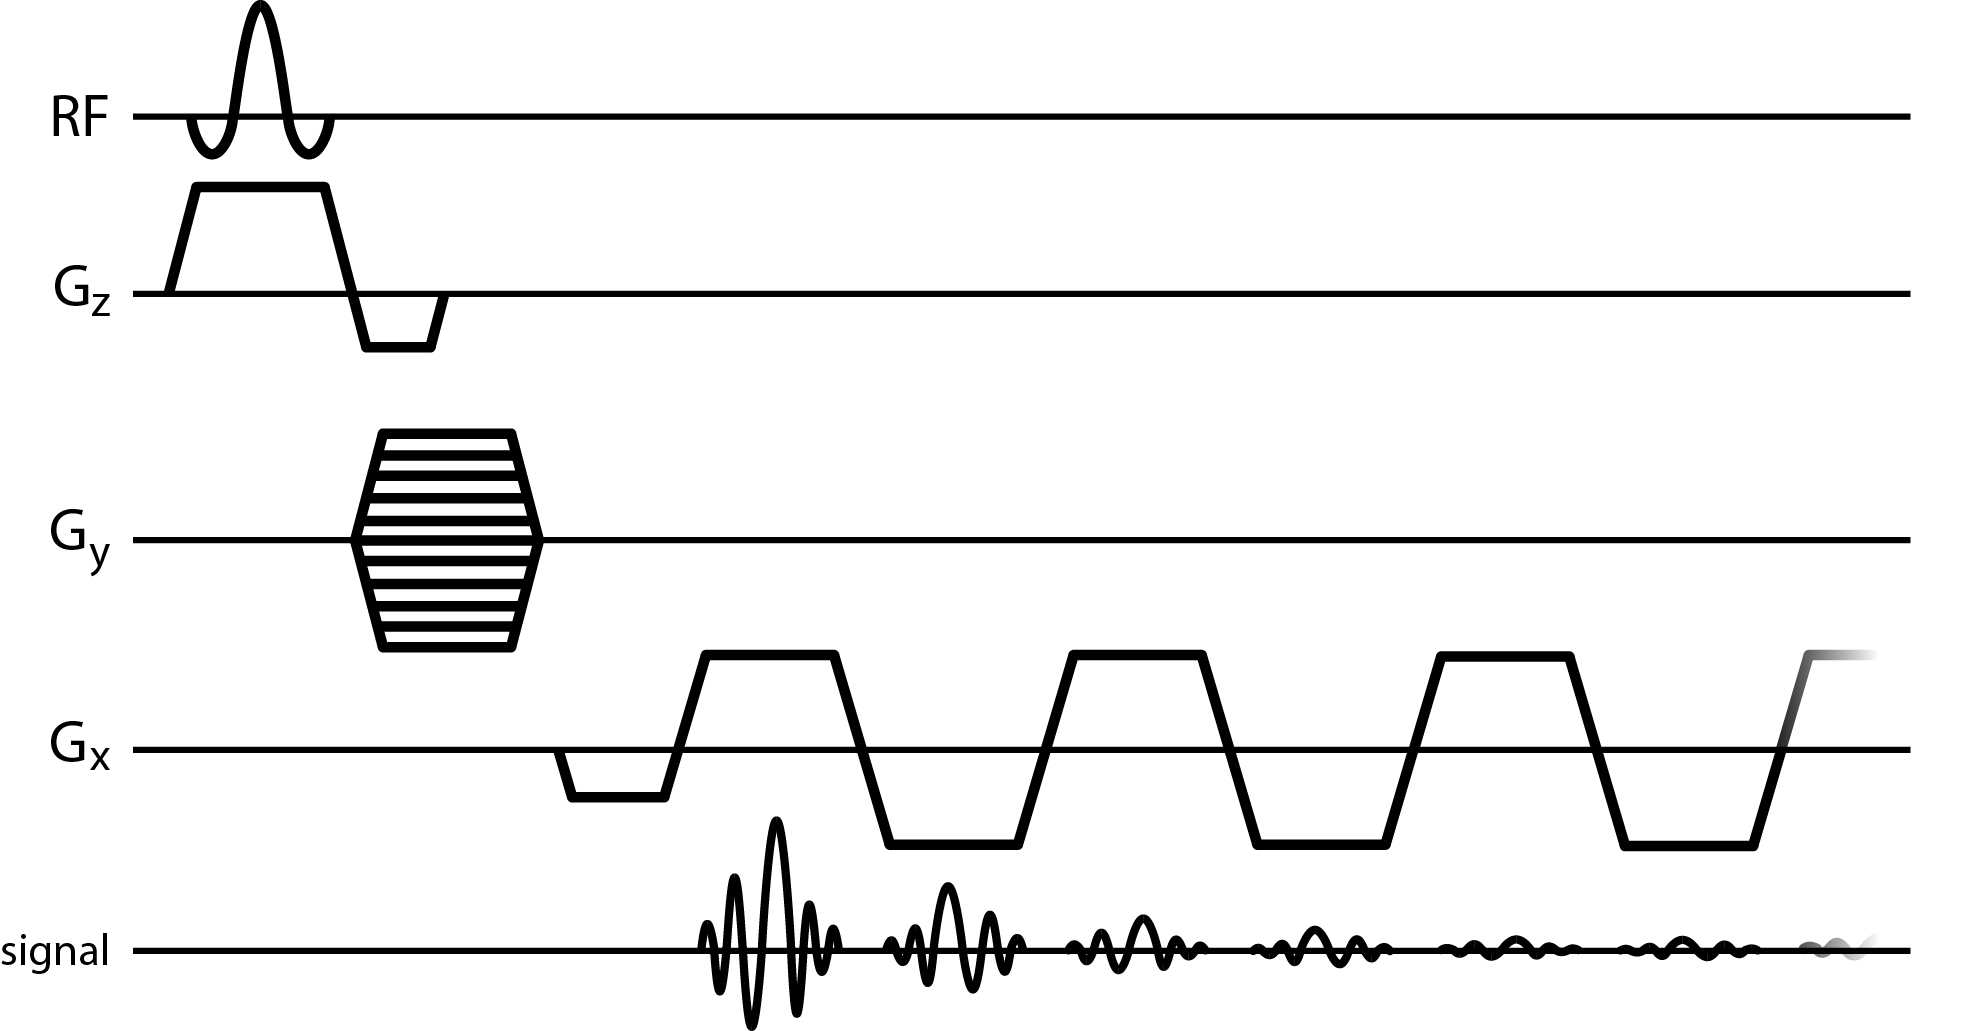
Brain activation due to the BOLD response is conventionally detected with T2*-weighted MRI (1). However, this approach is generally not adequate to capture the details of the complex microenvironment that gives rise to BOLD contrast. In this work we report functional activity in the brain produced from the voxel-wise change in peak height of the water spectrum acquired using a multi-gradient echo sequence (also interchangeably referred to as echo-planar spectroscopic imaging or EPSI (2)) (Fig.1), which has previously been shown to be sensitive to the BOLD effect (3,4). These results are compared with brain activation results produced from conventional fMRI.Methods
Data were acquired using a 3T Philips Ingenia scanner (Best,
Netherlands) with a 32 element receive coil. Brain activation was induced using
a simple right-handed finger-tapping block design. Functional data were acquired over two repetitions: once with higher temporal resolution, lower spatial resolution
using EPI (2 seconds per whole brain volume,
3.4 x 3.4 x 4mm resolution) and a second time with slower temporal, higher
spatial resolution EPSI (90 seconds per 5 slice slab, 1.5 x 1.5 x 4mm
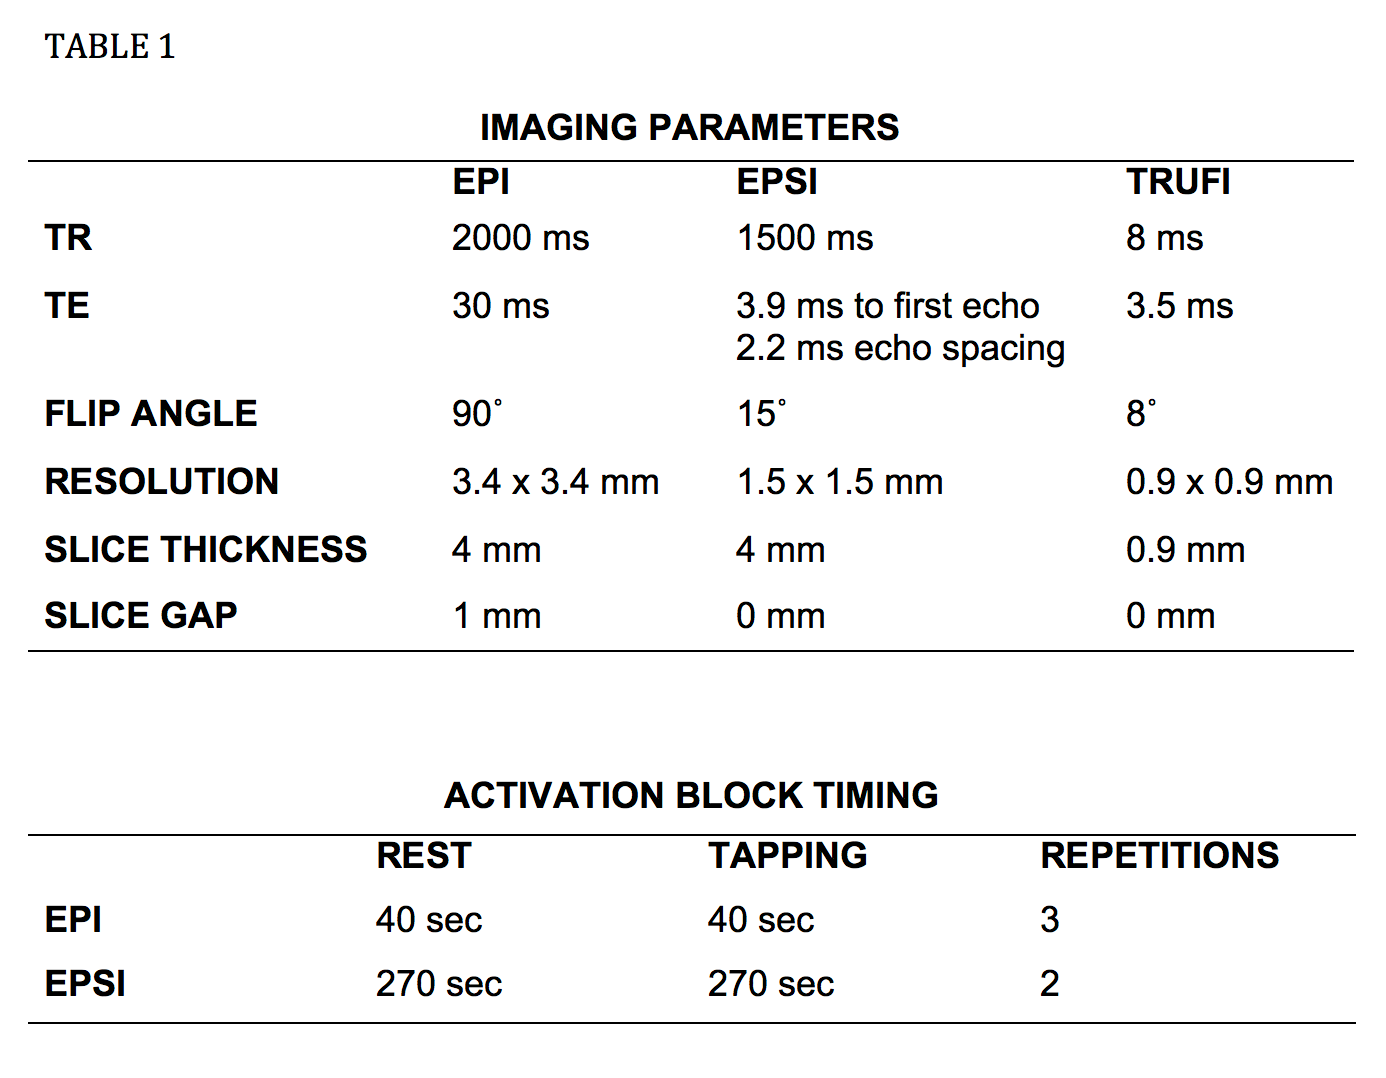
resolution). Acquisition parameters and fMRI block timings for both protocols
are described in Table 1 (see Fig. 2). EPSI data were Fourier transformed along the temporal
dimension to produce water spectra for each voxel with 5.3Hz spectral
resolution. Images of the peak amplitude of the water resonance in each voxel
were calculated (referred to as peak height, PH, images). Functional activation
was identified for both EPI and PH time-series datasets using FEAT (5,6).
Both EPI and PH data results were cluster thresholded (z > 2.3 and
p<0.01) to produce activation maps. Activation maps were registered to
structural data using FLIRT. Subsequent image processing was done with Matlab and ImageJ. Structural data were acquired using MPRAGE (see Table 1 in Fig 2)
Results
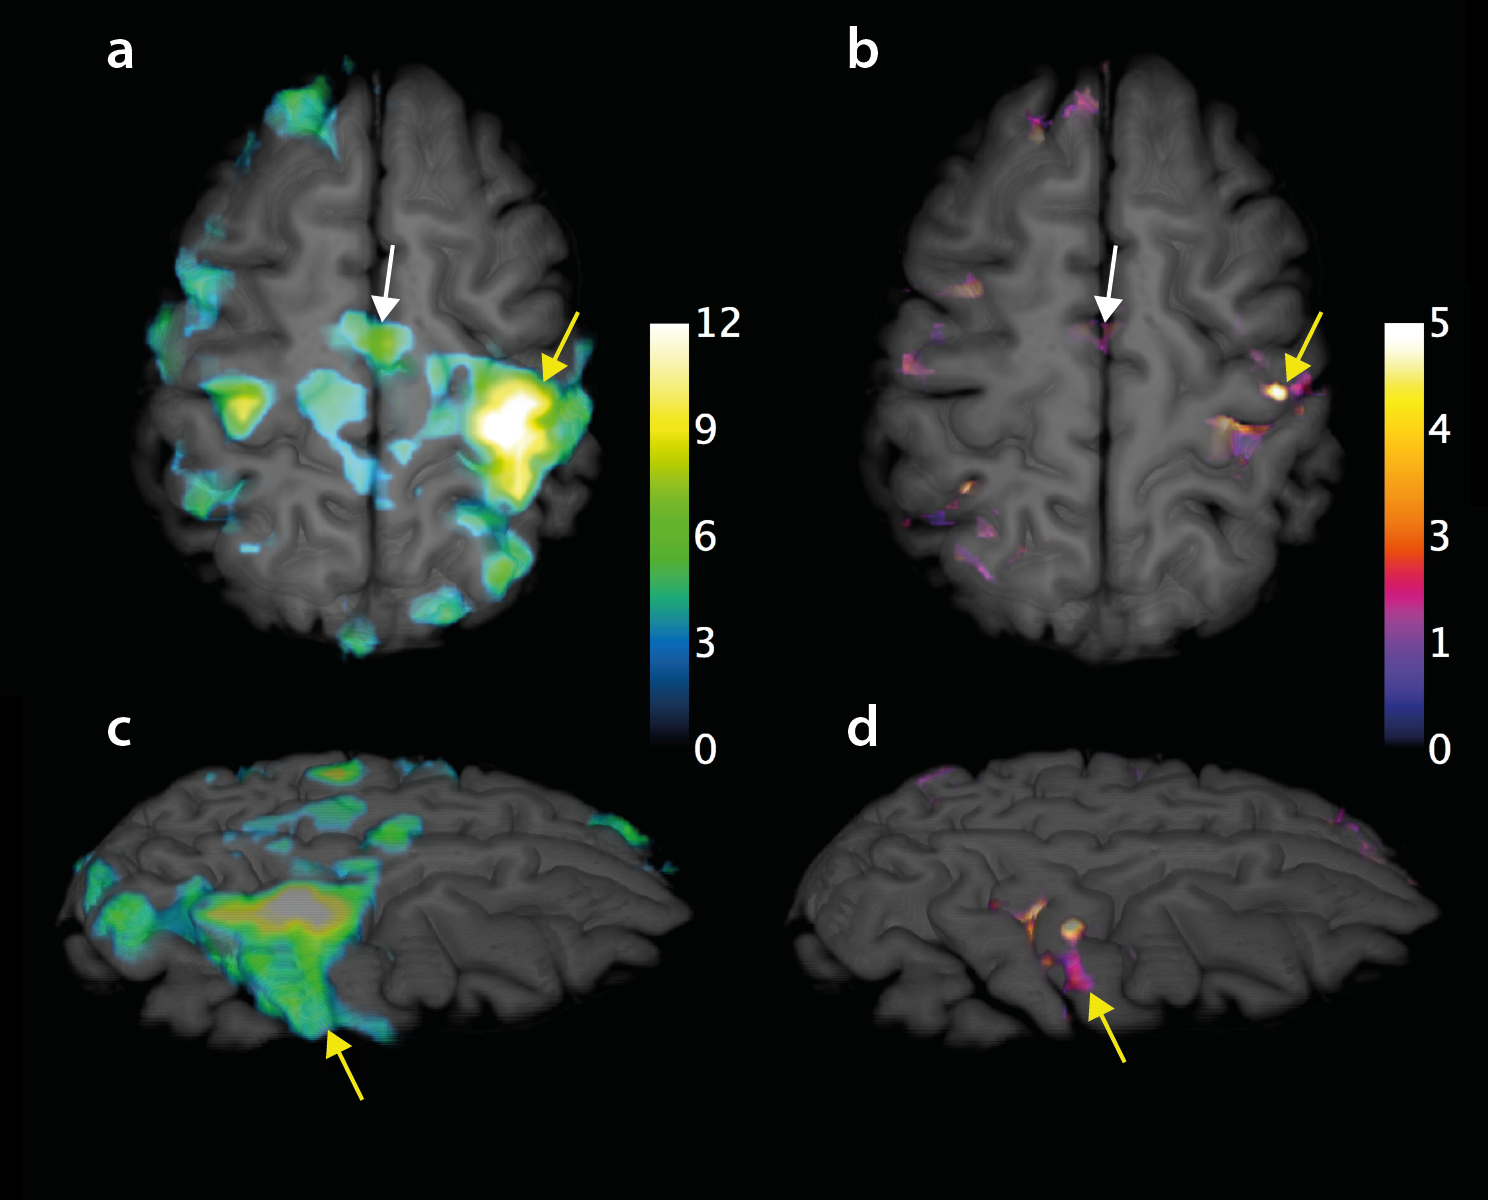
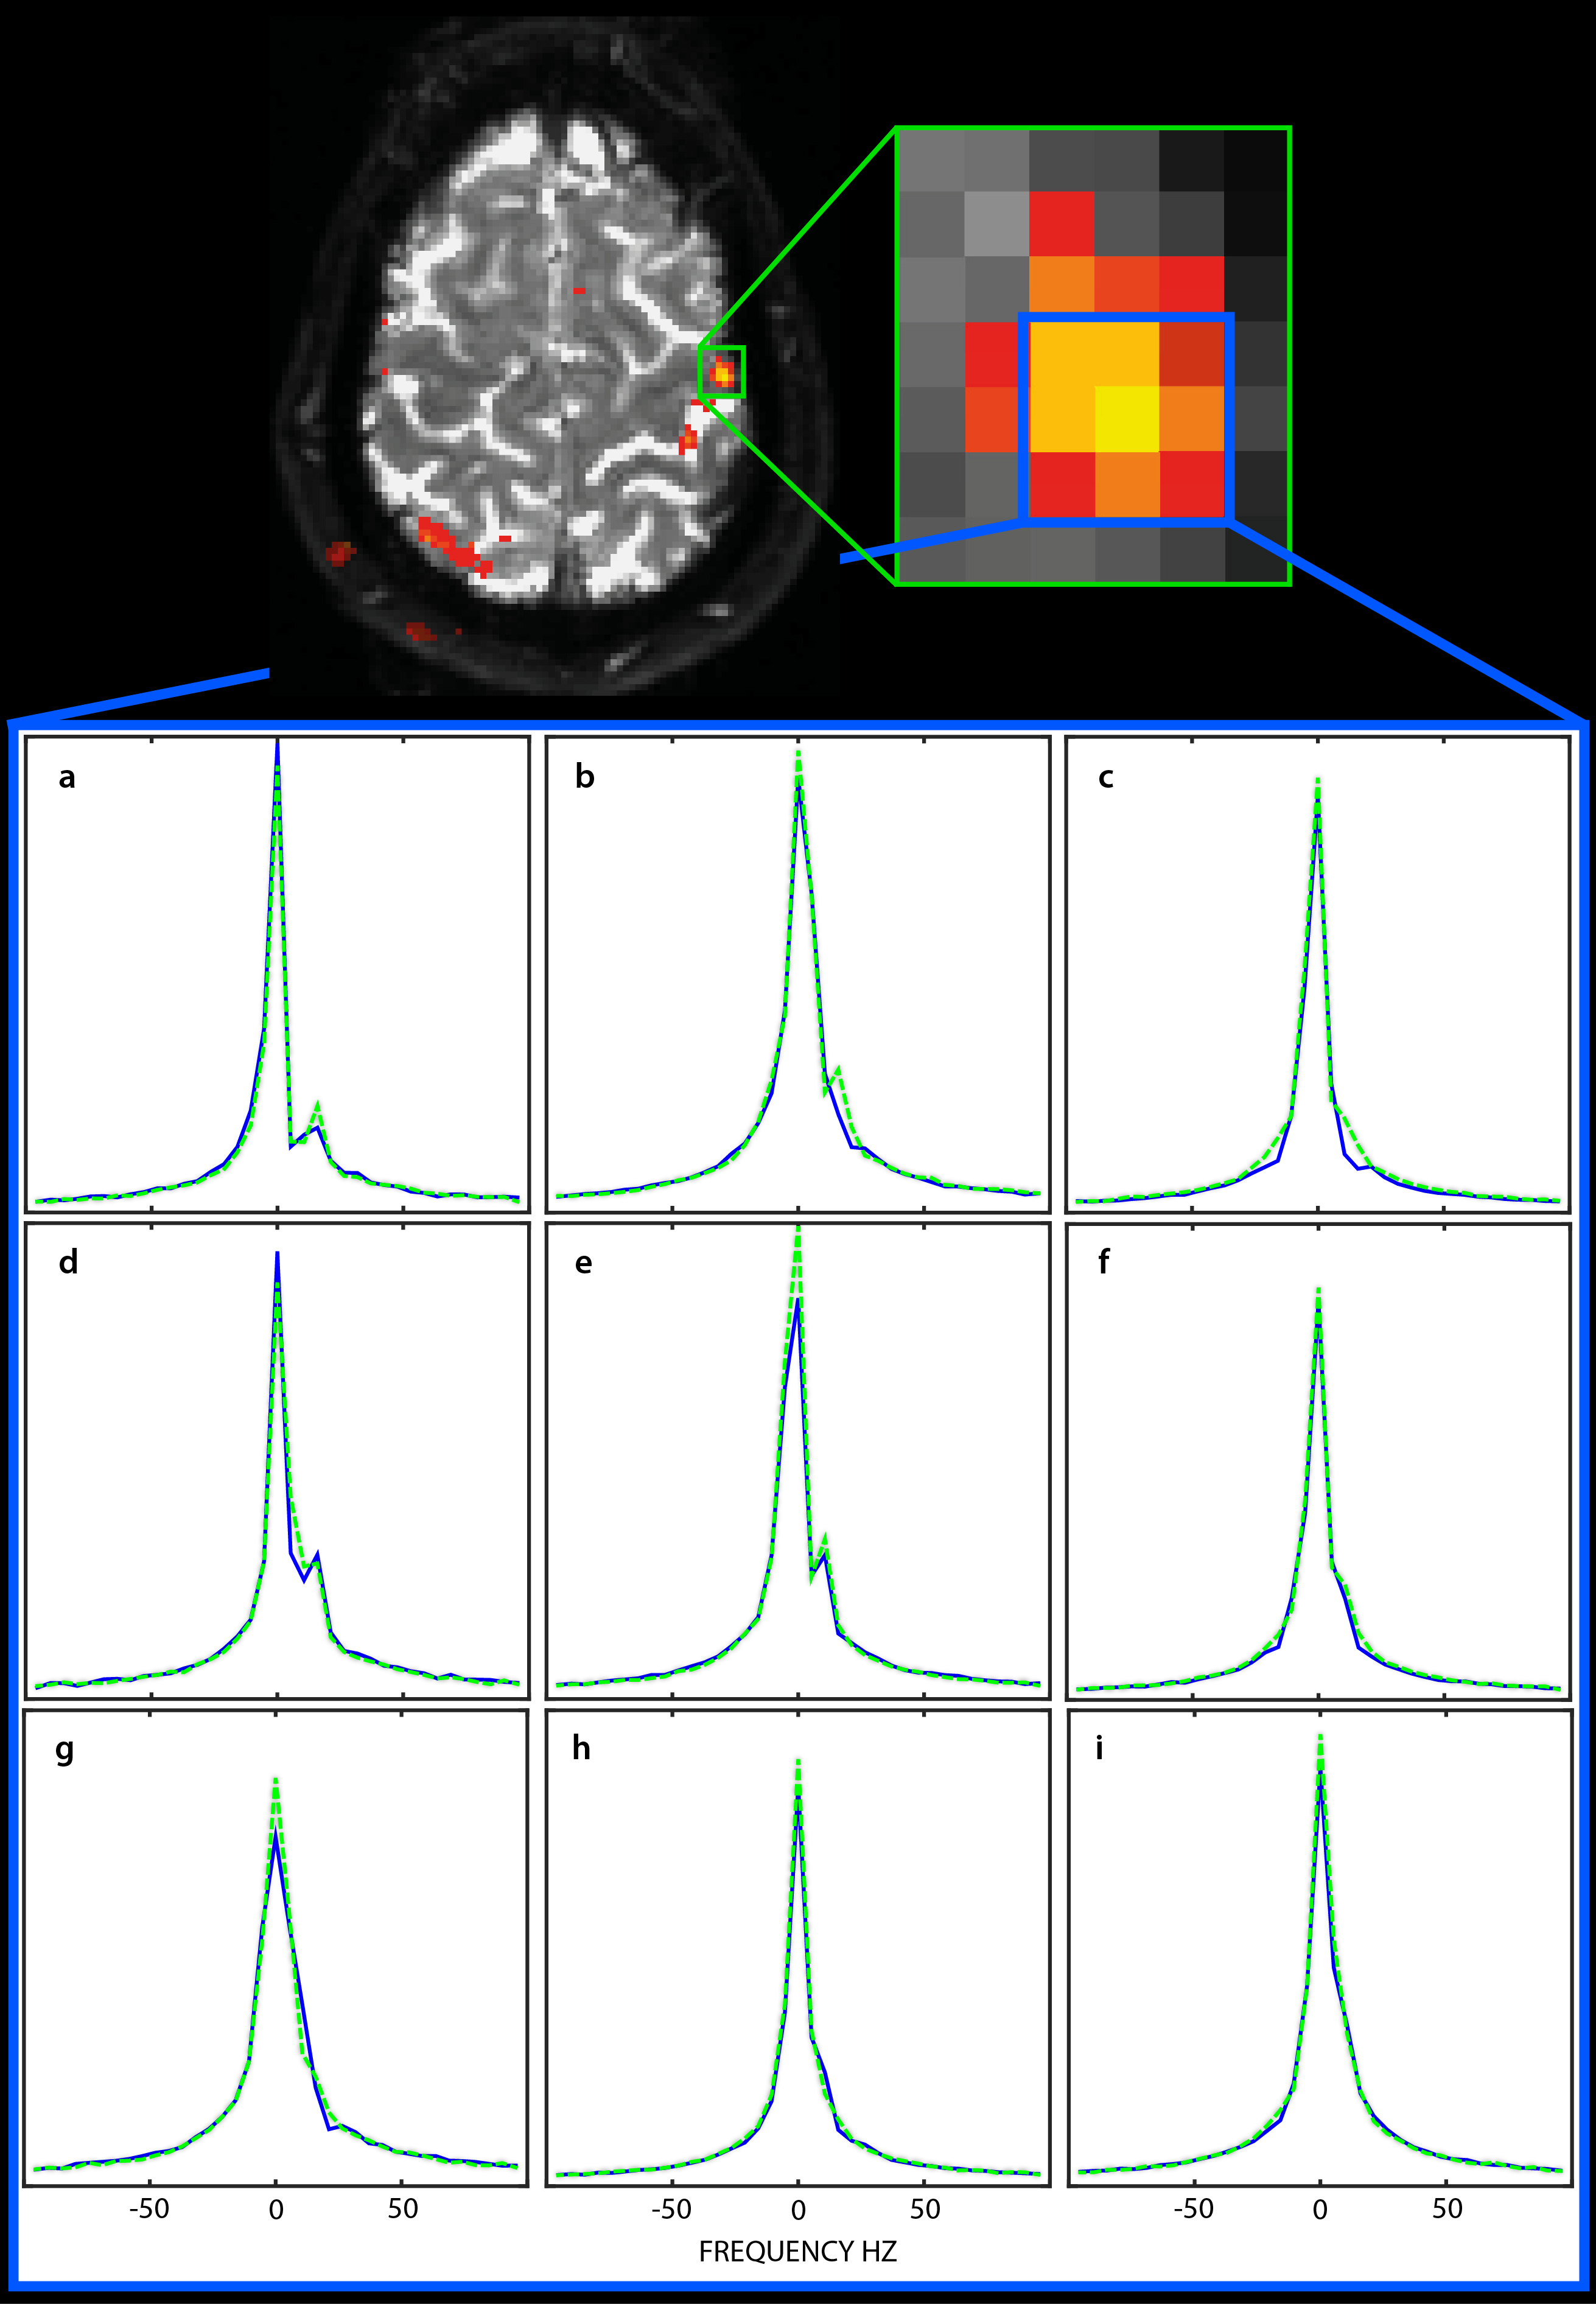
Figure 3 shows activation from both EPI (a, c) and EPSI (b, d) experiments overlain on a structural 3D slab. In general, EPI data show much larger regions of activation across the brain than those produced from the PH images. However, regions that would be expected to demonstrate activity (e.g. contralateral activation of the (left) primary motor cortex and bilateral activation of the supplementary motor area) are seen in both. The average change in water resonance peak height in activated regions was 2 ± 1%. Figure 4 shows a region of activity in the left primary motor cortex as well as the corresponding water spectra for a single rest (blue) and active (green) time point. While activation was identified using the peak of the spectrum as the source of signal contrast, it is clear that the shape of the water spectrum is also changing with the hemodynamic response. A secondary peak in the spectrum at ~15-20 Hz above the main water peak is present in many voxels and changes during activation.Discussion
Results demonstrate that data acquired with EPSI produce regions of activation that are similar to those produced from a more conventional EPI based approach. Changes in the water line from voxel to voxel and from resting to active states within a voxel suggest that changes in blood oxygenation produce complicated changes in the water signal. These changes can be detected with T2*-weighted EPI, but cannot be fully appreciated without considering the range of frequencies (i.e. the Fourier components) that comprise the water resonance. This can only be visualized by producing water spectra with high spectral and spatial resolution. Habituation to the finger-tapping task over the long activation period during the EPSI acquisition may account, at least in part, for the decreased size of active regions compared with EPI results. However, the results also demonstrate that the changing water peak height is only one of many changes in the water spectrum. Thus, the complex changes in the Fourier components of the water spectrum may provide valuable information that is not available from conventional fMRI. Analysis of the entire water spectrum could contribute to our understanding of the relationship between cognitive processes and the hemodynamic response.Conclusion
In this work we demonstrate functional activation produced in a traditional finger-tapping experiment using the peak of the water resonance detected with EPSI. EPSI results were consistent with those obtained with conventional EPI. While EPSI is a slower technique, decomposition of the water resonance into its various Fourier components provides a very rich source of information that cannot be accessed by conventional fMRI methods that detect a single point along the water proton free induction decay.Acknowledgements
No acknowledgement found.References
1. Ogawa S, Lee TM, Kay AR, Tank DW. Brain Magnetic-Resonance-Imaging with Contrast Dependent on Blood Oxygenation. P Natl Acad Sci USA 1990;87(24):9868-9872.
2. Doyle M, Mansfield P. Chemical-Shift Imaging - a Hybrid Approach. Magnet Reson Med 1987;5(3):255-261.
3. Al-Hallaq HA, Fan XB, Zamora M, River JN, Moulder JE, Karczmar GS. Spectrally inhomogeneous BOLD contrast changes detected in rodent tumors with high spectral and spatial resolution MRI. Nmr Biomed 2002;15(1):28-36.
4. Du WL, Karczmar GS, Uftring SJ, Du YPP. Anatomical and functional brain imaging using high-resolution echo-planar spectroscopic imaging at 1.5 Tesla. Nmr Biomed 2005;18(4):235-241.
5. Jenkinson M, Bannister P, Brady M, Smith S. Improved optimization for the robust and accurate linear registration and motion correction of brain images. Neuroimage 2002;17(2):825-841.
6 .Worsley KJ. Statistical analysis of activation images. In: Jezzard P, Matthews PM, Smith SM, editors. Functional MRI: An Introduction to Methods: UOP; 2001.
Figures