5260
Simultaneous assessment of total CBV, aCBV and BOLD measures at 7 Tesla in motor and somatosensory cortices1Sir Peter Mansfield Imaging Centre, University of Nottingham, Nottingham, United Kingdom, 2Max Planck Institute for Human Cognitive and Brain Sciences, Leipzig, Germany, 3University of Amsterdam, Amsterdam, Netherlands
Synopsis
We combined Arterial Spin Labelling (ASL) and Vascular Space Occupancy (VASO) techniques into a double acquisition FAIR sequence with double echo readout to provide simultaneous measures of arterial Cerebral Blood Volume (aCBV), total CBV and BOLD signals. Using this technique at 7T, we successfully detected aCBV and total CBV (and BOLD) changes induced by both a motor task and a vibrotactile sensory stimulation paradigm, and show that activation maps derived with the independent ASL and VASO techniques largely overlap.
PURPOSE
Cerebral Blood Volume (CBV) measurements are an alternative fMRI approach to BOLD and have been shown to provide improved specificity. Vascular Space Occupancy (VASO) acquires images at the blood nulling point to provide functionally induced changes in both venous and arterial CBV, and has been demonstrated at 7T (1-4). Arterial Spin Labelling (ASL) traditionally provides a measure of CBF, but also yields arterial CBV (aCBV) at shorter post-label delay times. Both ASL and VASO rely on the inversion of blood water magnetization. The aim of this study was to combine these methods in a single sequence at 7 Tesla for direct comparison of CBV and aCBV maps, in addition to BOLD images.METHODS
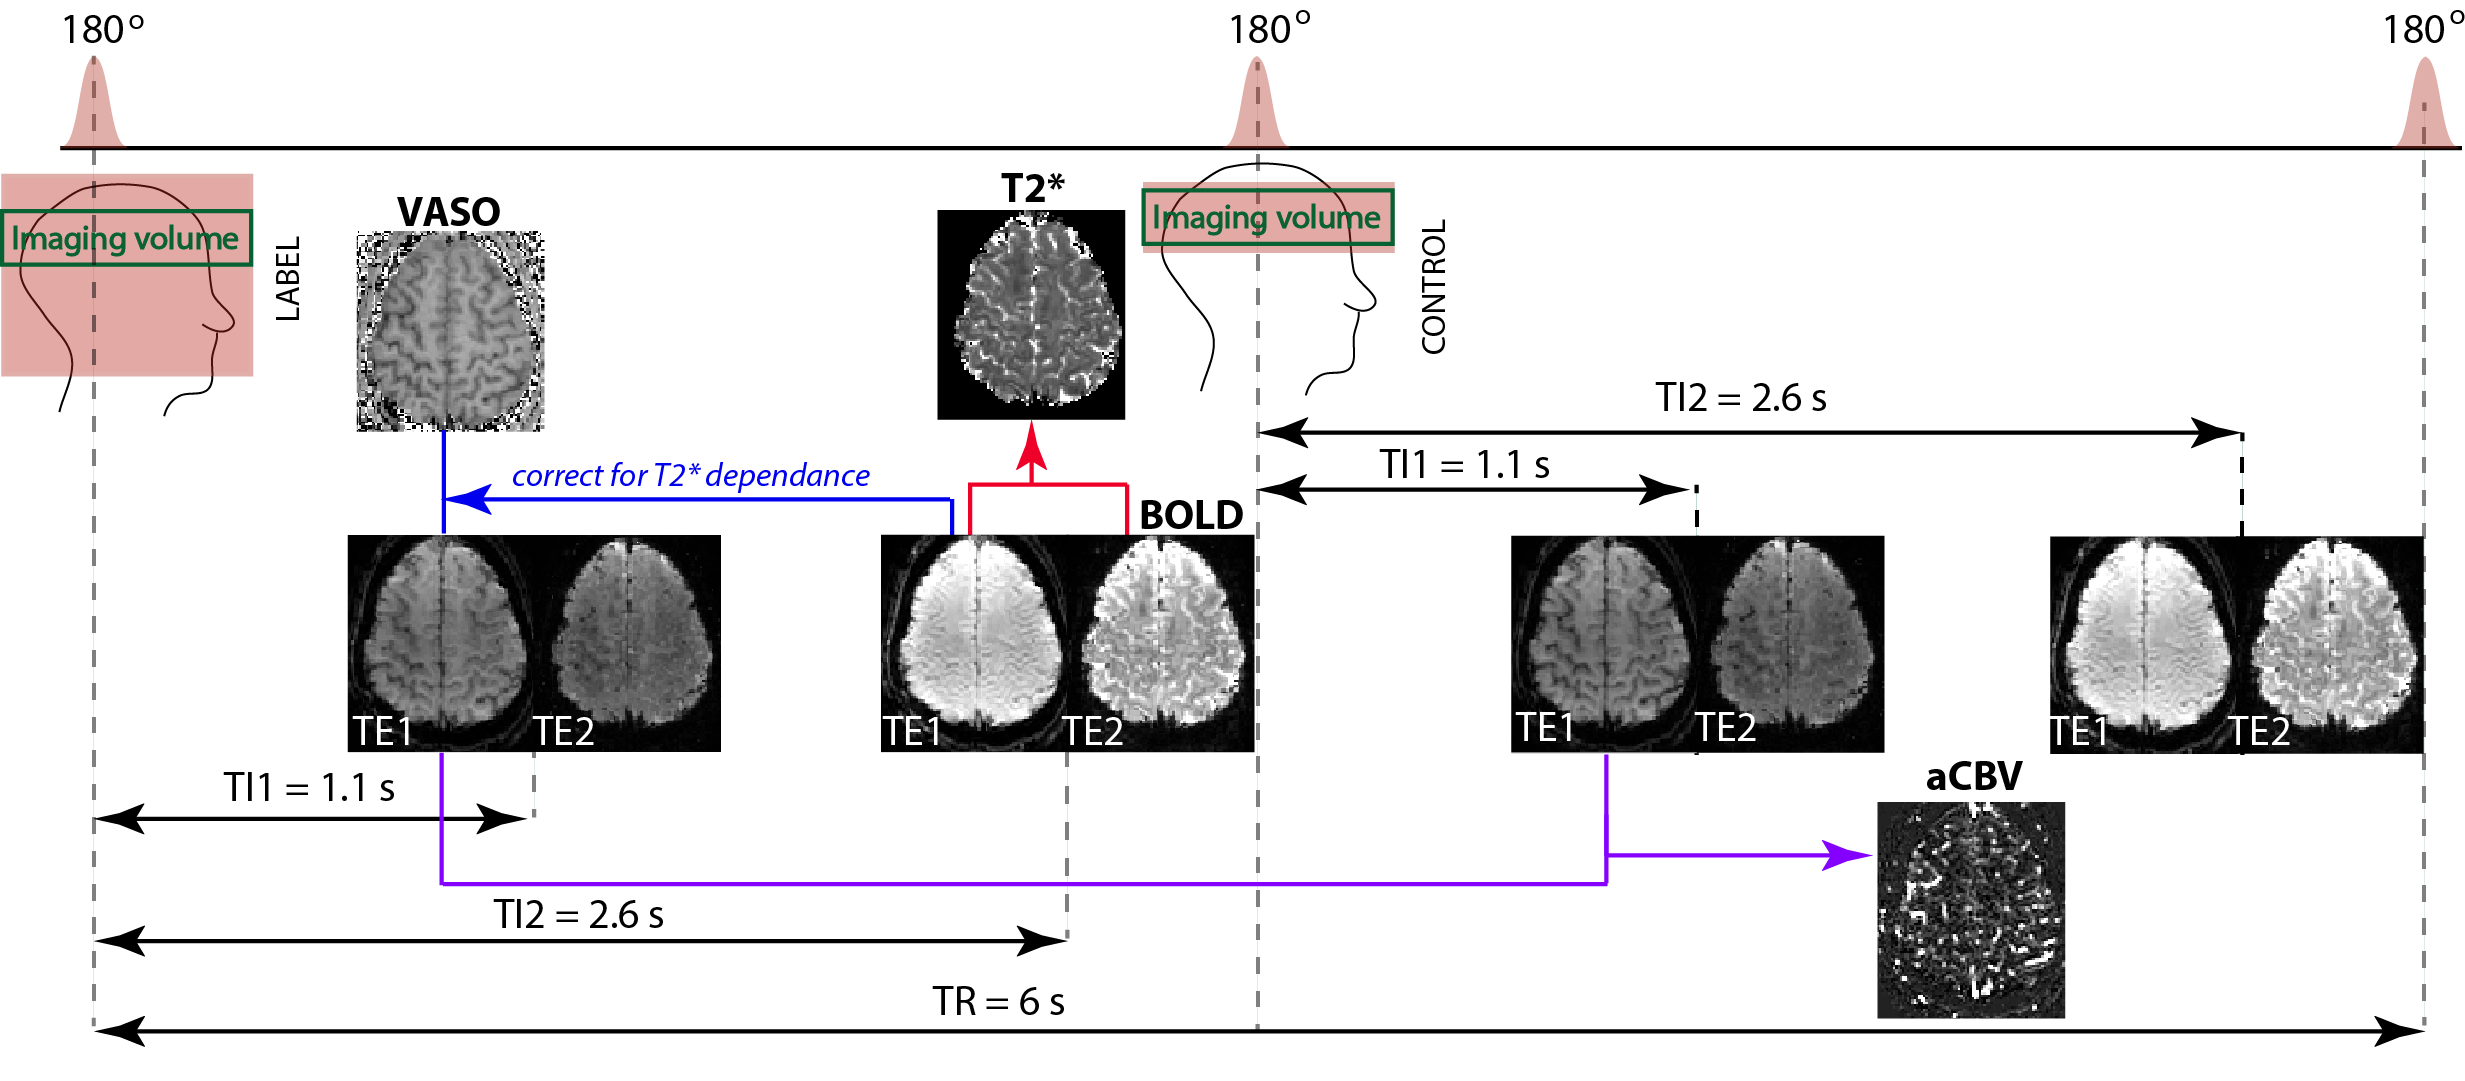
We implemented a Flow Sensitive Adiabatic Inversion Recovery (FAIR) double acquisition sequence with double echo readout on a Philips 7T Achieva scanner (Fig1) to measure simultaneously CBV, aCBV, and BOLD. The first excitation was at a post-label delay (TI1= 1100 ms), equivalent to the blood nulling point at 7T (2-4). A double echo EPI readout was used providing two label blood-nulled images at echo times of TE1=10ms and TE2=33 ms. Double echo BOLD images were acquired after a second excitation at TI2 =2600 ms. A FAIR scheme was implemented to collected VASO data from the non-selective (NS) inversion data, and aCBV data from the difference of slice-selective (S) and non-selective inversion data, with a NS/S TR of 6 s. 5 axial slices were collected with 1.75 mm isotropic resolution (field of view=154x154 mm2, SENSE = 2.5, partial Fourier= 0.8). The shorter echo time images at TI1 were used to compute the aCBV time series (by subtracting the label from the control image) and T2* independent VASO time series (by dividing the label blood nulled image by the BOLD with the same echo time (2)). The second echo time was used for optimal BOLD contrast. A T2* time series was also computed by combining the two BOLD echoes. Both a motor (bilateral finger tapping) and somatosensory (vibrotactile sensory stimulation to both hand digits) block paradigms were used to activate both sides of the central sulcus. Each functional run consisted of 8 cycles of 48 s rest period alternating with 30 s of stimulation. One motor and two somatosensory functional runs were collected in four subjects. The time series were analyzed using a general linear model using mrTools (NYU). Active areas were identified using a z-threshold of 2.3, with no spatial smoothing applied.RESULTS
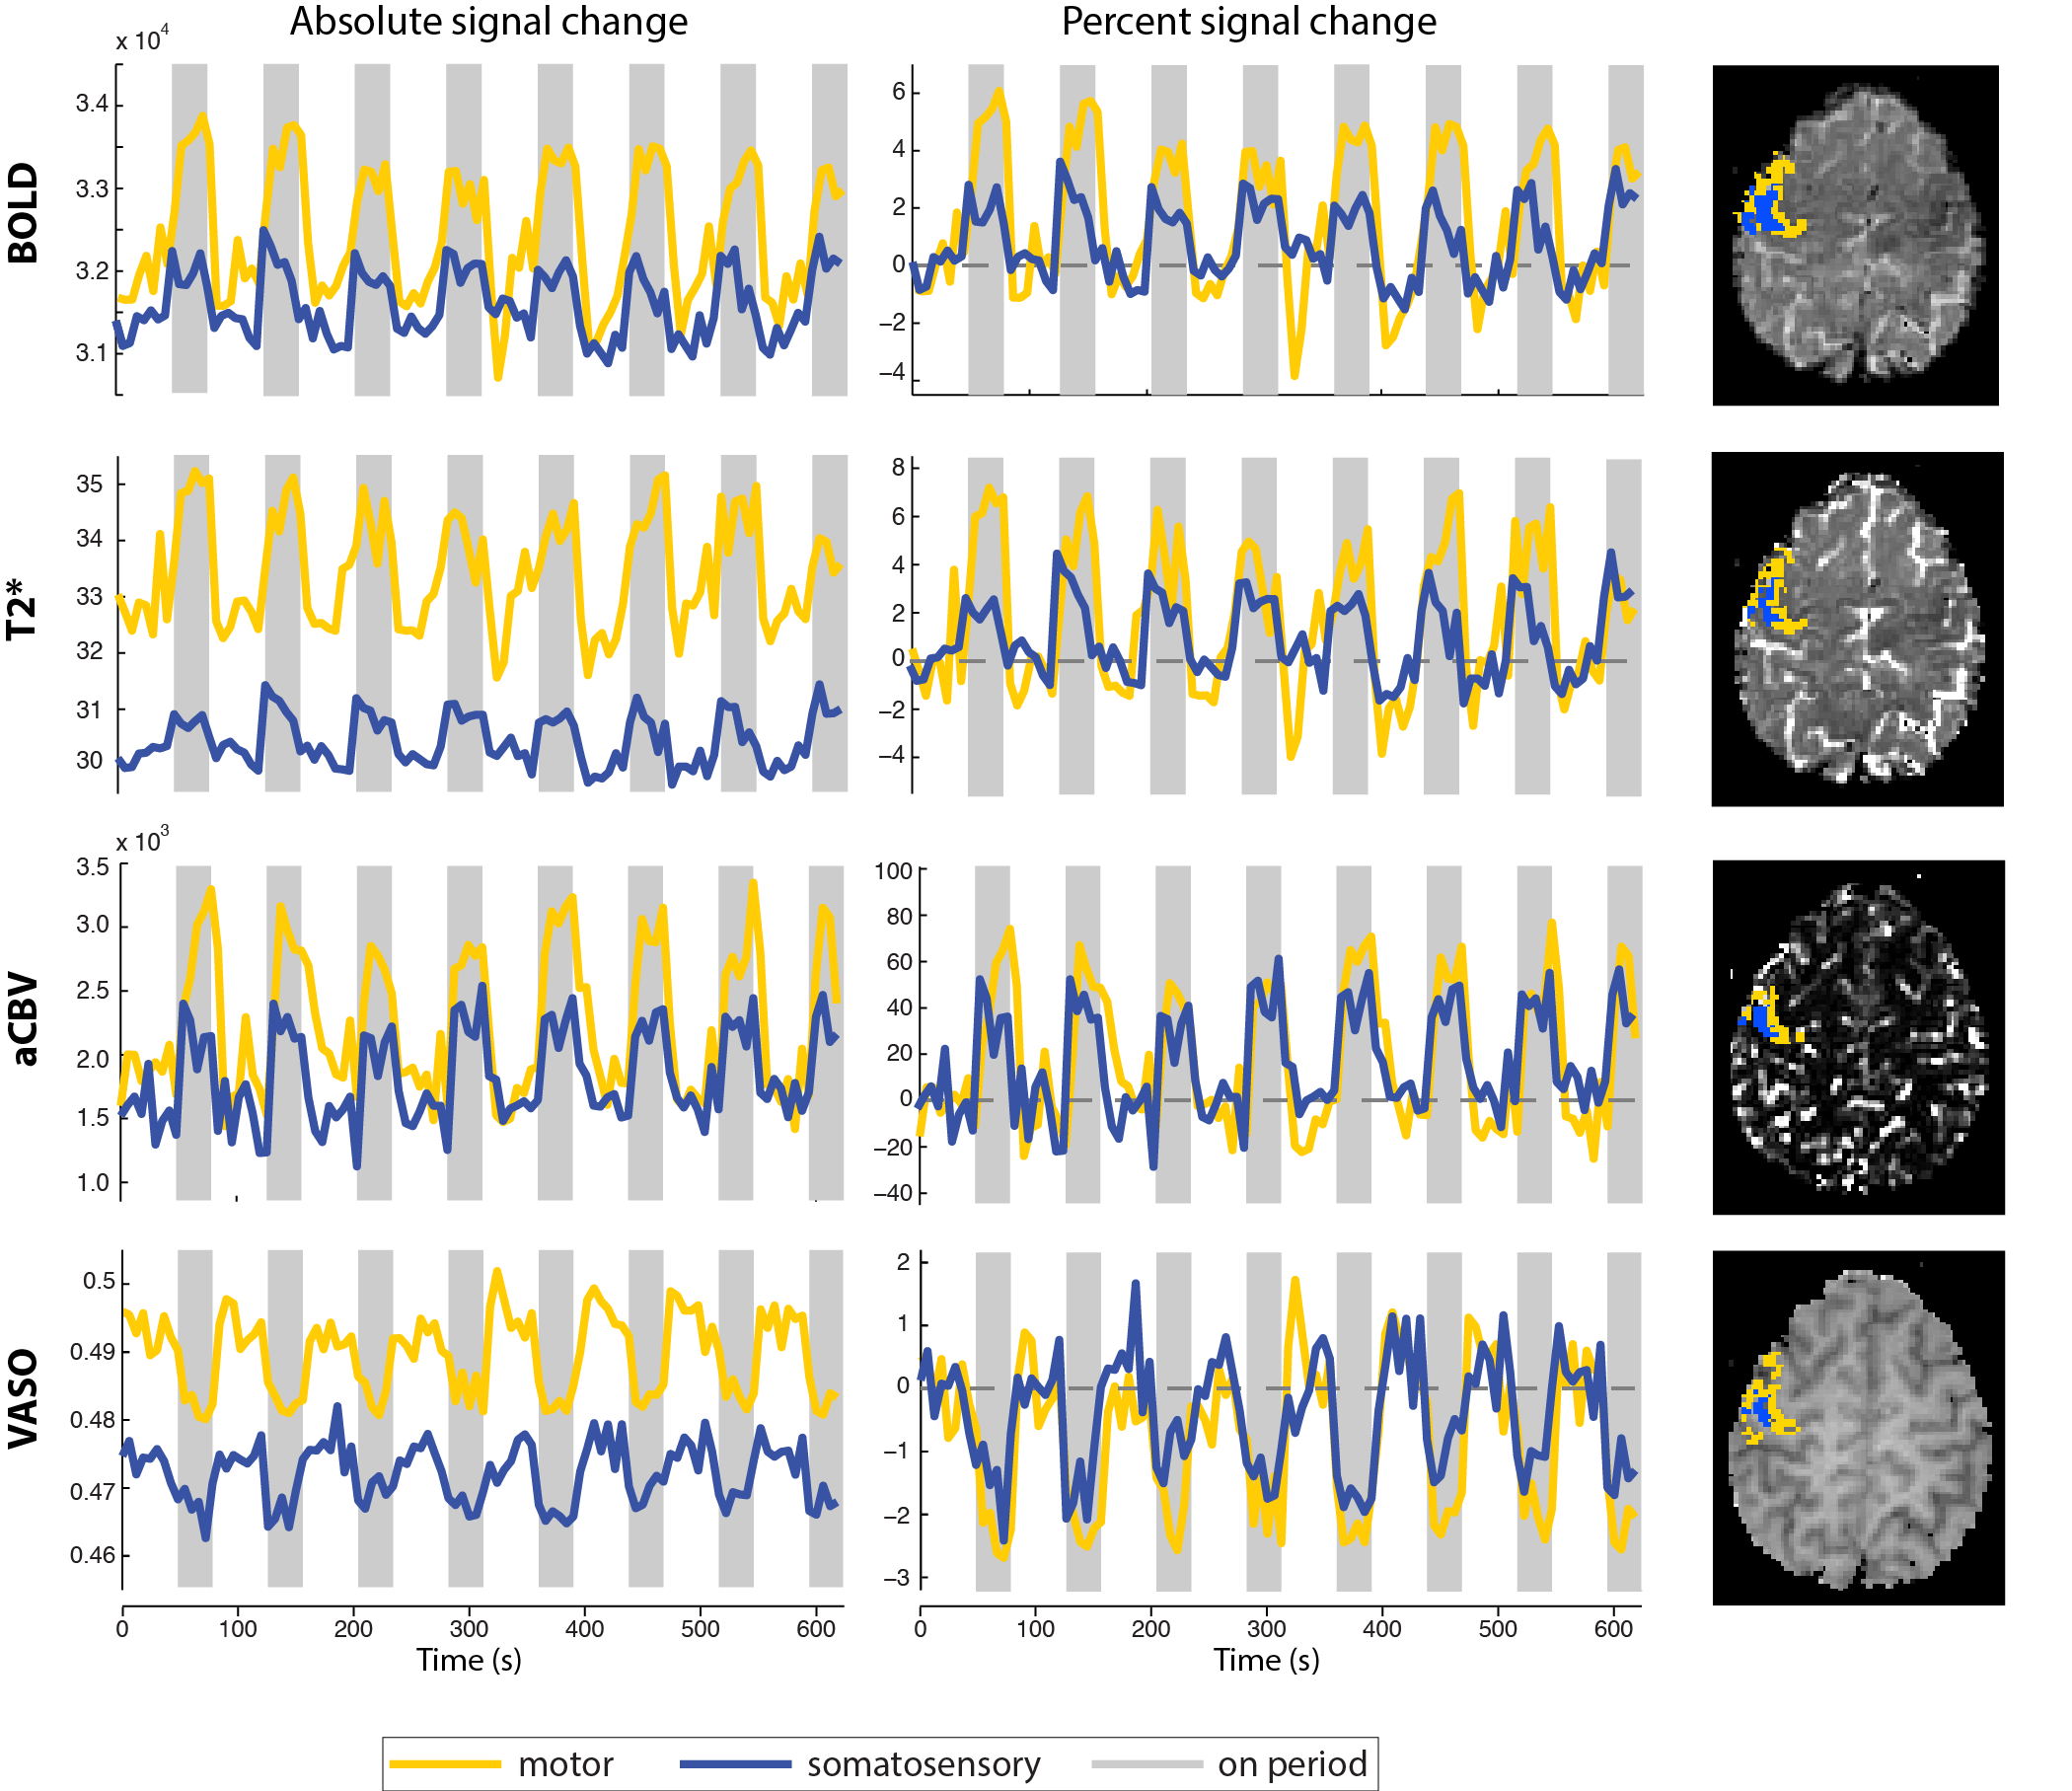
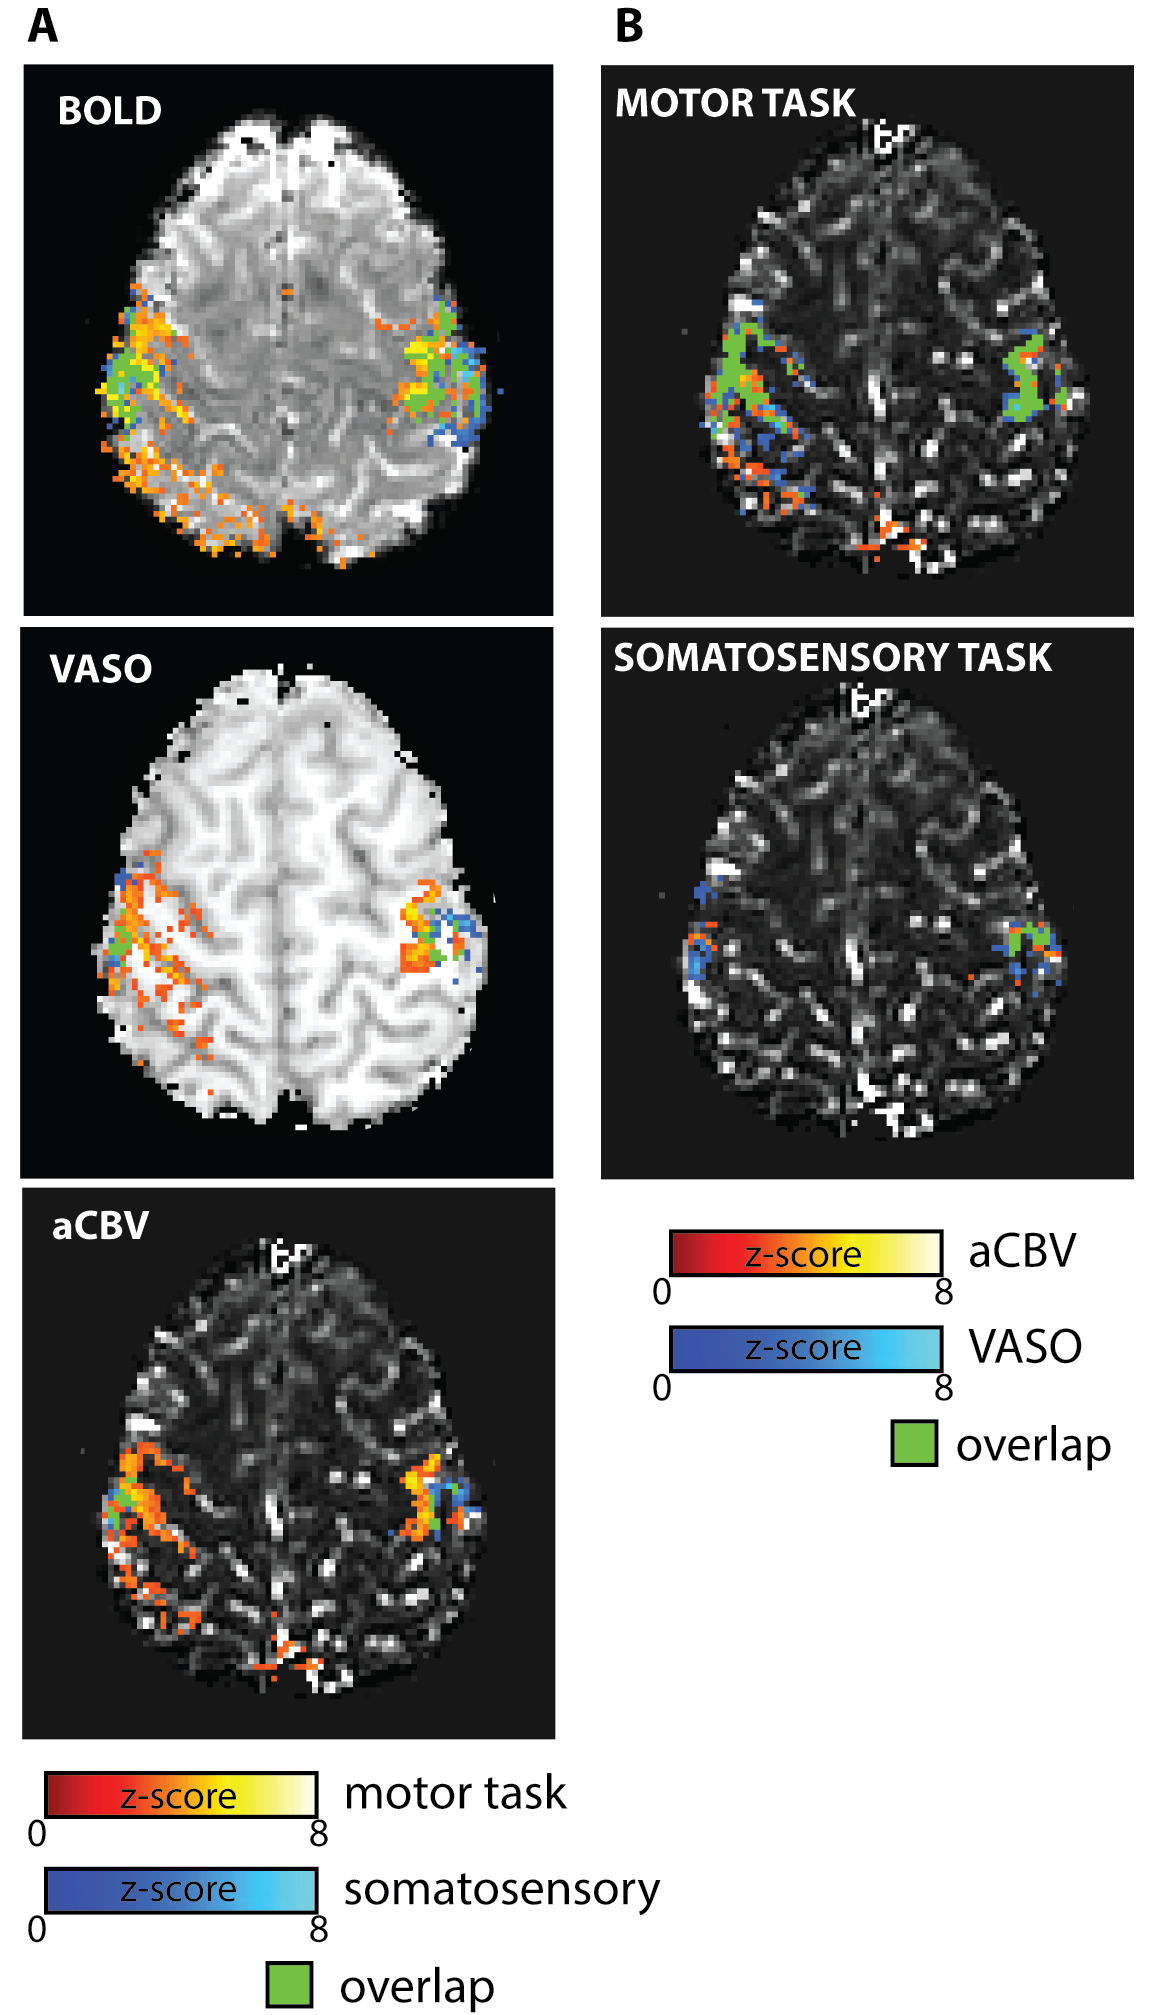
Significant signal changes were detected with BOLD, T2*, aCBV and VASO measures in both motor and somatosensory experiments for all subjects. Example time courses for each measure are plot in Figure 2, with all measured signals showing high modulation. Statistical activation maps for each of the measures are shown in Figure 3. Notice that the extent of the activation is significantly larger for BOLD than aCBV and VASO, with a greater overlap for between voxels that respond to both the motor and somatosensory paradigm (green regions). The average number of active voxels for BOLD/VASO/aCBV was 915±62 / 465±50 / 339±34 and 343±28 / 78±13 / 89±14 in motor and somatosensory experiments respectively (mean ± sem, N=8 hemispheres). Figure 3B compares VASO and aCBV activation maps, showing that there is large overlap between both methods (green areas). The percentage of aCBV and VASO voxels falling within the union of both ROIs was 67±9% and 70±6% respectively, and the percentage of common voxels in the combined ROI was 47±5%. Across subjects, 85±9% of voxels in the combined aCBV/VASO ROI fall within the BOLD defined ROI.DISCUSSION
We successfully measured aCBV and CBV changes induced by a motor task and by somatosensory stimulation. The sensitivity of both VASO and ASL methods is comparable and the extent of the elicited activation maps largely overlap. It has been possible to measure CBV in human somatosensory cortex, despite somatosensory stimuli inducing fMRI signal changes that are relatively weak compared to motor and visual modalities. In future, the boost in tSNR allowed by the use of local surface coils will be used to improve the spatial resolution in order to study layer specific changes within both sensory and motor modalities.CONCLUSION
This technique provides sufficient tSNR to measure aCBV and CBV changes in somatosensory cortex.Acknowledgements
This work was funded by a MRC grant and a Leverhulme fellowship.References
1. Hua J, Jones CK, Qin Q, van Zijl PC. Implementation of vascular-space-occupancy MRI at 7T. Magn Reson Med. 2013; 69(4):1003-1013.
2. Huber L, Ivanov D, Krieger SN, et al. Slab-Selective, BOLD-Corrected VASO at 7 Tesla Provides Measures of Cerebral Blood Volume Reactivity with High Signal-to-Noise Magn Reson Med. 2014; 72(1):137–148.
3. Krieger SN, Huber L, Poser BA, et al. Simultaneous acquisition of cerebral blood volume-, blood flow-, and blood oxygenation-weighted MRI signals at ultra-high magnetic field. Magn Reson Med. 2015; 74(2):513–517.
4. Huber L, Goense J, Kennerley AJ, et al. Cortical lamina-dependent blood volume changes in human brain at 7 T. Neuroimage. 2015;107:23-33.
Figures