5259
Relative latency and temporal variability of BOLD fMRI signal in the ventral visual pathway1Institution of Biomedical Engineering, National Taiwan University, Taipei, Taiwan, 2Department of Neuroscience and Biomedical Engineering, Aalto University, Espoo, Finland
Synopsis
We used simultaneous-multi-slice inverse imaging to characterize the relative latency and temporal variability of BOLD signals in the human ventral visual pathway with 0.1 s precision. The intra-subject and inter-subject variability were 0.39 (s) +/- 0.49 (s) and 0.51 (s) +/- 0.77 (s) when images of faces were presented. When scrambled faces were shown, the intra-subject and inter-subject variability were 0.42 (s) +/- 0.46 (s) and 0.56 (s) +/- 0.74 (s). With higher temporal resolutions, we showed temporal variability of HRF vary across cortical areas. Within the same cortical area, the temporal variability of HRF differ between different visual stimulations.
PURPOSE
BOLD signals have been shown to vary in timing and amplitude across trials 1,2, brain regions 3, and tasks 3,4. Most of these studies examined variability of BOLDs in the primary visual and motor cortices. While it has been reported that BOLD signals are reliable within individuals, relative latency and temporal precision beyond the primary visual cortex in the ventral pathway have yet to be quantitatively described.
Here we used simultaneous-multi-slice inverse imaging (SMS-InI) method 5 , a fast fMRI acquisition method capable of achieving 10 Hz sampling rate, 5 mm spatial resolution and whole-brain coverage, to characterize the hemodynamic responses in the human ventral visual pathway. Specifically, we estimated the relative latency and temporal variability of the BOLD signal with 0.1 s precision.
METHODS
Subjects (n = 9) were recruited to this study with written informed consents approved by the Institute Review Board of National Taiwan University Hospital. Visual stimuli of faces from eight individuals 6 and the phase-scrambled versions of the same stimuli were presented randomly to the subjects. Subjects were required to identify whether a face was presented or not by pressing buttons. fMRI data were collected on a 3T scanner (Skyra, Siemens, Erlangen, Germany) using a 32-channel head coil array and SMS-InI 5. Imaging parameters were: TR =0.1 s, TE =25/27.5 ms for two slice sets in simultaneous-echo-refocusing, and flip angle =30o. Each run of the experiment lasted for 330 s (3300 acquisitions). Four runs of data were collected for each subject. 3D T1-weighted structural images were also collected (MP-RAGE sequence) for visualization and localizing anatomical landmarks (FreeSurfer).
Functional data were first volumetrically reconstructed using the by the regularized SENSE algorithm 7,8. Hemodynamic response functions (HRFs) for each visual stimulation were estimated by the General Linear Model (GLM) using finite impulse response basis functions. BOLD responses were estimated using a bootstrap approach. Specifically, we generated bootstrap estimates of the HRF by randomly partitioning the trials into two non-overlapping sets prior to the GLM analysis. Thus two estimates of the evoked HRF response were generated. The bootstrap procedure was repeated 30 times.
To estimate relative latency of the BOLD signal, we first calculated template HRFs for each subject at each region of interest (calcarine fissure and fusiform gyrus). Then, we calculated cross-correlations between the template HRF and each bootstrap estimated HRF at each location in each ROI. The template HRF was temporally shifted (+4 and −4 seconds with 0.1 s steps), and the reported relative latency was defined as the shift corresponding to the highest correlation coefficient. To estimate the variability of BOLD responses, the intra-subject and inter-subject temporal variability were calculated by taking the standard deviation of relative latency across bootstrap samples and across subjects.
RESULTS
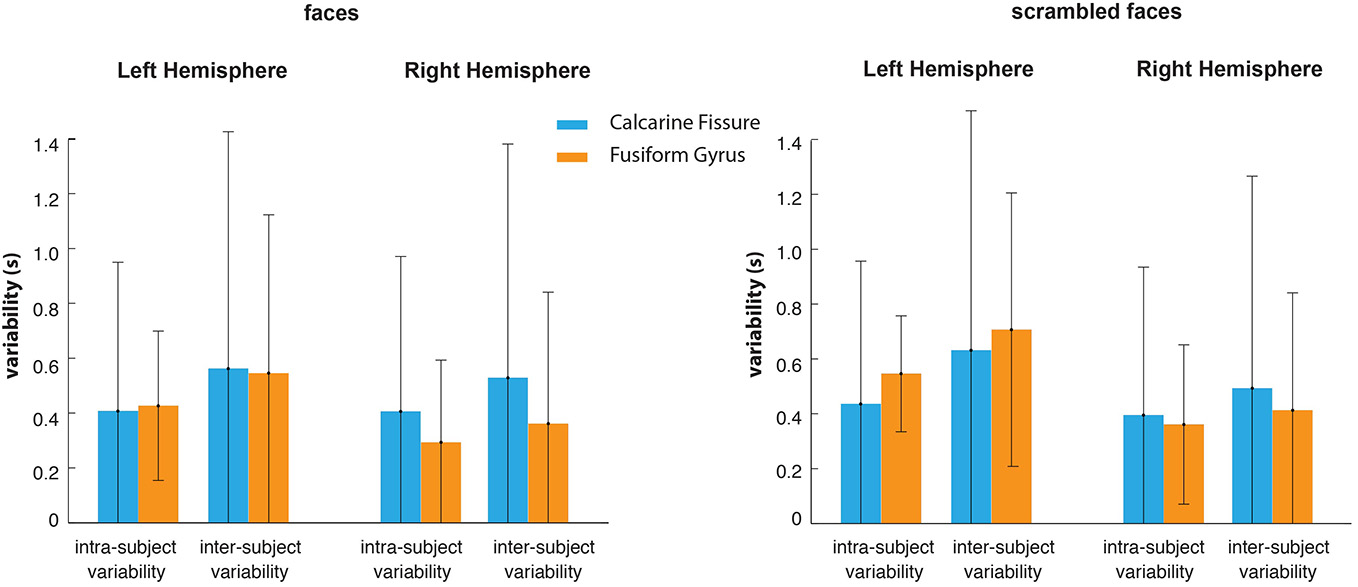
Strong BOLD signals were found in the calcarine fissure and fusiform gyrus of the left and right hemispheres. The relative latency of BOLD responses ranged between -1.07 s and +1.2 s when images of faces were presented. When scrambled faces were presented, the relative latency of BOLD responses ranged between -0.85 s and +1.0 s. Across ROI’s and stimuli, inter-subject variability (about 0.54 s +/- 0.75) was significantly higher than intra-subject variability (about 0.41 s +/- 0.47 s) (p<0.001). Intra-subject variability was significantly greater in the calcarine fissure (0.41 s +/- 0.55) compared to fusiform gyrus (0.35 s +/- 0.29) when faces were presented (p<0.005), but not scrambled faces. In the fusiform area, intra-subject variability was significantly smaller when faces (0.35 s +/- 0.29) were presented compared to scrambled faces (0.44 s +/- 0.27) (p<0.001), but not in the calcarine fissure.DISCUSSION
We estimated the relative latency and temporal variability of the BOLD responses in the human ventral visual pathway with high temporal precision. While being considered as the most reliable measure, within-subject BOLD signals can still vary in a sub-second scale over repetitions within the same subject. The temporal variability of the HRF is smaller within the same subject than across subjects. The temporal variability across subjects is below 1 sec. This variability characterization can be used as the prior information in Bayesian fMRI analysis 9 when the HRF variability is considered.
With the same visual stimulation, the temporal variability of BOLD signals differs significantly across cortical areas beyond the primary visual cortex. Within the same cortical area, temporal variability of BOLD signals also differs when different visual stimulation was used (faces versus scrambled faces). The temporal variability between different stimulation within the same cortical area could be associated with their functional roles rather than vascular contributions.
Acknowledgements
This work was partially supported by Ministry of Science and Technology, Taiwan (103-2628-B-002-002-MY3, 105-2221-E-002-104), and the Academy of Finland (No. 298131).References
1. Duann JR, Jung TP, Kuo WJ, Yeh TC, Makeig S, Hsieh JC, Sejnowski TJ. Single-trial variability in event-related BOLD signals. Neuroimage 2002;15(4):823-35.
2. Aguirre GK, Zarahn E, D'Esposito M. The variability of human, BOLD hemodynamic responses. Neuroimage 1998;8(4):360-9.
3. Handwerker DA, Ollinger JM, D'Esposito M. Variation of BOLD hemodynamic responses across subjects and brain regions and their effects on statistical analyses. Neuroimage 2004;21:1639-1651.
4. Miezin FM, Maccotta L, Ollinger JM, Petersen SE, Buckner aRL. Characterizing the Hemodynamic Response: Effects of Presentation Rate, Sampling Procedure, and the Possibility of Ordering Brain Activity Based on Relative Timing. Neuroimage 2000;11:735–759.
5. Chu YH, Hsu YC, Lin FH. Simultaneous multi-slice inverse imaging for high temporal resolution fMRI. Proc Intl Soc Magn Reson Med 2016:946.
6. Ekman P. Are there basic emotions? Psychol Rev 1992;99:550-553.
7. Lin FH, Huang TY, Chen NK, Wang FN, Stufflebeam SM, Belliveau JW, Wald LL, Kwong KK. Functional MRI using regularized parallel imaging acquisition. Magn Reson Med 2005;54(2):343-53.
8. Lin FH, Kwong KK, Belliveau JW, Wald LL. Parallel imaging reconstruction using automatic regularization. Magn Reson Med 2004;51(3):559-67.
9. Woolrich MW, Jenkinson M, Brady JM, Smith SM. Fully Bayesian spatio-temporal modeling of FMRI data. IEEE Trans Med Imaging 2004;23(2):213-31.
Figures