5258
Gadoxetic acid-enhanced MR imaging of the liver: the effect on hepatic fat quantification in hepatobiliary phase using mDXION-Quant1Tianjin First Center Hospital, Tianjin, People's Republic of China, 2Philips healthcare, Beijing, People's Republic of China
Synopsis
This study evaluated the effect of Gd-EOB-DTPA on fat quantification using a multiecho reconstruction technique with T2* correction. Forty-six patients with suspected hepatic tumors underwent Gd-EOB-DTPA enhanced MR imaging and single breath hold 3D mDIXON-Quant for hepatic fat quantification before and 20 minutes after the administration of Gd-EOB-DTPA. Fat fraction (FF) and R2* of the liver parenchyma, spleen parenchyma and vertebral body were measured and compared between pre- and post-contrast. FF measurements of liver, spleen, vertebral body and R2* measurements of liver, spleen revealed no significant difference between the two measurements, and R2* increased in liver and vertebral body significantly after 20 minutes of Gd-EOB-DTPA administration. In addition, good agreement of FF measurement was seen in the Bland-Altman plots. We conclude mDXION-Quant can obtain stable fat quantification in the hepatobiliary phase, without the impact of an increased R2* in liver parenchyma. But R2* maps should be obtained prior to Gd-EOB-DTPA administration.
Purpose
Fatty liver is a common disease in the world, it can exist alone or with other liver disease. Recently, a 3D multi-echo DIXON method have been introduced as a nonivasive method for accurate and reproducible quantification of liver fat[1]. In order to avoid the possible bias from the susceptibility effect from contrast agent, fat quantification sequence is usually performed before the contrast injection. However, in clinical practice, due to the hepatocyte-selective function, Gadoxetic acid (Gd-EOB-DTPA)-enhanced MRI has been widely used for the detection of liver lesions, and hepatobiliary phase images at 20 minutes is the most frequently used time point[2-3]. There was a long time interval between the dynamic phases and hepatobiliary phase. In order to improve the efficiency of practical protocol of Gd-EOB-DTPA-enhanced liver MRI examination, the purpose of this study is to evaluate the effect of Gd-EOB-DTPA on fat quantification using a multiecho reconstruction technique with T2* correction.Materials and methods
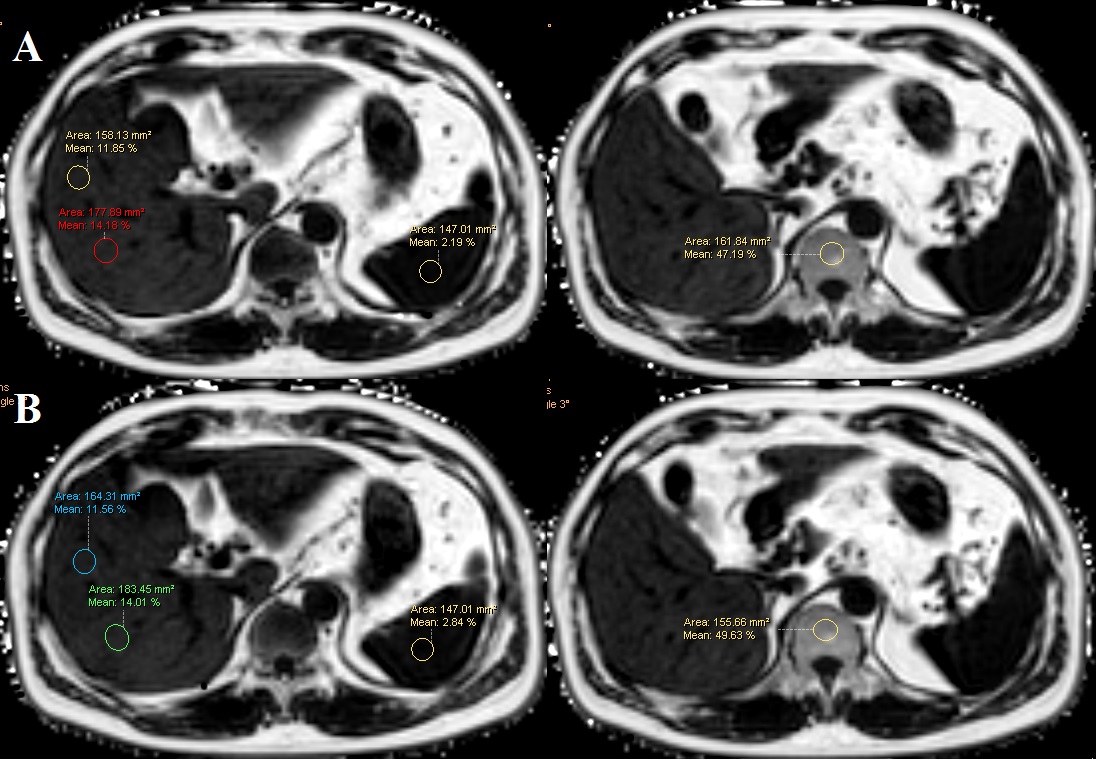
Forty-six patients (21 female, 25 male; mean age, 55.4 ± 13.2 years; Range 19-79 years) with suspected hepatic tumors underwent Gd-EOB-DTPA enhanced MR imaging using a 3.0T MRI scanner (Ingenia, Philips, Healthcare, Best, the Netherlands). The single breath hold 3D mDIXON-Quant sequence for hepatic fat quantification was acquired before and after 20 minutes of Gd-EOB-DTPA enhancement. The main parameters included: TR/TE1=4.2/0.95ms, 6 echoes with delta TE 0.8ms, FA=3°, resolution=2.5×2.5×3.0 mm, FOV=300×360 mm, slice thickness=6 mm, scan time=17 sec, NSA=2, SENSE=2. Ten regions of interest (ROIs) were selected in the liver and three ROIs in the spleen and vertebral body, on the upper, hilar and lower slices with attention to avoid the blood vessels, fat fissure and artifact region. Fat fraction (FF) and R2* of the liver parenchyma, spleen parenchyma and vertebral body were defined as the average value of the all ROIs within the corresponding area. Bland-Altman plots were used to assess the agreements between pre- and post-contrast. Paired t test was used to determine significant differences in the mean FF and R* of the liver parenchyma, spleen parenchyma and vertebral body.Results
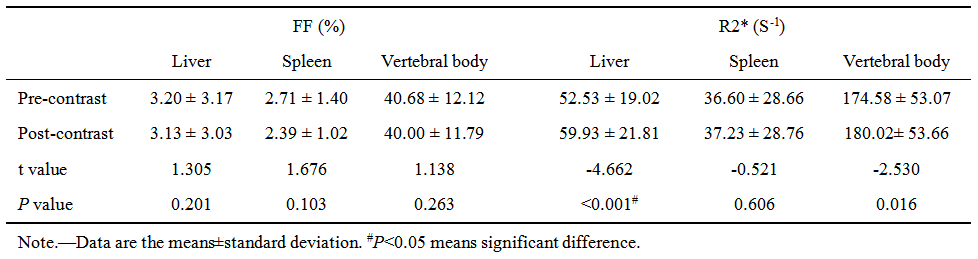
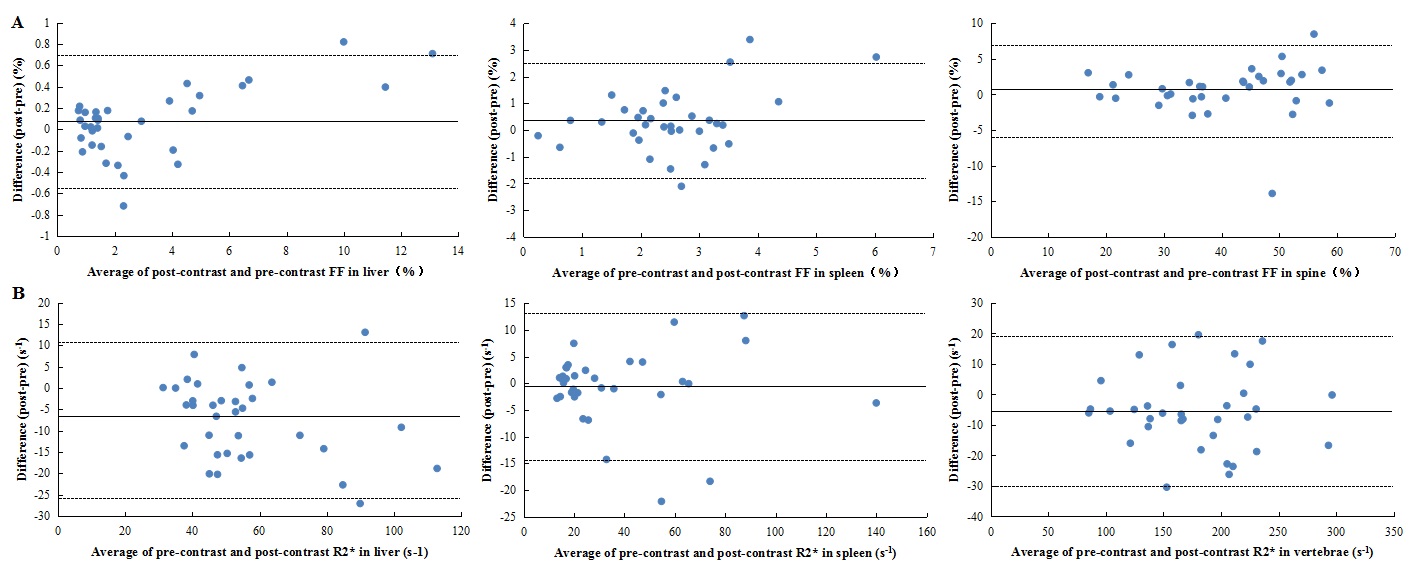
The pre- and post-contrast FF and R* value of the liver, spleen and vertebral body were compared and summarized in table 1. The method of ROI placing in liver, spleen and vertebral body were shown in Fig.1. Bland-Altman plots that demonstrated the agreement of FF and R2* measurements between the pre- and post-contrast were shown in Fig.2. FF measurements of liver, spleen, vertebral body and R2* measurements of liver, spleen revealed no significant difference between the two measurements (P>0.05 for all). R2* increased in liver and vertebral body significantly (P<0.001, P=0.016) after 20 minutes of Gd-EOB-DTPA administration. The Bland and Altman analysis showed the agreements of FF measurements in liver (95% confidence interval (CI): -0.54~0.69 ), spleen (95% CI: -1.90~2.55), vertebral body (95% CI: -6.13~7.49) and R2* measurements in liver (95% CI: -6.13~7.49), spleen (95% CI: -14.46~13.20) and vertebral body (95% CI: -30.00~19.12).Discussion
After the administration of Gd-EOB-DTPA, 50% was taken up by hepatocytes in the hepatobiliary phase. Whereas, in this study, pre-contrast and post contrast (hepatobiliary phase) FF of liver, spleen and vertebral body were similar. In addition, good agreement of FF measurement was seen in the Bland-Altman plots. These indicate mDXION-Quant is a stable method for fat quantification and allows FF measurements to be performed during the hepatobiliary phase of Gd-EOB-DTPA-enhanced liver MRI. Therefore, a high clinical efficiency can be obtained. However, post-contrast R2* of liver and vertebral body were significantly higher than the pre-contrast one, these indicate mDXION-Quant must be performed pre-contrast when R2* measurement was used.Conclusion
mDXION-Quant can obtain stable fat quantification in the hepatobiliary phase, without the impact of an increased R2* in liver parenchyma. Therefore, mDXION-Quant can be applied post-contrast to improve the efficiency of MR examination. The hepatic and vertebral R2* increased significantly at hepatobiliary phase. Therefore, R2* maps should be obtained prior to Gd-EOB-DTPA administration.Acknowledgements
No.References
1. Kukuk GM, Hittatiya K, Sprinkart AM, et al. Comparison between modified Dixon MRI techniques, MR spectroscopic relaxometry, and different histologic quantification methods in the assessment of hepatic steatosis. Eur Radiol. 2015;25(10):2869-2879.
2. Rhee H, Kim MJ, Park MS, Kim KA. Differentiation of early hepatocellular carcinoma from benign hepatocellular nodules on gadoxetic acid-enhanced MRI. Br J Radiol. 2012. 85: e837-844.
3. Peporte AR, Sommer WH, Nikolaou K, Reiser MF, Zech CJ. Imaging features of intrahepatic cholangiocarcinoma in Gd-EOB-DTPA-enhanced MRI. Eur J Radiol 2013; 82:e101-106.
Figures