5257
Characterize the Effect of Regional Variations in Venule Vasculature Related to Temporal Variability of Hemodynamic Responses Latency at the Human Primary Visual Cortex1Institute of Biomedical Engineering, National Taiwan University, Taipei, Taiwan, 2Department of Medical Imaging, Taipei Medical University - Shuang Ho Hospital, New Taipei, Taiwan, 3Aim for the Top University Project Office, National Taiwan Normal University, Taipei, Taiwan, 4Department of Neuroscience and Biomedical Engineering, Aalto University, Espoo, Finland
Synopsis
We correlated between the temporal chacteristics of the BOLD signals and venule structure at human primary visual cortex (V1). Functional MRI was measured by the high temporal resolution (100ms) simultaneous-multi-slice inverse imaging. Venule probability map was estimated from high spatial resolution (0.85mm) susceptibility-weighted imaging (SWI). Siginficant correlation was found between venule density and intra-/inter-subject temporal variability of the BOLD signal at V1. This correlation suggests that the temporal instability of BOLD signal is likely attributed to vascular structure or reactivity.
Purpose
The blood oxygenation level-dependent (BOLD) signal varies significantly across subjects, brain regions, and repetitive measurements1-4. The BOLD signal is highly weighted by venous oxygenation changes5, 6. The latency in the BOLD dynamics is closely related to the transit time of the oxygenated blood5 and the expansion of venous drainage system7, 8. Based on previous studies, here we hypothesize that the local venule vasculature differences underlie the variability of the BOLD latency. To test ths hypothesis, we used high temporal resolusion simultaneous-multi-slice inverse imaging (SMS-InI)9 to record BOLD signal latency and variabilily at the human visual cortex. Meanwhile, we also estimated a venule probability (VP) map. Via the correlation between these two measures, we aimed at revealing how the regional variations of venule vasculature is related to the temporal variability of the BOLD signal.Methods
Data were collected on a 3T MRI scanner (Skyra, Siemens) from 11 healthy subjects with written informed consents approved by local Institute Reviewing Board. SMS-InI measured the BOLD signal with 100 ms temporal precision, 5mm isotropic spatial resolution, and whole-brain coverage9. A local template of the BOLD dynamics elicted by checkerboard flashing (500 ms duration; 8 Hz reveral) at the human primary visual cortices (V1) were estimated by General Linear Model (GLM) with finite impulse response bases (30-s duration with 6-s pre-stimulus baseline) for each subject. Four runs of data were collected from each subject and each run included 60 trials of visual stimuli. The V1 regions-of-interest (ROIs) was identified between the intersection of fMRI and probabilistic labels provided by the FreeSurfer10, 11. The relative latency and the variability of the BOLD response at each cortical location were estimated from an ensemble of responses estimated by using a bootstrap approach, each iteration of which randomly partitioned all trials into two groups and GLM was used to estimate the hemodynamics for each group. The bootstrap was repeated 100 times. The time instant maximizing the correlation coefficient between the BOLD reponse in each bootstrap and the local template (shifting +/- 4 s) was marked. The relative latency was the average of this timing across 100 bootstrap iterations and subjects. The intra-subject variability was the standard deviation across bootstrap iterations and then the average across subjects. The inter-subject variability was the average across bootstrap iterations and then the standard deviation across subjects.
Vasculature was measured by the vesselness method12-14 based on susceptibility-weighted images (SWI; TR/TE = 27/20 ms, flip angle = 15°, Voxel size = 0.86x1.86x1.5 mm3, FOV = 22x20x12 cm3). The vesselness method allows us to visualize the venous vascular tree across the brain (Figure 1, right). Structural images for each subject were also acquired using a 3D T1-weighted sequence (MP-RAGE). The location of the gray-white matter boundary for each subject was estimated to yield a cortical model15-17, which was used to register individual’s fMRI and SWI data to their own cortical surface space. Between-subject averaging was done by morphing individual data through a spherical coordinate system18 implemented in Freesurfer10, 11. The VP map (Figure 2, bottom) were generated by estimating the probability of venules at each location in all subjects. Finally, we calculated the Pearson’s correlation coefficient between VP and intra-/inter- subject temporal variability of hemodynamic responses as well as the BOLD latency at V1.
Results
V1 locations sensitive to peripheral vision (large eccentricity) and vertical meridian shows more extreme values of relative latency and intra-/inter-subject variability. No clear trends of VP distribution was found by inspection (Figure 2). However, we found that VP was significantly correlated to intra- (r2 = 0.07; p = 0.002; Figure 3, middle) and inter- (r2 = 0.05; p = 0.013; Figure 3, right) subject temporal variability of hemodynamic responses within V1. However, no significant correlation between the BOLD latency and VP (r2 = 0.00; p = 0.59; Figure 3, left).Discussion & Conclusion
The correlation between VP and the intra-/inter-subject variability corroborated with the previous study showing stronger BOLD signal has larger amplitude variability because more venous contribution leads to larger BOLD signal. In fact, this correlation was found in resting-state and task-related fMRI19. Significant correlations between the response variability and the VP also suggest the major source of instable BOLD responses from the underlying vascular structure and/or reactivity, rather than the associated neuronal response fluctuations. Taken together, better control over vascular responses is expected to improve the stability of BOLD signal.Acknowledgements
This work was partially supported by Ministry of Science and Technology, Taiwan (103-2628-B-002-002-MY3, 105-2221-E-002-104), and the Academy of Finland (No. 298131).References
1. Aguirre, G.K., E. Zarahn, and M.
D'Esposito, The variability of human,
BOLD hemodynamic responses. Neuroimage, 1998. 8(4): p. 360-9.
2. D'Esposito, M., et al., The effect of normal aging on the coupling
of neural activity to the bold hemodynamic response. Neuroimage, 1999.
10(1): p. 6-14.
3. Handwerker, D.A., J.M. Ollinger, and M.
D'Esposito, Variation of BOLD hemodynamic
responses across subjects and brain regions and their effects on statistical
analyses. Neuroimage, 2004. 21(4): p. 1639-51.
4. Huettel, S.A., J.D. Singerman, and G.
McCarthy, The effects of aging upon the
hemodynamic response measured by functional MRI. Neuroimage, 2001. 13(1):
p. 161-75.
5. Leonard, B.E., Neuropsychopharmacology—The fifth generation of progress. Edited by K.
L. Davis, D. Charney, J. T. Coyle, C. Nemeroff. Lippincott, Williams and
Wilkins: Philadelphia, 2002. ISBN: 0-7817-2837-1. Price: $189. Pages: 2080.
Human Psychopharmacology: Clinical and Experimental, 2002. 17(8): p. 433-433.
6. Keilholz, S.D., et al., BOLD and CBV-weighted functional magnetic
resonance imaging of the rat somatosensory system. Magnetic Resonance in
Medicine, 2006. 55(2): p. 316-324.
7. Buxton, R.B., E.C. Wong, and L.R.
Frank, Dynamics of blood flow and
oxygenation changes during brain activation: the balloon model. Magnetic
resonance in medicine, 1998. 39(6): p. 855-864.
8. Mandeville, J.B., et al., Evidence of a cerebrovascular postarteriole
windkessel with delayed compliance. Journal of Cerebral Blood Flow &
Metabolism, 1999. 19(6): p. 679-689.
9. Chu, Y.H., Y.C. Hsu, and F.H. Lin, Simultaneous multi-slice inverse imaging for
high temporal resolution fMRI. Proc Intl Soc Magn Reson Med, 2016: p. 946.
10. Fischl, B., et al., Cortical folding patterns and predicting cytoarchitecture. Cerebral
cortex, 2008. 18(8): p. 1973-1980.
11. Hinds, O.P., et al., Accurate prediction of V1 location from cortical folds in a surface
coordinate system. Neuroimage, 2008. 39(4): p. 1585-1599.
12. Frangi, A.F., et al. Multiscale vessel enhancement filtering. in International Conference on Medical Image Computing and
Computer-Assisted Intervention. 1998. Springer.
13. Descoteaux, M., L. Collins, and K.
Siddiqi. Geometric flows for segmenting
vasculature in MRI: Theory and validation. in International Conference on Medical Image Computing and
Computer-Assisted Intervention. 2004. Springer.
14. Descoteaux, M., D.L. Collins, and K.
Siddiqi, A geometric flow for segmenting
vasculature in proton-density weighted MRI. Medical image analysis, 2008.
12(4): p. 497-513.
15. Dale, A.M., B. Fischl, and M.I. Sereno, Cortical surface-based analysis: I.
Segmentation and surface reconstruction. Neuroimage, 1999. 9(2): p.
179-194.
16. Fischl, B., A. Liu, and A.M. Dale, Automated manifold surgery: constructing
geometrically accurate and topologically correct models of the human cerebral
cortex. IEEE transactions on medical imaging, 2001. 20(1): p. 70-80.
17. Fischl, B., M.I. Sereno, and A.M. Dale, Cortical surface-based analysis: II:
inflation, flattening, and a surface-based coordinate system. Neuroimage,
1999. 9(2): p. 195-207.
18. Fischl, B., et al., High-resolution intersubject averaging and a coordinate system for the
cortical surface. Human brain mapping, 1999. 8(4): p. 272-284.
19. Vigneau-Roy,
N., et al., Regional variations in
vascular density correlate with resting-state and task-evoked blood oxygen
level-dependent signal amplitude. Human brain mapping, 2014. 35(5): p.
1906-1920.
Figures
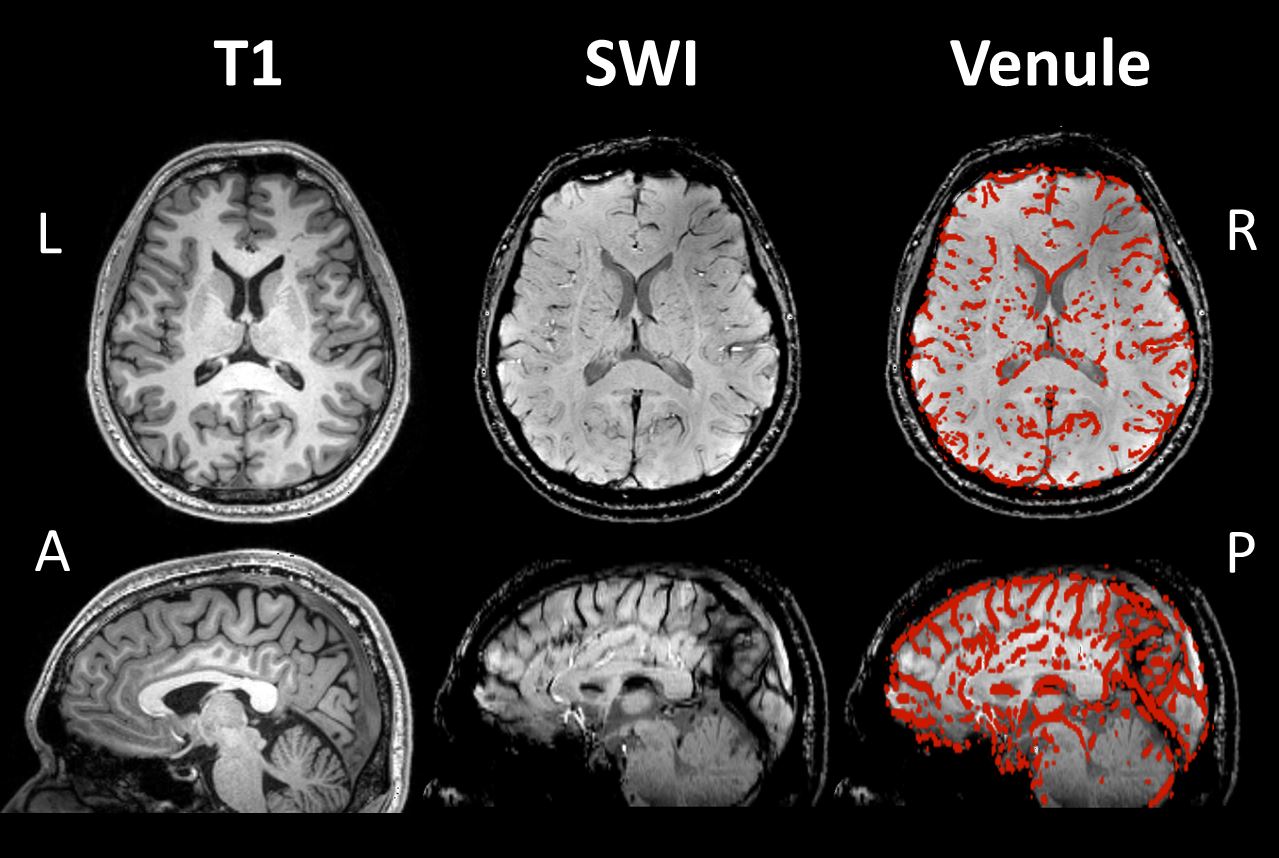
Fig. 1
Segmented venules from a single subject.
Left: T1 weighted anatomical image.
Middle: Susceptibility weighted imaging (SWI).
Right: The segmented venule overlaied on SWI. (The red color indicated segmented
venules)
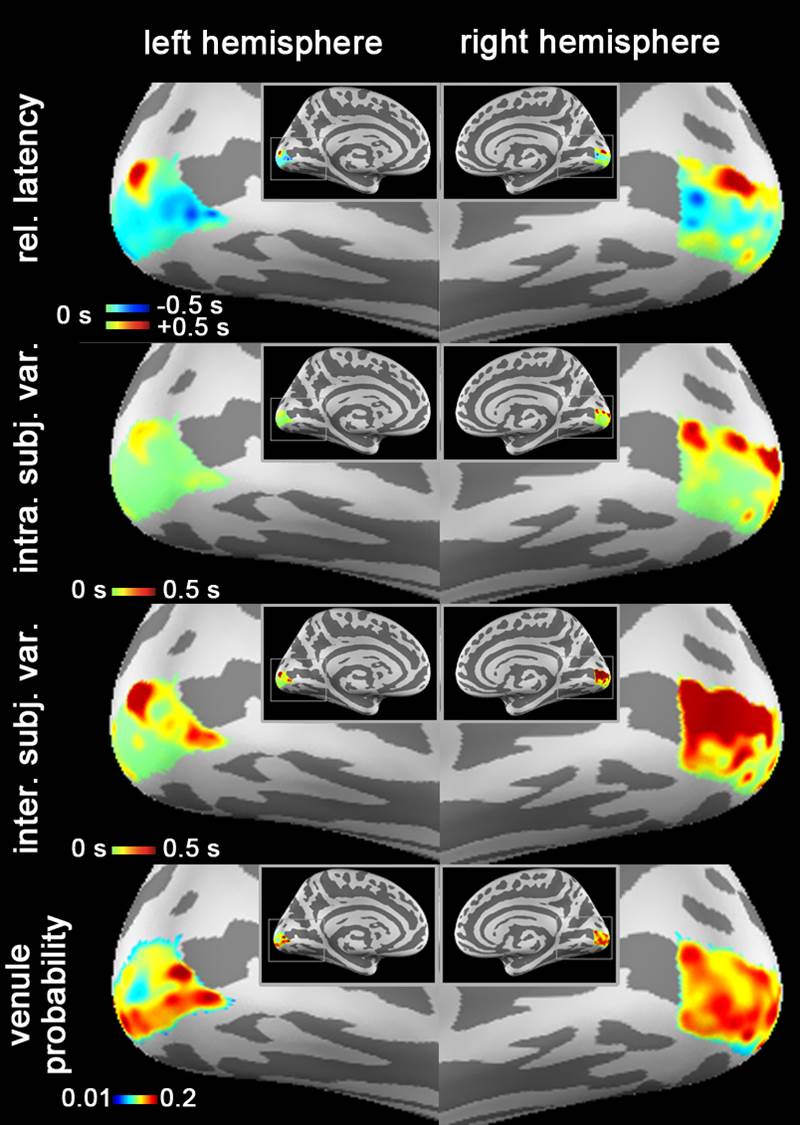
Fig. 2
Relative latency, temporal intra-/inter-subject variability, and venule probability
(VP) map.
Morph
the group average binary venule mask through the spherical coordinate system
implemented by Freesurfer to generate the VP map.
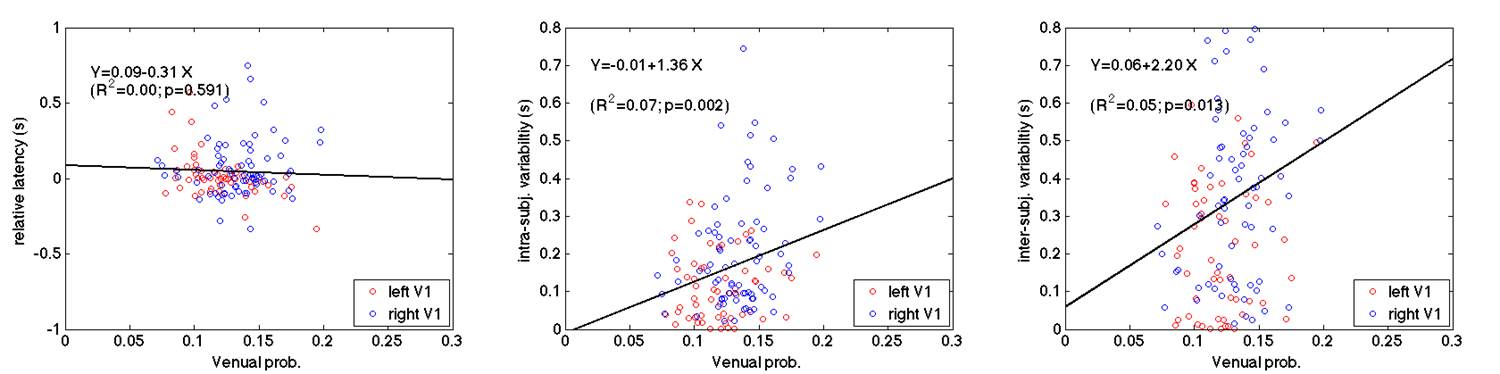
Fig. 3 Correlation betwen venule probability and relative
latency as well as inter-/intra-subject variability of the BOLD dynamics
Left: No signfignificant correlations between venule probability (VP) and the
relative latency of hemodynamic responses within V1.
Middle: Signficant correlation between venule probability (VP) and intra-subject
temporal variability of hemodynamic responses within V1.
Right: Signficant correlation between venule probability (VP) and inter-subject
temporal variability of hemodynamic responses within V1.