5256
Combined dynamic contrast enhanced MRI and diffusion-weighted imaging to evaluate the neoadjuvant chemotherapy (NACT) effect in patients with cervical cancerYusen Feng1, Yingying Ding2, Ya Zhang3, Chengde Liao3, Yan Jin2, and Peng Cao4
1Radiology Department, Third Affiliated Hospital of Kunming Medical University, kunming, People's Republic of China, 2Radiology Department, Third Affiliated Hospital of Kunming Medical University, 3Third Affiliated Hospital of Kunming Medical University, 4GE healthcare
Synopsis
In this article,to prospectively investigate the changes of quantitative parameters in dynamic contrast-enhanced MRI (DCE-MRI) and the apparent diffusion coefficient (ADC) of diffusion weighted imaging (DWI) in cervical cancer patients before and after neoadjuvant chemotherapy (NACT).It showed that quantitative parameters of DCE-MRI and ADC provided a new noninvasive way to reflect the changes of hemodynamics and water molecular diffusion in cervical cancer patients with NACT.
Purpose
To prospectively investigate the changes of quantitative parameters in dynamic contrast-enhanced MRI (DCE-MRI) and the apparent diffusion coefficient (ADC) of diffusion weighted imaging (DWI) in cervical cancer patients before and after neoadjuvant chemotherapy (NACT).Patients and Methods
Thirty-eight patients with locally advanced cervical cancer (in stageⅠB2、ⅡA2、ⅡB) under-went DCE-MRI and DWI one week before and 4 weeks after NACT. The patients were classified into two groups: significant reaction group (sCR include CR and PR) and non-sCR(include PD and SD) group according to the Response Evaluation Criteria in Solid Tumors (RECIST). The DCE-MRI pharmacokinetics parameters (mean Ktrans, mean Kep, mean Ve, mean Vp) and ADC value(mean ADC, Minimum ADC)were measured and compared between the sCR and non sCR groups. Receiver operating characteristic (ROC) curves were constructed to describe the diagnostic accuracy of the significant parameters and their decision thresholds.Results
There were 22 and 16 patients in sCR and non sCR groups, respectively. Before NACT, the mean Ktrans was higher but the mean Ve was lower in sCR (0.875 ± 0.329 min-1, 0.661 ± 0.184 min-1) group than those in non sCR group (0.549 ± 0.314 min-1, 0.791 ± 0.117 min-1), and these differences were statistically significant (z = -3.134,p < 0.05;z = -2.129, p < 0.05, respectively). After NACT, the mean Ktrans (0.553 ± 0.347 min-1 versus 0.942 ± 0.508 min-1; z = -2.602, p < 0.05) and the changed value of Ktrans (△Ktrans = -0.322 ± 0.261 min-1 versus △Ktrans = 0.393 ± 0.415 min-1; F = 4.776,p < 0.05) were significantly lower in the sCR group compared with those in the non-sCR group. However the meanADC (1048.239 ± 139.899 mm2/s versus 947.050 ± 153.515 mm2/s; z = -2.099,p <0.05) and the changed value of meanADC (△meanADC = 76.627 ± 169.323 e-3mm2/s versus △meanADC = 28.271 ± 102.935 e-3mm2/s; F = 4.757, p < 0.05) between the two groups were just higher in the sCR group compared with those in the non-sCR group. The remained parameters such as Vp and Kep had no statistically difference between the two groups. When combined the parameters values before and aftertreatment by using ROC curves, the area under curve (AUC) of pre-mean Ktrans, △Ktrans and pre-mean Ktrans combined with post meanADC were 0.801(P < 0.05),0.955(P < 0.001)and 0.878(P < 0.05). The optimal cut off value for distinguishing sCR from non sCR were the pretreatment Ktrans (0.7020 min-1) and △Ktrans ( 0.0437 min-1), and their sensitivity and specificity were 77.3 %, 81.2 %, 95.5 % and 81.2 %respectively.Conclusion
Quantitative parameters of DCE-MRI and ADC provided a new noninvasive way to reflect the changes of hemodynamics and water molecular diffusion in cervical cancer patients with NACT. The quantitative parameters, such as pre-mean Ktrans ,△Ktrans and pre-mean Ktrans combined with post meanADC, could predict the treatment efficacy more precisely. However, the quantitative DCE-MRI combined with DWI could not improve the prognostic efficacy significantly.Acknowledgements
Thank you for the contribution of all cervical cancer patients involved in this study.
Thank you of Third Affiliated Hospital of Kunming Medical University for the support to this project.
References
There is no relevant references in the abstract, which only appeared in the paper. So there is no specific reference to the literature.Figures
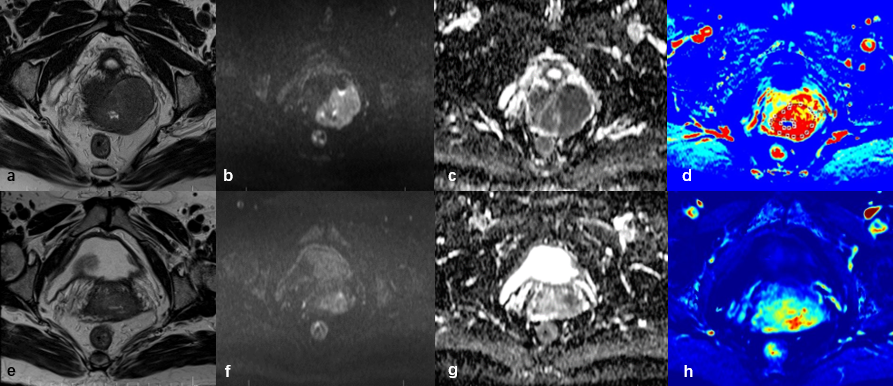
Fig
1 Typical imaging for a patient with sCR (PR) response to NACT. (A-D)
pretreatment tumor: T2WI, DWI, ADC and DCE-MRI Ktransmap; (E-H) after 4 weeks of NACT: T2WI,DWI,ADC,DCE-MRI
KtransMap. After NACT, the tumor size and the Ktrans
value decreased and the ADC value increased, Significantly.
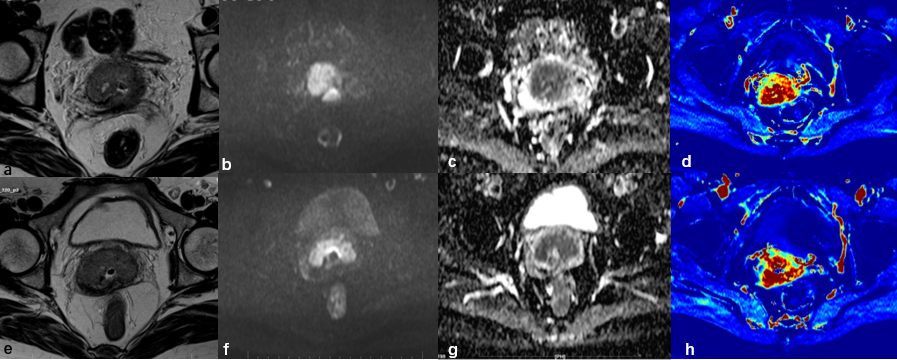
Fig 2
Typical imaging for a patient with non sCR (SD) response to NACT. (A-D)
pretreatment tumor: T2WI, DWI, ADC and DCE-MRI Ktransmap; (E-H) after 4 weeks of NACT: T2WI , DWI ,ADC,DCE-MRI and KtransMap. After NACT, the tumor size and the
Ktrans value decreased, and the ADC value increased, Slightly.