5255
Macrovascular contributions to high-resolution balanced SSFP- and GE-EPI-based fMRI at 9.4T evaluated using surface-based cortical depth analyses in human visual cortex1Athinoula A. Martinos Center for Biomedical Imaging, Massachusetts General Hospital, Charlestown, MA, United States, 2Department of Radiology, Harvard Medical School, Boston, MA, United States, 3Harvard-MIT Division of Health Sciences and Technology, Massachusetts Institute of Technology, Cambridge, MA, United States, 4Centre for Integrative Neuroscience, University of Tübingen, Tübingen, Germany, 5Department of Psychology, University of Tübingen, Tübingen, Germany, 6Department of Physiology of Cognitive Processes, Max Planck Institute for Biological Cybernetics, Tübingen, Germany, 7High-Field MR Center, Max Planck Institute for Biological Cybernetics, Tübingen, Germany, 8Department for Biomedical Magnetic Resonance, University of Tübingen, Tübingen, Germany
Synopsis
Several strategies have been proposed for maximizing neuronal specificity of fMRI by utilizing pulse sequences that are primarily sensitive to signal changes within microvasculature. Here we compare the microvascular sensitivity of high-resolution balanced SSFP and gradient-echo EPI at 9.4T using cortical depth analyses within human visual cortex. Because of the large draining vessels lying along the pial surface, the behavior of fMRI signals as a function of cortical depth can provide helpful insights into the vascular contributions. Our preliminary analyses suggest that, for the protocols used here, both balanced SSFP and EPI show similar cortical depth profiles of BOLD responses.
Introduction
A common strategy for improving the neuronal specificity of BOLD fMRI is to employ pulse sequences that are primarily sensitive to activation within the parenchymal microvasculature. Pure T2-weighted fMRI is well-known to be insensitive to extravascular BOLD signal changes around large vessels[1,2], and the short T2 values of blood at high fields reduce intravascular BOLD signal contributions[3–5], making spin-echo techniques at ultra-high field strengths attractive for high-resolution fMRI[6,7]. For this reason, several acquisition techniques have been suggested to take advantage of this improved neuronal specificity[8–10]. Balanced Steady-State Free Precession (bSSFP) acquisitions can be made to be sensitive to BOLD signal changes[11–13] and have been shown to provide signal refocusing characteristics that make the sequence T2 weighted[14–16]. Here we sought to test empirically whether high-resolution bSSFP-based fMRI provided the expected microvascular weighting by measuring BOLD responses across cortical depths.Methods
Five healthy adult volunteers (3F, 24.2±2.5 y.o.) participated after providing informed consent. All subjects were scanned on a 9.4T human whole-body scanner (Siemens Healthineers, Erlangen, Germany) equipped with SC72 body gradients and using a custom-built 31-channel receive coil array and an 16-channel transmit coil array (operated in birdcage mode)[17]. Anatomical data were acquired using MP2RAGE[18] customized for 9.4T[19] using a 0.6 mm iso. protocol (TR/TE/TI1/TI2/fa1/fa2/BW/pF/matrix=6000 ms/3 ms/800 ms/2000 ms/5°/9°/410 Hz/pix/0.75/352×352×288) with R=2×2 (CAIPI-shift 1) and offline MATLAB reconstruction. Functional data were acquired using 3D passband bSSFP adapted to 9.4T[20] using an 0.8 mm iso. protocol (TR/fa/BW/pF/matrix=3.8 ms/12°/990 Hz/pix/0.625/230×230×18) with R=3, yielding a volume repetition time of 2.727 s and 59 measurements per run. For comparison, single-shot gradient-echo EPI data were acquired using an 0.8 mm iso. protocol (TR/TE/fa/BW/esp/pF/matrix=2 s/22 ms/80°/1144 Hz/pix/1 ms/0.75/230×230×40) with R=5, FLEET autocalibration[21] and 80 measurements per run. In three subjects, an additional run of resting-state data was acquired with each sequence for time-series SNR analysis. Visual stimulation was previously described[22] but with a “+”-shape pattern and a 15-s on/25-s off block design presentation. Cortical surface reconstructions were generated automatically using the submillimeter stream of FreeSurfer[23] with minor adaptations to the 9.4T data. fMRI data were analyzed with FSL feat, and registered to the anatomical data using boundary-based registration as implemented in FreeSurfer bbregister. Cortical depth-dependent surface-based fMRI analyses were performed as described previously[22,24].Results
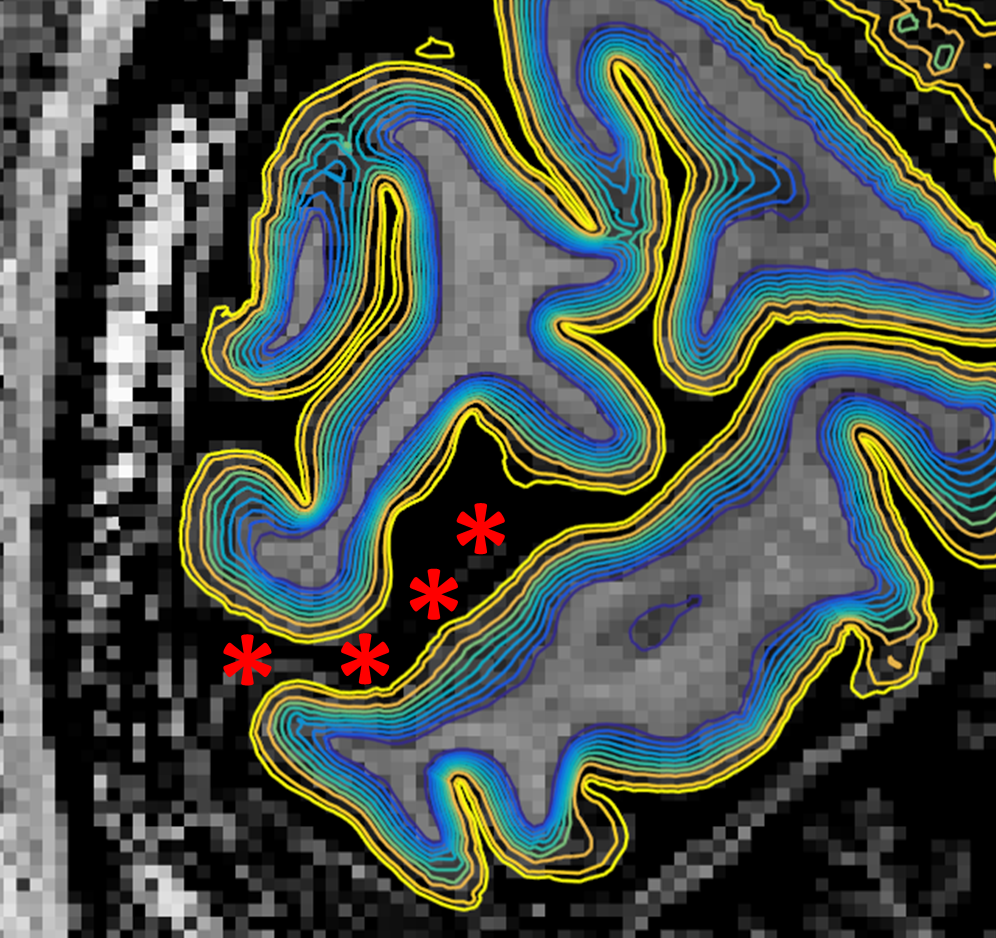
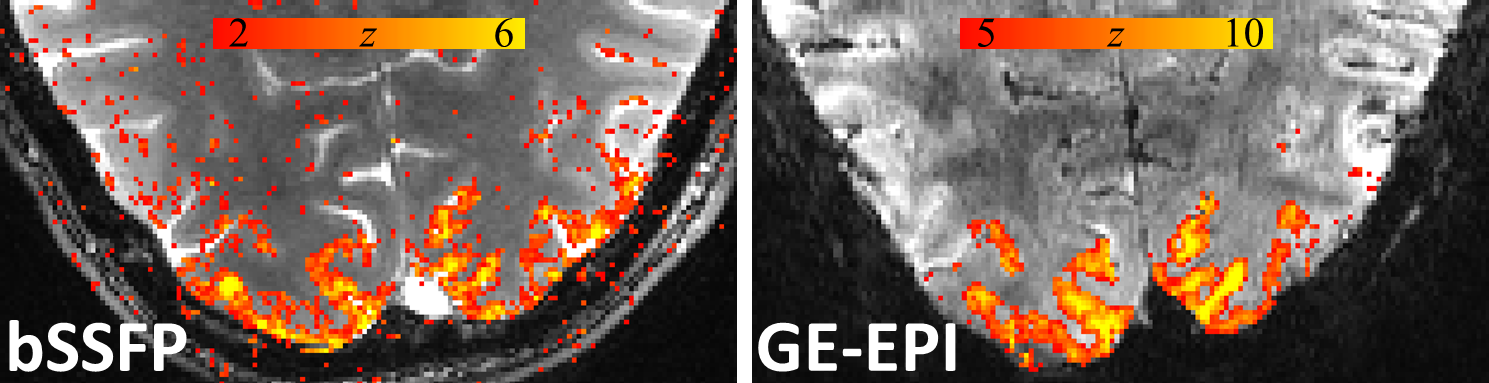
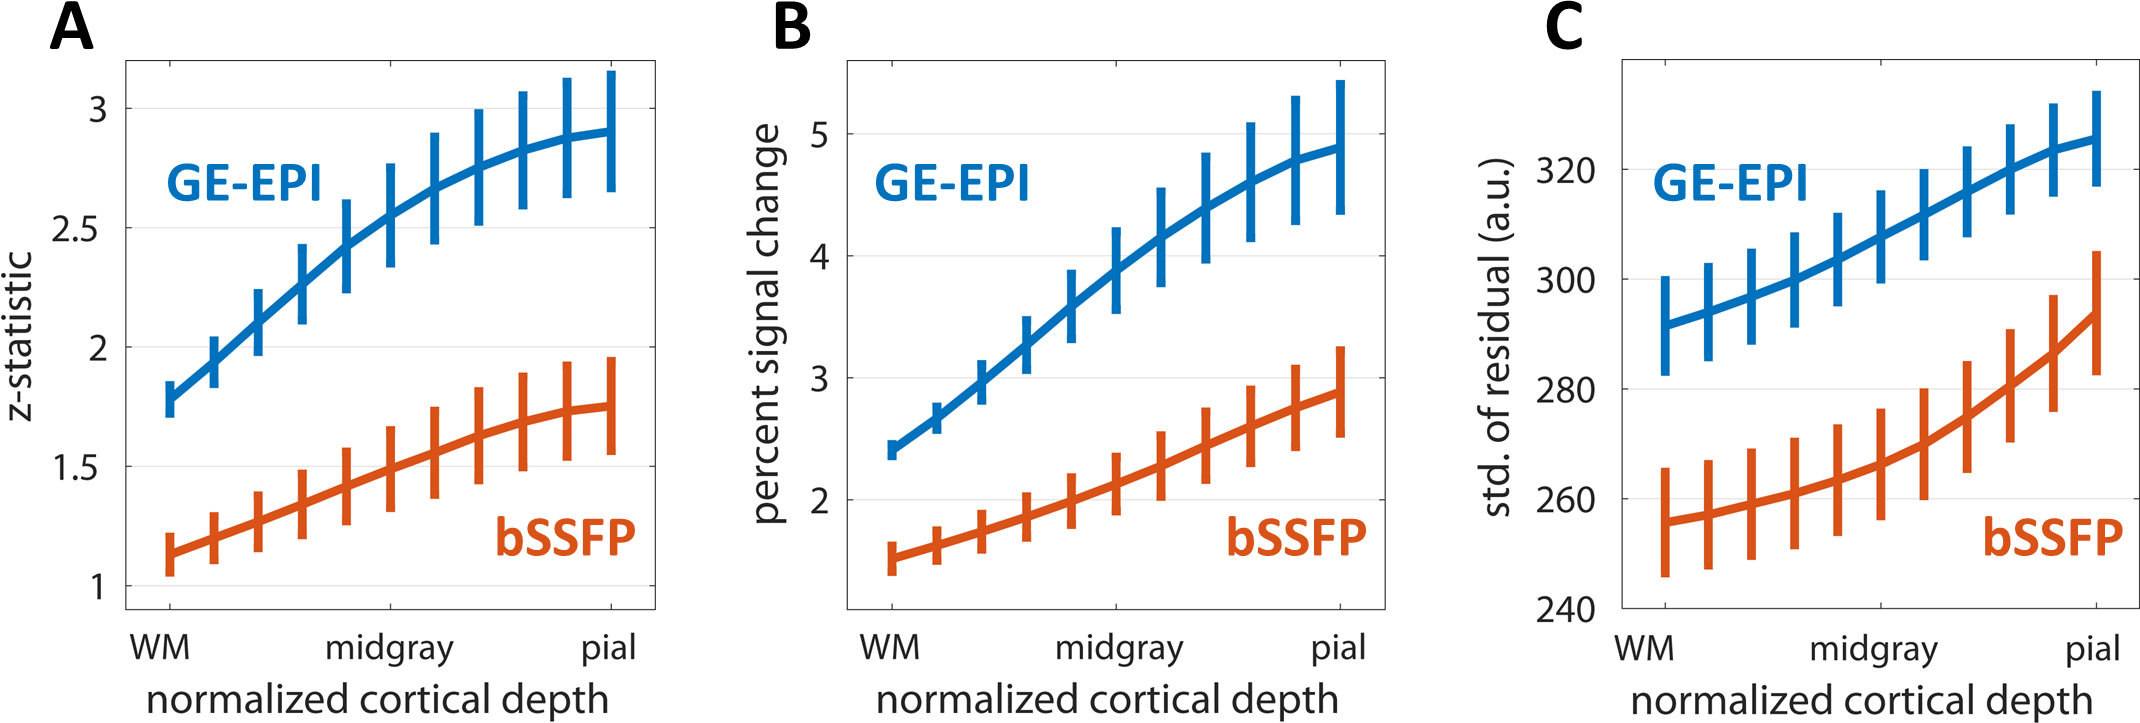
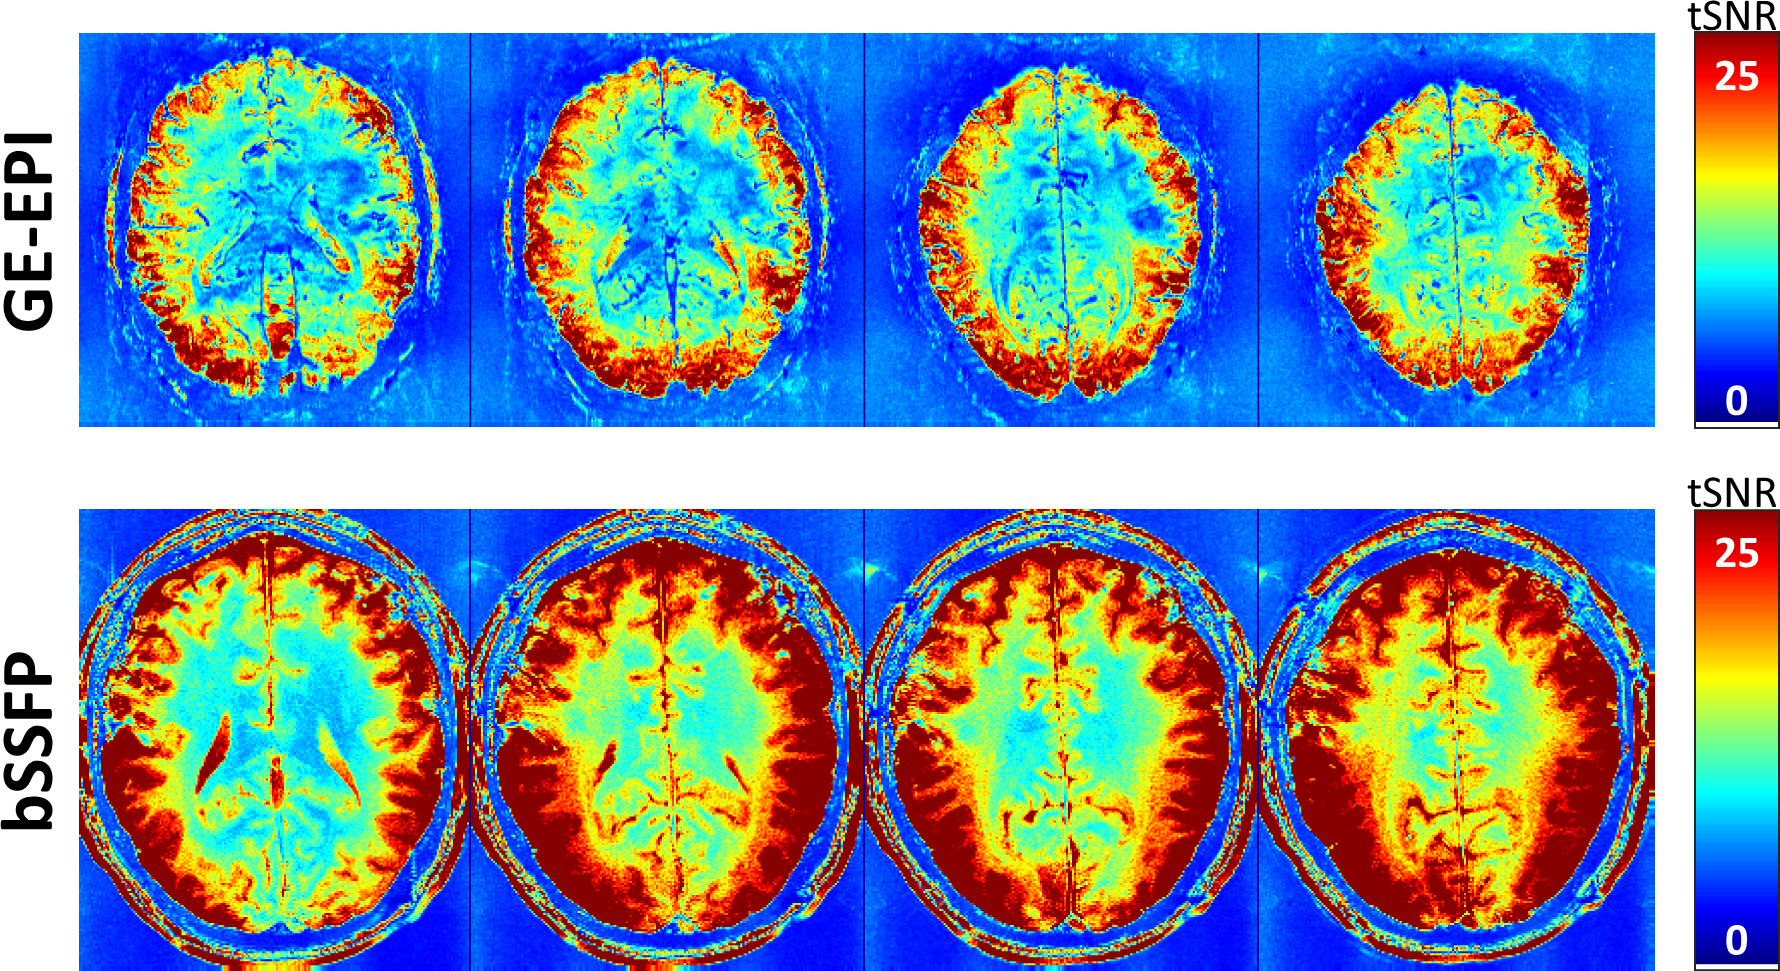
Figure 1 shows the family of 11 surfaces used for cortical depth analysis in the calcarine sulcus. Activation maps from one subject derived from the bSSFP- and GE-EPI-based BOLD responses to visual stimulation are presented in Fig. 2, where the statistical thresholds were set to include an approximately similar number of activated voxels in each map. Both acquisitions provided robust BOLD responses well-confined to the cortical gray matter. Fig. 3 shows the derived cortical depth profiles of the percent signal change, temporal variance of the residuals, and z-statistics from an ROI within the FreeSurfer prediction of area V1. In both the bSSFP and GE-EPI data, percent signal change, noise standard deviation, and statistical significance all increase monotonically as voxels approach the pial surface. The time-series SNR maps of the bSSFP and GE-EPI data, estimated from resting-state data, are presented in Fig. 4, showing increased tSNR in bSSFP—despite the improved functional z-statistics seen in the GE-EPI data. This suggests that the bSSFP data are sensitive to different aspects of the BOLD response relative to GE-EPI.Discussion
Previous simulation studies[15,25] have demonstrated that bSSFP-based BOLD fMRI is primarily sensitive to extravascular signals changes around small microvessels and capillaries due to the rapid refocusing of dephased magnetization by the alternating excitation pulses of the sequence. However, our preliminary cortical depth analyses do not show a large difference in sensitivity across the cortical depth between BOLD signals measured with bSSFP and GE-EPI. However it is expected that the specificity of bSSFP to different vessel sizes is determined in part by the sequence parameter TR that controls the rate of signal refocusing[26]. While the short TR of 3.8 ms used here was advantageous in terms of reducing banding artifacts and increasing the temporal resolution, it may lead to sensitivity to only extravascular signal changes around the smallest vessels. Since bSSFP with short TR values is capable of refocusing dephasing around small structures, it is possible that there can be a pronounced intravascular signal component due to a prolonged blood T2 for bSSFP acquisitions which could potentially give rise to strong BOLD signal changes within large intracortical or pial vessels, as has been suggested previously[27]. Future investigations will examine the effects of TR on the cortical depth profiles of BOLD signal changes in bSSFP fMRI.Acknowledgements
Supported by NIH NIBIB P41-EB015896 and R01-EB019437, NIMH R01-MH111419 (BRAIN Initiative), the Athinoula A. Martinos Center for Biomedical Imaging, the Max Planck Society, and made possible by NIH NCRR Shared Instrumentation Grants S10-RR023401, S10-RR023043 and S10-RR020948.References
1. Boxerman, J. L., Bandettini, P. A., Kwong, K. K., Baker, J. R., Davis, T. L., Rosen, B. R., & Weisskoff, R. M. (1995). The intravascular contribution to fMRI signal change: Monte Carlo modeling and diffusion-weighted studies in vivo. Magnetic Resonance in Medicine, 34(1), 4–10. PMID: 7674897
2. Ogawa, S., Menon, R., Tank, D., Kim, S., Merkle, H., Ellermann, J., & Ugurbil, K. (1993). Functional brain mapping by blood oxygenation level-dependent contrast magnetic resonance imaging. A comparison of signal characteristics with a biophysical model. Biophysical Journal, 64(3), 803–812.
3. Thulborn, K. R., Waterton, J. C., Matthews, P. M., & Radda, G. K. (1982). Oxygenation dependence of the transverse relaxation time of water protons in whole blood at high field. Biochimica et Biophysica Acta, 714(2), 265–70. PMID: 6275909
4. Ugurbil, K., Hu, X., Chen, W., Zhu, X. H., Kim, S. G., & Georgopoulos, A. (1999). Functional mapping in the human brain using high magnetic fields. Philosophical Transactions of the Royal Society of London. Series B, Biological Sciences, 354(1387), 1195–213. PMID: 10466146
5. Uludag, K., Müller-Bierl, B., & Ugurbil, K. (2009). An integrative model for neuronal activity-induced signal changes for gradient and spin echo functional imaging. NeuroImage, 48(1), 150–65. PMID: 19481163
6. Norris, D. G. (2012). Spin-echo fMRI: The poor relation? NeuroImage, 62(2), 1109–15. PMID: 22245351
7. Yacoub, E., Harel, N., & Ugurbil, K. (2008). High-field fMRI unveils orientation columns in humans. Proceedings of the National Academy of Sciences of the United States of America, 105(30), 10607–12. PMID: 18641121
8. Goense, J. B. M., & Logothetis, N. K. (2006). Laminar specificity in monkey V1 using high-resolution SE-fMRI. Magnetic Resonance Imaging, 24(4), 381–92. PMID: 16677944
9. Barth, M., Meyer, H., Kannengiesser, S. A. R., Polimeni, J. R., Wald, L. L., & Norris, D. G. (2010). T2-weighted 3D fMRI using S2-SSFP at 7 tesla. Magnetic Resonance in Medicine, 63(4), 1015–1020. PMID: 20373402
10. Feinberg, D., Harel, N., Ramanna, S., Ugurbil, K., & Yacoub, E. (2008). Sub-millimeter single-shot 3D GRASE with inner volume selection for T2-weighted fMRI applications at 7 Tesla. Proceedings of the International Society for Magnetic Resonance in Medicine, 16, 2373.
11. Scheffler, K., Seifritz, E., Bilecen, D., Venkatesan, R., Hennig, J., Deimling, M., & Haacke, E. M. (2001). Detection of BOLD changes by means of a frequency-sensitive trueFISP technique: Preliminary results. NMR in Biomedicine, 14(7–8), 490–496. PMID: 11746942
12. Bowen, C., Menon, R., & Gati, J. (2005). High field balanced-SSFP FMRI: a BOLD technique with excellent tissue sensitivity and superior large vessel suppression. Proc Intl Soc Mag Reson Med, 13, 119.
13. Miller, K. L., Hargreaves, B. A., Lee, J., Ress, D., deCharms, R. C., & Pauly, J. M. (2003). Functional brain imaging using a blood oxygenation sensitive steady state. Magnetic Resonance in Medicine, 50(4), 675–83. PMID: 14523951
14. Scheffler, K., & Hennig, J. (2003). Is TrueFISP a gradient-echo or a spin-echo sequence? Magnetic Resonance in Medicine, 49(2), 395–7. PMID: 12541263
15. Miller, K. L., Smith, S. M., Jezzard, P., Wiggins, G. C., & Wiggins, C. J. (2007). Signal and noise characteristics of SSFP FMRI: a comparison with GRE at multiple field strengths. NeuroImage, 37(4), 1227–36. PMID: 17706432
16. Kim, T. S., Lee, J., Lee, J. H., Glover, G. H., & Pauly, J. M. (2012). Analysis of the BOLD characteristics in pass-band bSSFP fMRI. International Journal of Imaging Systems and Technology, 22(1), 23–32.
17. Shajan, G., Kozlov, M., Hoffmann, J., Turner, R., Scheffler, K., & Pohmann, R. (2014). A 16-channel dual-row transmit array in combination with a 31-element receive array for human brain imaging at 9.4 T. Magnetic Resonance in Medicine, 71(2), 870–879.
18. Marques, J. P., Kober, T., Krueger, G., van der Zwaag, W., Van de Moortele, P.-F., & Gruetter, R. (2010). MP2RAGE, a self bias-field corrected sequence for improved segmentation and T1-mapping at high field. NeuroImage, 49(2), 1271–81.
19. Hagberg, G. E., Bause, J., Ethofer, T., Ehses, P., Dresler, T., Herbert, C., Pohmann, R., Shajan, G., Fallgatter, A., Pavlova, M. A., & Scheffler, K. (2016). Whole brain MP2RAGE-based mapping of the longitudinal relaxation time at 9.4T. NeuroImage. In press. PMID: 27663989
20. Scheffler, K., & Ehses, P. (2016). High-resolution mapping of neuronal activation with balanced SSFP at 9.4 tesla. Magnetic Resonance in Medicine, 76(1), 163–171. PMID: 26302451
21. Polimeni, J. R., Bhat, H., Witzel, T., Benner, T., Feiweier, T., Inati, S. J., Renvall, V., Heberlein, K., & Wald, L. L. (2016). Reducing sensitivity losses due to respiration and motion in accelerated echo planar imaging by reordering the autocalibration data acquisition. Magnetic Resonance in Medicine, 75(2), 665–79. PMID: 25809559
22. Polimeni, J. R., Fischl, B., Greve, D. N., & Wald, L. L. (2010). Laminar analysis of 7T BOLD using an imposed spatial activation pattern in human V1. NeuroImage, 52(4), 1334–46. PMID: 20460157
23. Zaretskaya, N., Fischl, B., Reuter, M., Renvall, V., & Polimeni, J. R. (2015). Characterization of cortical surface reconstruction for sub-millimeter 7T MPRAGE using FreeSurfer. 21st Annual Meeting of the Organization for Human Brain Mapping, 21, 4029.
24. Ahveninen, J., Chang, W.-T., Huang, S., Keil, B., Kopco, N., Rossi, S., Bonmassar, G., Witzel, T., & Polimeni, J. R. (2016). Intracortical depth analyses of frequency-sensitive regions of human auditory cortex using 7TfMRI. NeuroImage, 143, 116–127. PMID: 27608603
25. Bieri, O., & Scheffler, K. (2007). Effect of diffusion in inhomogeneous magnetic fields on balanced steady-state free precession. NMR in Biomedicine, 20(1), 1–10.
26. Scheffler, K., Kleinfeld, D., Tsai, P. S., Báez-Yánez, M. G., & Ehses, P. (2017). The neurovascular fingerprint of BOLD bSSFP: the impact of vessel size, orientation and intravascular contribution. Proc Intl Soc Mag Reson Med, submitted, Abstract ID: 3299.
27. Park, S.-H., Kim, T., Wang, P., & Kim, S.-G. (2011). Sensitivity and specificity of high-resolution balanced steady-state free precession fMRI at high field of 9.4T. NeuroImage, 58(1), 168–176.
Figures