5254
Spin echo and Gradient echo BOLD fMRI at ultrahigh magnetic field of 15.2TSoHyun Han1, JinYong Park1, Woochul Jeong1, and Seong-Gi Kim1,2
1Center for Neuroscience Imaging Research, Institute for Basic Science (IBS), Suwon, Korea, Republic of, 2Department of Biomedical Engineering, Sungkyunkwan University, Suwon, Korea, Republic of
Synopsis
In general, gradient-echo (GE) BOLD contains extravascular (EV) contributions from all sized vessels, while spin-echo (SE) BOLD is sensitive to microvessels. Based on simulation, the EV BOLD signal is dependent linearly on B0 for macrovessels, and quadratically on B0 for microvessels. Here, we performed GE and SE BOLD fMRI of α-chloralose anesthetized rats responding to forepaw stimulation on an ultrahigh magnetic field of 15.2T. Stimulation-induced R2 change was quadratically on B0, indicating that microvessel contributions are dominant. SE BOLD at ultrahigh fields can detect precise activation sites and can be used for high-resolution fMRI to detect fine functional structures.
Purpose
Signal source of blood oxygen level-dependent (BOLD) functional magnetic resonance imaging (fMRI) is complex and dependent on pulse sequence and magnetic field strength1-2. At high magnetic fields, blood T2 is much shorter than that of extravascular (EV) tissue, resulting in dominant extravascular contributions. Commonly used gradient-echo (GE) BOLD contains EV contributions from all sized vessels, while spin-echo (SE) BOLD is sensitive to microvessels. Based on simulation1-2, the EV BOLD signal is dependent linearly on B0 for macrovessels, and quadratically on B0 for microvessels. It is often assumed that relative contribution of microvessels to BOLD increases with magnetic field strength. Here we performed GE and SE BOLD fMRI of α-chloralose anesthetized rats responding to forepaw stimulation on an ultrahigh magnetic field of 15.2 T. In order to obtain field-dependent EV BOLD responses, our data were compared with previously reported 9.4 T values under the same experimental conditions3-4.Methods
All MR experiments were performed on 15.2 T MRI system (Bruker BioSpin, Billerica, MA, Paravision 6) with a 11 cm bore size and 25 mm surface coil. A total of 7 male Sprague-Dawley rats (250-310 g, 7 weeks of age) were used with approval from the Institutional Animal Care and Use Committee of Sungkyunkwan University. All experimental procedures including animal preparations, stimulation and data processing followed ref [3-4]. Intubation was performed for mechanical ventilation and catheters were inserted into the femoral artery and vein for monitoring blood pressure and delivering α-chloralose (80 mg/kg was administered by bolus injection followed by 40 mg/kg/90min). Stimulation parameters were a current of 1.5 mA, a pulse duration of 300 μs, and a repetition rate of 3 Hz with a paradigm consisting of a 40 s resting period, followed by a 20 s of forepaw stimulation and 40 s of rest. A double SE version of EPI sequence with adiabatic pulses5 was used to obtain SE images with a surface coil at four different TEs ranging from 20 ms to 50 ms, while standard single-shot EPI was used for GE fMRI with TE of 15 ms. MR parameters were as follows: TR = 2 s, matrix size of 64 × 32, and field of view (FOV) of 3.0 × 1.5 cm2. Functional maps were calculated and quantitative analysis was performed from the nine-pixel rectangular somatosensory ROI centered the pixel with the highest cross-correlation coefficient (CCC).Results
Fig. 1. shows the CCC maps overlaid on baseline SE EPI images obtained at TE of 20, 30 and 40 ms. High-quality EPI images were obtained at 15.2 T, and robust activation was observed at contralateral forelimb area. Highest statistical significance and most number of active pixels were observed at TE of 30 ms. To compare SE fMRI of 15.2 T vs. 9.4 T, experimental 15.2 T data (red stars in Fig. 2) were plotted with reported 9.4 T data (blue circles from ref [3]). The best fitted function is: BOLD (%) = 357.78 × TE + 0.70 for 15.2 T and BOLD (%) = 133.48 × TE + 0.85 for 9.4 T. The ratio of stimulation-induced R2 changes (3.58 s-1 for 15.2 T vs. 1.33 s-1 for 9.4 T) is 2.69. Gradient-echo BOLD signal change with TE of 15 ms was 8.00 ± 0.52 (n = 7) for 15.2 T, while GE BOLD was 3.7% with TE of 10 ms at 9.4 T4. Assuming no intravascular (IV) component, a change of R2* was calculated. A ratio of R2* change (5.3 s-1 for 15.2 T vs. 3.7 s-1 for 9.4 T) is 1.43.Discussion and conclusion
Generally, the maximum contrast-to-noise ratio (CNR) is obtained when TE sets to T2 or T2* of tissue4. Since the T2 value of brain tissue is estimated as 29.2 ms at 15.2T in ref [2], our SE fMRI data (Fig. 1) shows the optimal TE is around 30 ms. Stimulation-induced R2 change is quadratically on B0, indicating that microvessel contributions are dominant. In GE fMRI, it is expected that B0-dependency is more than linear, but less than quadratic. However, it is close to linear in our measurement, suggesting that macrovessel contributions are dominant. This can be due to non-BOLD contribution such as inflow effects and differential IV contributions. Additionally, experiments are needed with multiple TE values. The SE BOLD signal change is quadratically related to B0, suggesting that the microvascular component is dominant BOLD signal source at 15.2 T. Thus, SE BOLD at ultrahigh fields can detect precise activation sites and can be used for high-resolution fMRI to detect fine functional structures including laminar processing.Acknowledgements
This work was supported by IBS-R015-D1.References
[1] Ogawa S, Menon RS, Tank DW, Kim S-G, Merkle H, Ellermann JM, Ugurbil K. Functional brain mapping by blood oxygenation level dependent contrast magnetic resonance imaging. Biophys J 1993;64:800-812 [2] Uludag K, Muller-Bierl B, Ugurbil K. An integrative model for neuronal activity-induced signal changes for gradient and spin echo functional imaging. Neuroimage 2009;48:150-165. [3] Lee S-P, Silva AC, Ugurbil K, Kim S-G. Diffusion-weighted spin-echo fMRI at 9.4T: microvascular/tissue contribution to BOLD signal change. Magn Reson Med 1999;42:919-928. [4] Silva AC, Lee S-P, Yang G, ladecola C. Simultaneous blood oxygenation level-dependent and cerebral blood flow functional magnetic resonance imaging during forepaw stimulation in the rat. J Cereb Blood Flow Metab 1999;19:871:879.Figures
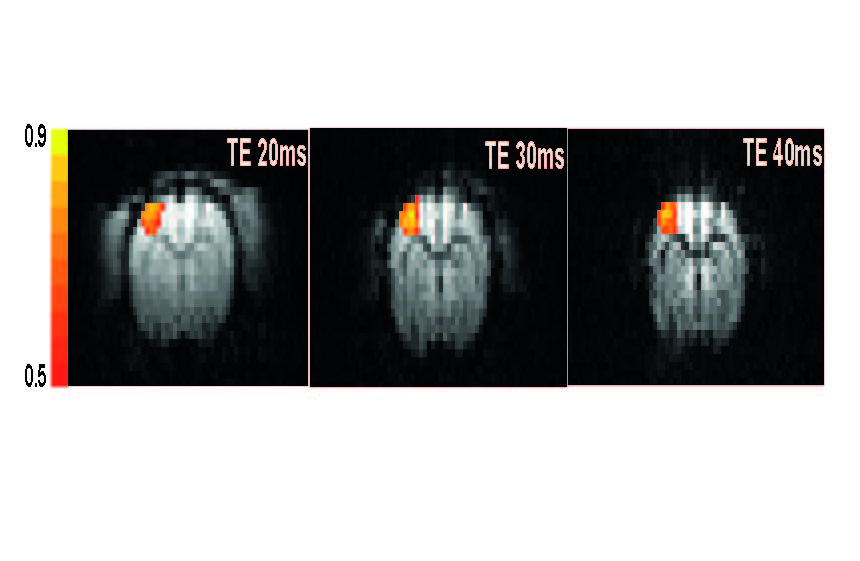
TE
dependence of the SE fMRI. CCC maps overlaid on baseline SE EPI images at TE of
20, 30, and 40 ms. Color bar represents the cross-correlation values from 0.5
to 0.9 (yellow > 0.9; red CCC < 0.5)
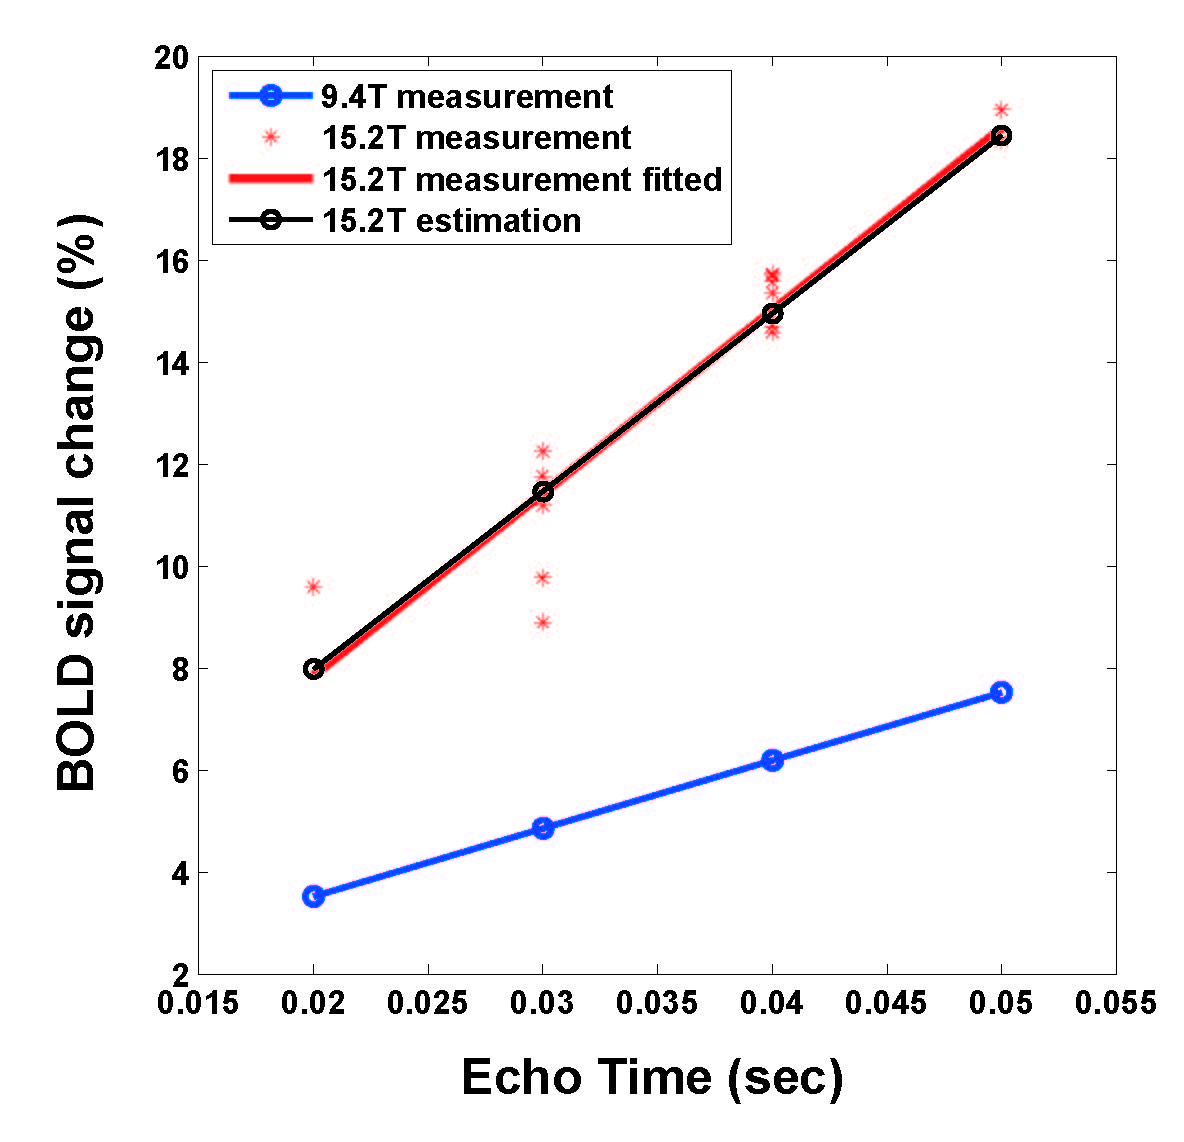
Plots
of SE BOLD signal corresponding to variable TE. Blue circles represent experimental
9.4T data from ref [3]. Red stars and solid line are experimental 15.2T data
and fitted plot, respectively. Black circles are estimated values from 9.4T
data (blue circles) with the assumption that R2 change is quadratic with B0