5253
Arterial Spin Labeling fMRI in White Matter at 7 Tesla1CIBM, EPFL, Lausanne, Switzerland
Synopsis
To date, the White Matter (WM) tracts functionality is never directly assessed using fMRI, but only inferred indirectly via healthy/impaired cortical connectivity. In this study, we use Arterial Spin Labeling (ASL), a non-invasive, quantitative, reproducible fMRI technique, to investigate WM Cerebral Blood Flow (CBF) dynamics at high field. We first show that WM CBF can be measured using standard 2D-EPI-PASL at 7T; and quantify CBF changes in GM and WM during finger-tapping. While the BOLD signal was only found elevated in GM, a net CBF increase was observed in GM and contralateral (but not ipsilateral) WM during the task (+77/25%).
PURPOSE:
To date, the White Matter (WM) tracts functionality has never been directly assessed using fMRI, but only inferred indirectly via healthy/impaired cortical connectivity. WM BOLD fMRI (1–3) remain controversial and had very limited impact on the fMRI community, due to low sensitivity (lesser blood flow compared to gray matter (GM) (4)) and poorly understood mechanisms. Here, we use Arterial Spin Labeling (ASL), a non-invasive, quantitative, reproducible fMRI technique (5,6), to investigate Cerebral Blood Flow (CBF) dynamics in WM at high field. The WM CBF was recently measured in short times using optimal sampling strategy ASL at 7T (7) and pcASL at 3T (8). Here we extend this claim to standard 2D-EPI PASL at 7T before quantifying CBF changes in GM and WM during finger-tapping.METHODS:
Experiments were performed on a 7T head-only Siemens MR scanner and 32 ch. array receiver coil (Nova). ASL data was acquired with a FAIR-QUIPSSII (9,10) 2D-EPI sequence and recommended parameters (11): TR/TE=3000/17ms, BW=2004 Hz/pix, FOV=192x192, matrix 64x64 (res. 3x3mm), 5mm thickness (6 slices), TI1/TI2=700/1800ms. 125 {control/tag} pairs were recorded per session (acquisition time 12min33s). CBF maps were calculated based on simple kinetics modeling and PASL scheme (12,13) using T1,blood=2170ms (14) and T2* (tissue/blood) = 25/12ms (15).
Voxel-wise perfusion-weighted measurements in GM/WM (n=4 volunteers) were compared to the noise distribution using one-tailed student t-tests as in (7,8) to determine whether WM CBF could be measured using our protocol. The finger-tapping task consisted in 12 blocks of [30s ON/OFF] (left-hand, 1 Hz). ASL fMRI data was acquired once (n=1) or twice (n=5) in right-handed healthy volunteers (total: 11 runs). ASL data were motion-corrected, smoothed (FWHM=3mm) and processed using spm12 (16) to extract the 10 most activated GM voxels (GM10) based on perfusion-weighted images generated after control/tag signal interpolation at each TR.
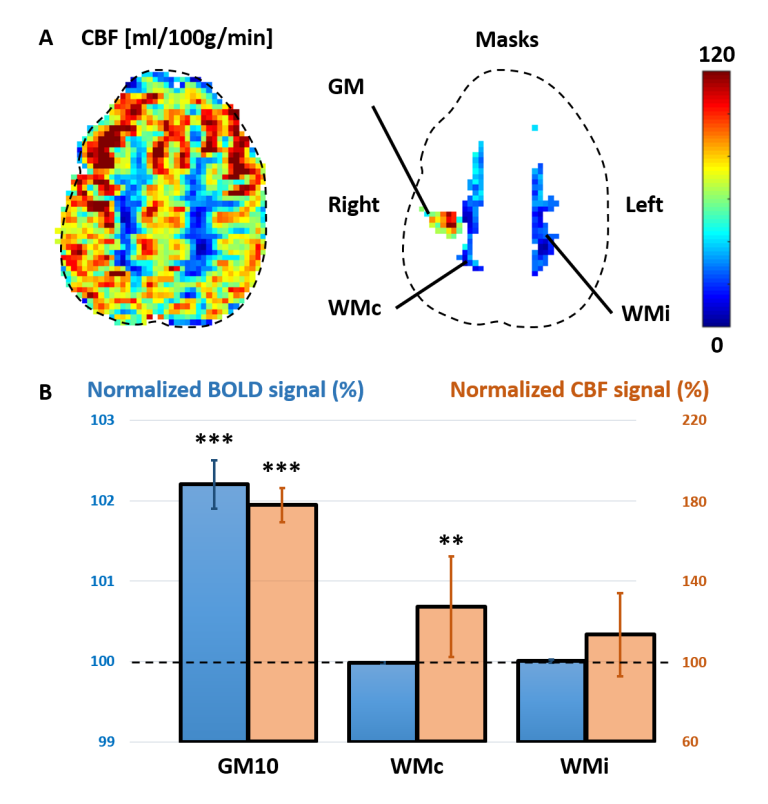
Two ROIs were drawn in contralateral/ipsilateral WM (WMc/WMi) in the Corona Radiata below the motor cortex. CBF and BOLD signals were extracted from the raw ASL signal (motion-corrected, unsmoothed) and averaged over all blocks. The BOLD and CBF increase in GM10, WMc and WMi were tested for statistical significance (one-tailed paired t-tests, 2 metrics, 3 ROIs; Bonferroni threshold p=0.05/6=0.008).
RESULTS:
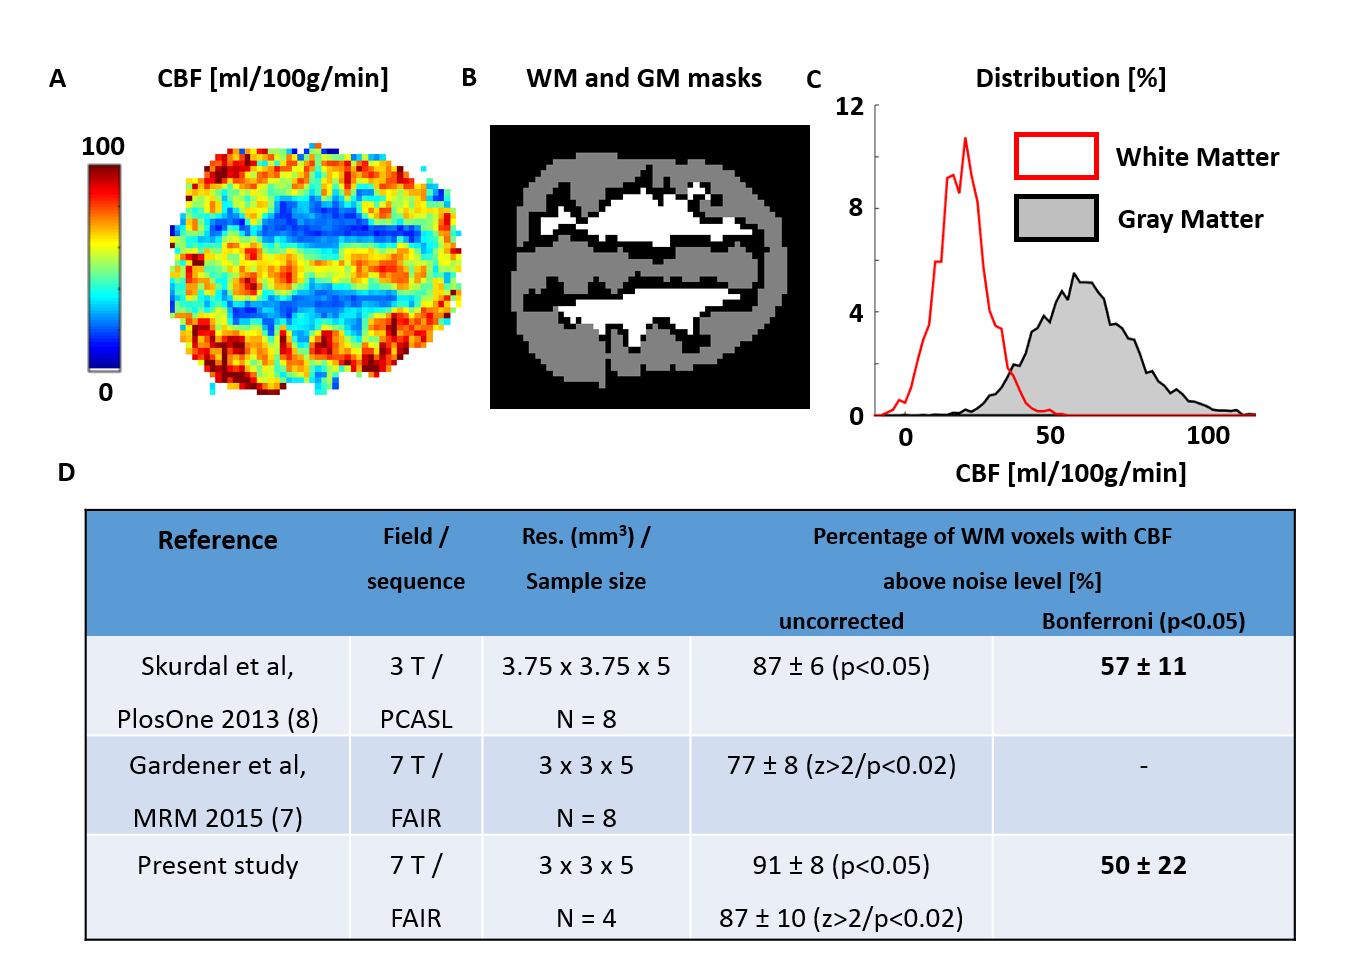
Representative CBF maps, WM/GM masks and distributions are illustrated in Fig.1A-C. Most WM voxels presented measurable CBF based on uncorrected p-values/Z-scores (Fig.1D). Results after Bonferroni correction leveled with (8), despite their higher SNR (pcASL, larger voxel size).
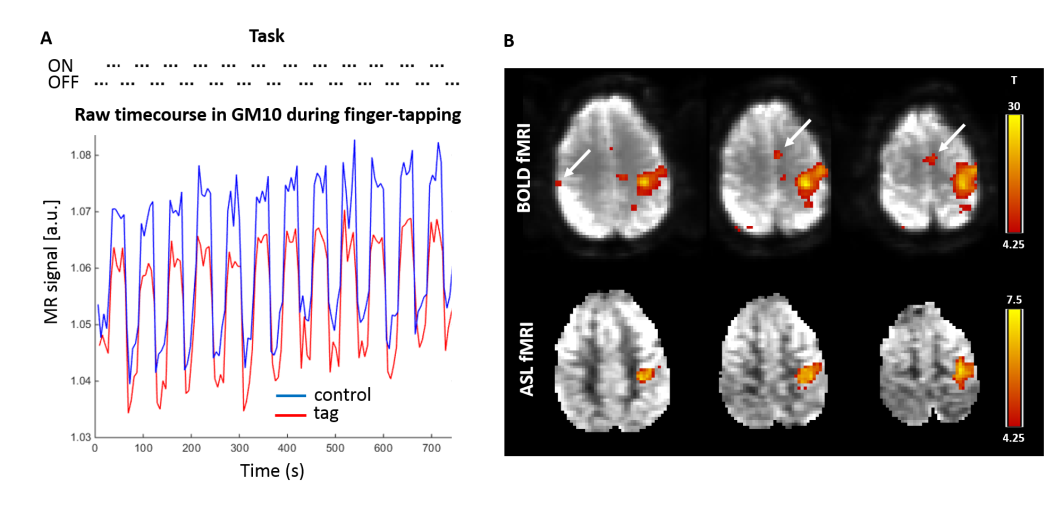
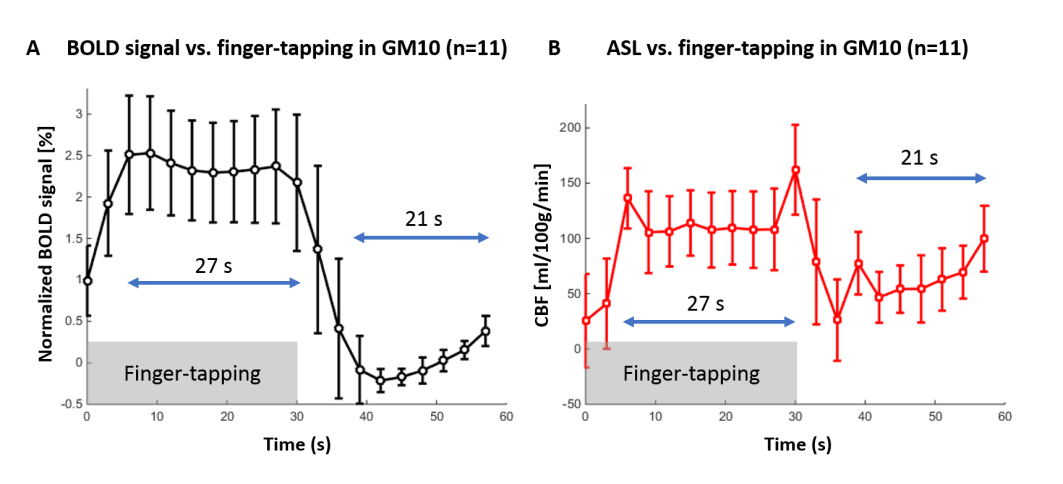
The finger-tapping task elicited a robust cerebral response (Fig.2A) in BOLD and perfusion-weighted contrast in the motor cortex (Fig.2B-C, single-subject, FWE p=0.05 threshold). Based on the CBF and BOLD signal in GM10 (Fig.3, n=11 runs), the last 27/21s of stimulation/rest period were averaged to quantify CBF in GM10, WMc and WMi.
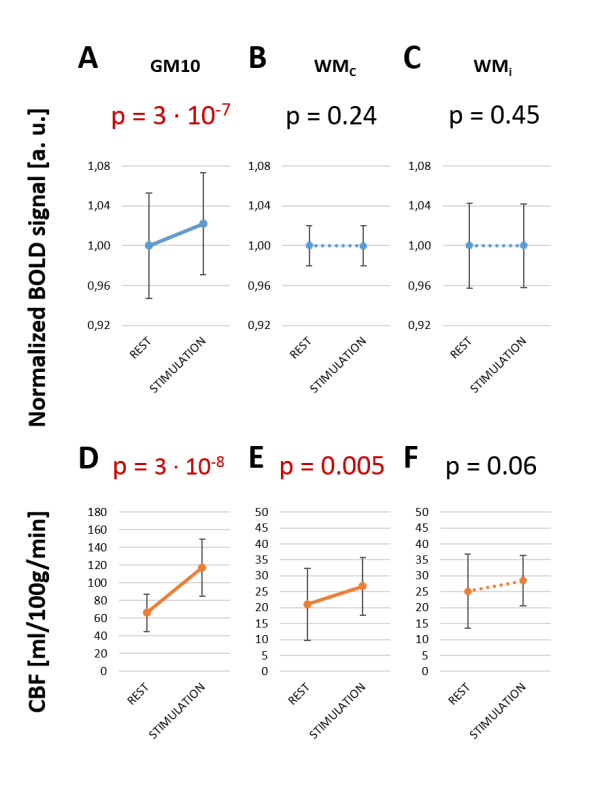
During stimulation, BOLD and CBF increased in GM10 (Fig.4A-D, p=3.10-7/3.10-8), and CBF increased in WMc (Fig.4E, p=0.005). No increase was found for BOLD in WMc/WMi (p>0.2), nor for CBF in WMi (p>0.008). CBF changes in WMc and GM10 masks (Fig.5A) during stimulation were respectively +27±25% and +77±8% (Fig.5B).
DISCUSSION:
CBF could be quantified in most of WM using 2D-EPI ASL sequence at 7 Tesla in 12min. A net CBF increase was measured in contralateral WM and GM regions during finger-tapping. Some ipsilateral cortical regions exhibited a small positive BOLD response (although below the FWE threshold) making ipsilateral WM regions imperfect controls for ASL fMRI.
Although WM activation has been previously reported in the internal capsule (IC) during finger-tapping (2,3), we did not observe BOLD changes in WM (that could not be explained by partial-volume effects), potentially due to the lower CBF increase in WM versus GM. Our CBF results are consistent with signals following the corticospinal tract that originates in the primary motor cortex, passes through the Corona Radiata, IC, pons, pyramids, before dividing into the anterior/lateral corticospinal tracts connected to the proximal/distal muscles.
We demonstrate that quantitative fMRI can be performed in WM. Due to low SNR, longer fMRI paradigms and/or further sequence improvements are needed at high field – such as background suppression (17) / optimized inversion pulses (18,19) - before considering single-voxel analysis. Further analyses shall include increased brain coverage and refined sub-sections of the Corona Radiata. Combining diffusion, BOLD, VASO and ASL fMRI (20) and reproducing results in WM tracts involved in other cognitive processes is also of prime importance to better understand the mechanisms at play.
CONCLUSION:
Quantitative WM fMRI hast the potential to improve our understanding of fMRI mechanisms in various brain tissues, bridge the existing gap between structural and functional connectivity; as well as better characterizing neurodegenerative, inflammatory or vascular diseases that affect WM.Acknowledgements
This work was supported by the Centre d'Imagerie Biomédicale (CIBM) of the University of Lausanne (UNIL), the Swiss Federal Institute of Technology Lausanne (EPFL), the University of Geneva (UniGe), the Centre Hospitalier Universitaire Vaudois (CHUV), the Hôpitaux Universitaires de Genève (HUG) and the Leenaards-Jeantet Foundations.References
1. Gawryluk JR, Mazerolle EL, D’Arcy RCN. Does functional MRI detect activation in white matter? A review of emerging evidence, issues, and future directions. Front. Neurosci. 2014. doi: 10.3389/fnins.2014.00239.
2. Gawryluk JR, Mazerolle EL, Brewer KD, Beyea SD, D’Arcy RCN. Investigation of fMRI activation in the internal capsule. BMC Neurosci. 2011;12:56. doi: 10.1186/1471-2202-12-56.
3. Mazerolle EL, Beyea SD, Gawryluk JR, Brewer KD, Bowen C V, D’Arcy RC. White matter fMRI activation in the internal capsule?: Co-localization with DTI tractography. Neuroimage 2010;50:616–621.
4. Helenius J, Perkiö J, Soinne L, Østergaard L, Carano R a D, Salonen O, Savolainen S, Kaste M, Aronen HJ, Tatlisumak T. Cerebral hemodynamics in a healthy population measured by dynamic susceptibility contrast MR imaging. Acta radiol. 2003;44:538–546. doi: 10.1080/j.1600-0455.2003.00104.x.
5. Williams DS, Detre JA, Leigh JS, Koretsky AP. Magnetic resonance imaging of perfusion using spin inversion of arterial water. Proc. Natl. Acad. Sci. U. S. A. 1992;89:212–6. doi: 10.1073/pnas.89.9.4220e.
6. Detre J a, Wang J, Wang Z, Rao H. Arterial spin-labeled perfusion MRI in basic and clinical neuroscience. 2009. doi: 10.1097/WCO.0b013e32832d9505.
7. Gardener AG, Jezzard P. Investigating white matter perfusion using optimal sampling strategy arterial spin labeling at 7 Tesla. Magn Reson Med 2014;00:0–5. doi: 10.1002/mrm.25333.
8. Skurdal MJ, Bjornerud A, Van Osch MJP, Nordhoy W, Lagopoulos J, Groote IR. Voxel-Wise Perfusion Assessment in Cerebral White Matter with PCASL at 3T; Is It Possible and How Long Does It Take? PLoS One 2015;10:e0135596.
9. Kim SG. Quantification of Relative Cerebral Blood-Flow Change by Flow-Sensitive Alternating Inversion-Recovery (FAIR) Technique - Application to Functional Mapping. Magn. Reson. Med. 1995;34:293–301. doi: DOI 10.1002/mrm.1910340303.
10. Wong EC, Buxton RB, Frank LR. Quantitative imaging of perfusion using a single subtraction (QUIPSS and QUIPSS II). Magn. Reson. Med. 1998;39:702–708. doi: 10.1002/mrm.1910390506.
11. Alsop DC, Detre JA, Golay X, et al. Recommended implementation of arterial spin-labeled Perfusion mri for clinical applications: A consensus of the ISMRM Perfusion Study group and the European consortium for ASL in dementia. Magn. Reson. Med. 2015;73:102–116. doi: 10.1002/mrm.25197.
12. Buxton RB, Frank LR, Wong EC, Siewert B, Warach S, Edelman RR. A general kinetic model for quantitative perfusion imaging with arterial spin labeling. Magn. Reson. Med. 1998;40:383–396. doi: 10.1002/mrm.1910400308.
13. Çavusoglu M, Pfeuffer J, Ugurbil K, Uludag K. Comparison of pulsed arterial spin labeling encoding schemes and absolute perfusion quantification. Magn. Reson. Imaging 2009;27:1039–1045. doi: 10.1016/j.mri.2009.04.002.
14. Grgac K, Van Zijl PCM, Qin Q. Hematocrit and oxygenation dependence of blood 1H2O T1 at 7 tesla. Magn. Reson. Med. 2013;70:1153–1159. doi: 10.1002/mrm.24547.
15. Yacoub E, Shmuel a, Pfeuffer J, Van De Moortele PF, Adriany G, Andersen P, Vaughan JT, Merkle H, Ugurbil K, Hu X. Imaging brain function in humans at 7 Tesla. Magn. Reson. Med. 2001;45:588–94. doi: 10.1002/mrm.1080.
16. Friston KJ, Holmes a. P, Worsley KJ, Poline J-P, Frith CD, Frackowiak RSJ. Statistical parametric maps in functional imaging: A general linear approach. Hum. Brain Mapp. 1995;2:189–210. doi: 10.1002/hbm.460020402.
17. Ye FQ, Frank JA, Weinberger DR, McLaughlin AC. Noise reduction in 3D perfusion imaging by attenuating the static signal in arterial spin tagging (ASSIST). Magn. Reson. Med. 2000;44:92–100. doi: 10.1002/1522-2594(200007)44:1<92::AID-MRM14>3.0.CO;2-M.
18. Hurley AC, Al-Radaideh A, Bai L, Aickelin U, Coxon R, Glover P, Gowland PA. Tailored RF pulse for magnetization inversion at ultrahigh field. Magn. Reson. Med. 2010;63:51–58. doi: 10.1002/mrm.22167.
19. Warnking JM, Pike GB. Bandwidth-modulated adiabatic RF pulses for uniform selective saturation and inversion. Magn. Reson. Med. 2004;52:1190–1199. doi: 10.1002/mrm.20262.
20. Yang Y, Gu H, Stein EA. Simultaneous MRI acquisition of blood volume, blood flow, and blood oxygenation information during brain activation. Magn. Reson. Med. 2004;52:1407–1417. doi: 10.1002/mrm.20302.
Figures