5252
MR microscopy of Aplysia californica at 17.2T suggests that the diffusion fMRI signal originates from neural swelling1NeuroSpin, CEA, Gif-sur-Yvette, France
Synopsis
Diffusion fMRI (DfMRI) allows to monitor brain function without BOLD vascular confounding effects. To elucidate the origin of the DfMRI response we performed DfMRI experiments at single neuron and ganglia level upon dopamine stimulation of Aplysia californica buccal ganglia using 17.2T MR microscopy. Neural swelling, evidenced from optical microscopy, resulted in an intracellular ADC increase reflecting cytoplasm dilution and an ADC decrease at ganglia level. While the mechanism of this ADC decrease remains putative these results are consistent with the hypothesis that the ADC decrease observed with DfMRI upon neuronal activation at tissue level reflects activation induced cell swelling.
Purpose
Diffusion fMRI (DfMRI) has been shown to closely reflect neural activity1 without BOLD confounding hemodynamic effects2, as DfMRI signals are not of vascular origin3. Instead, one putative mechanism underlying DfMRI is activity-triggered cell swelling within neural tissue1,3,4. To investigate this hypothesis, we investigated the effects of dopamine stimulation on DfMRI signals at single cell and ganglia levels in Aplysia californica buccal ganglia using MR microscopy at 17.2T. A previous study based on manganese enhanced MRI (MEMRI) demonstrated that dopamine, indeed, induces neural activation in the Aplysia buccal ganglia5. The effect of dopamine stimulation on cell size was also evaluated using optical microscopy.Methods
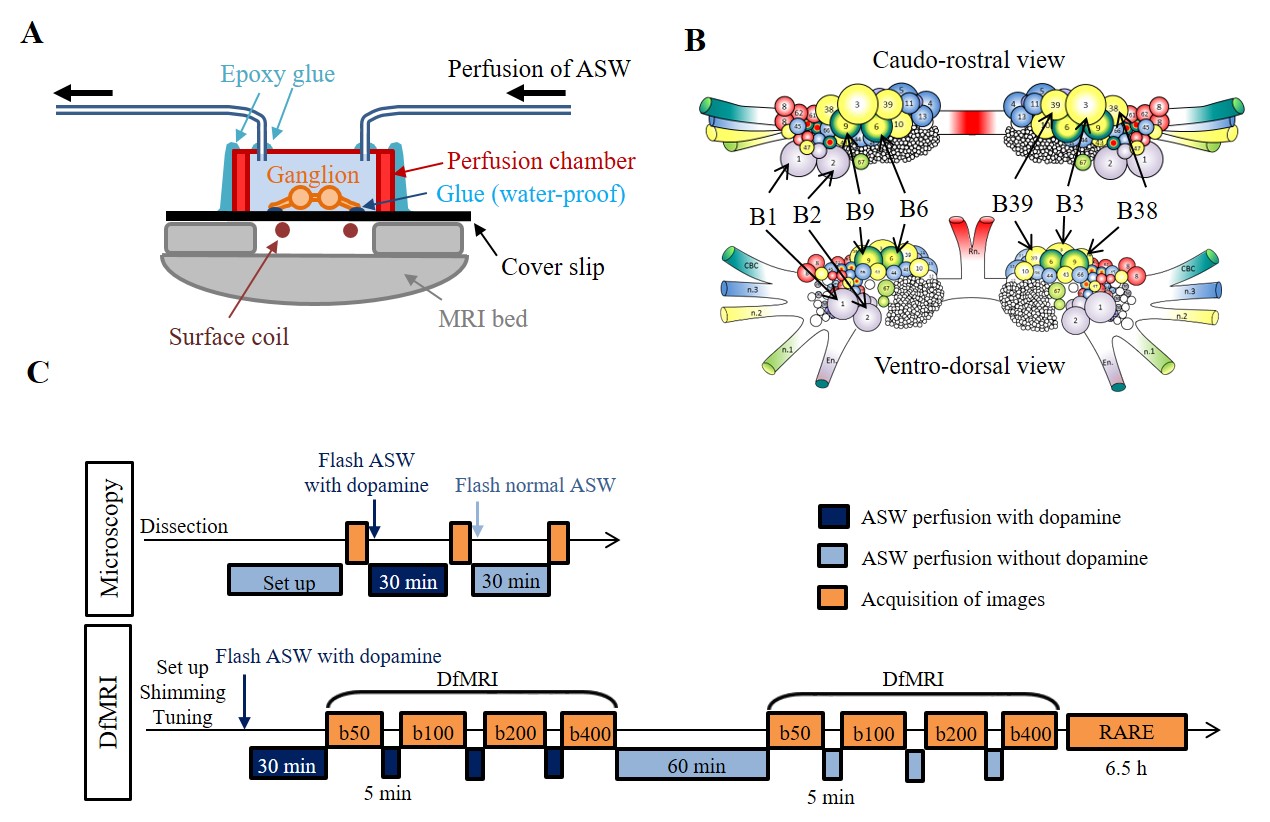
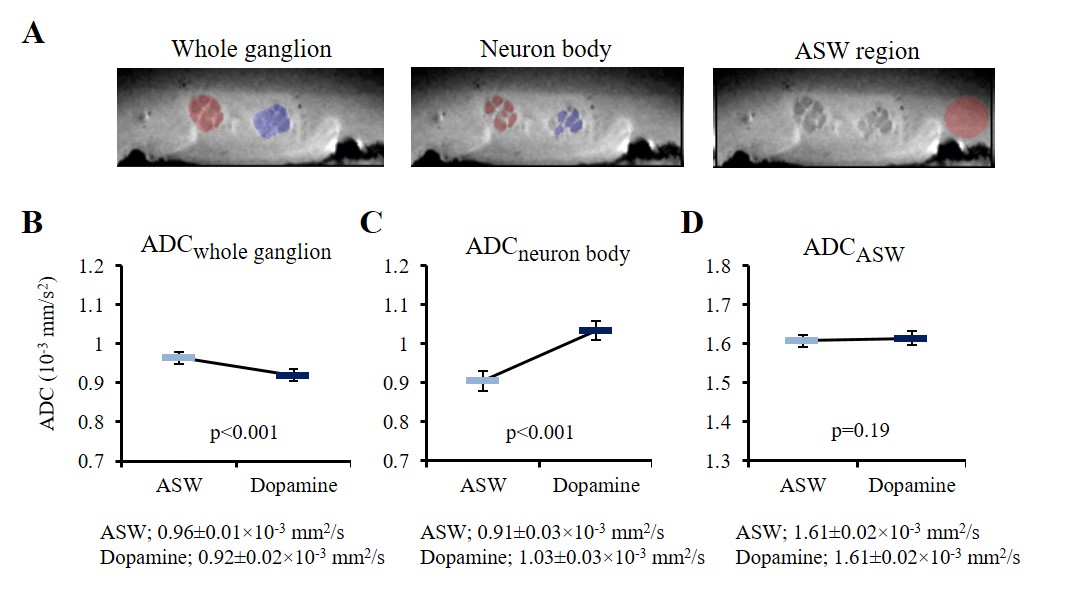
The bilateral buccal ganglia of 7 Aplysia californica (National Resource for Aplysia, USA) were dissected and inserted into a glass chamber filled with artificial sea water (ASW). All image acquisitions were performed at room temperature. In order to induce neuronal activation the ganglia was perfused with a mix of ASW, 0.05 mM dopamine, and 0.05 mM ascorbic acid for 30 min. This perfusion time was chosen in order to allow dopamine to penetrate the outer connective tissue sheath of the ganglia and reach the neurons6. Optical microscopic images were acquired before, after dopamine + ASW perfusion, and after wash out with ASW (Fig. 1C), using an Axio Observer Z1 microscopy (Zeiss, France). After microscopy imaging, the ganglia were inserted into a perfusion system (Fig. 1A) filled with ASW. The bilateral nerves of the buccal ganglia were fixed on the cover slip using a water-proof glue to prevent movement during perfusion. DfMRI images were acquired under perfusion with ASW and dopamine + ASW (Fig. 1C) using a 17.2T MRI scanner (Bruker BioSpin, Germany) equipped with 1 T/m gradients using the following parameters: 2D-spin echo diffusion weighted sequence; TR=2000 ms, TE=13.11 ms, FOV=0.4×0.16 cm2, Matrix=80×32, Slice thickness = 100 μm, Number of slices=8, Resolution=50×50×100 μm3, 4 b-values=50, 100, 200, 400 s/mm2, Direction=(X=1, Y=1, Z=1), 8 averages, Scan time=10 min for each b-value. Although ganglia oxygenation was ensured through continuous perfusion, as an extra precaution the DfMRI images under dopamine + ASW were obtained before those under pure ASW to avoid potentially confounding factors related to hypoxia induced ischemia. An MR microscopy surface RF coil (4.2 mm diameter) was used for transmission and reception. T2 weighted structural images, used for identification of cells within the ganglia, were also acquired with the following parameters: 3D-relaxation enhancement (RARE) sequence; TR=2000 ms, TE=16 ms, RARE factor=4, FOV=0.4×0.16×0.3 cm3, Matrix=160×64×60, Resolution=25×25×50 μm3, 12 averages, Scan time=6 h 24 min. The DfMRI and RARE images were co-registered. Apparent diffusion coefficient (ADC) was calculated in each bilateral ganglion by fitting S/So(b)=exp(-bADC) using MATLAB. The ganglia and the neuron bodies (Fig. 1B) were identified and manually segmented on each slice using the RARE images (Fig. 3A). Cell diameters and surface areas of each neuron body were measured from the optical microscopy images using ImageJ.Results
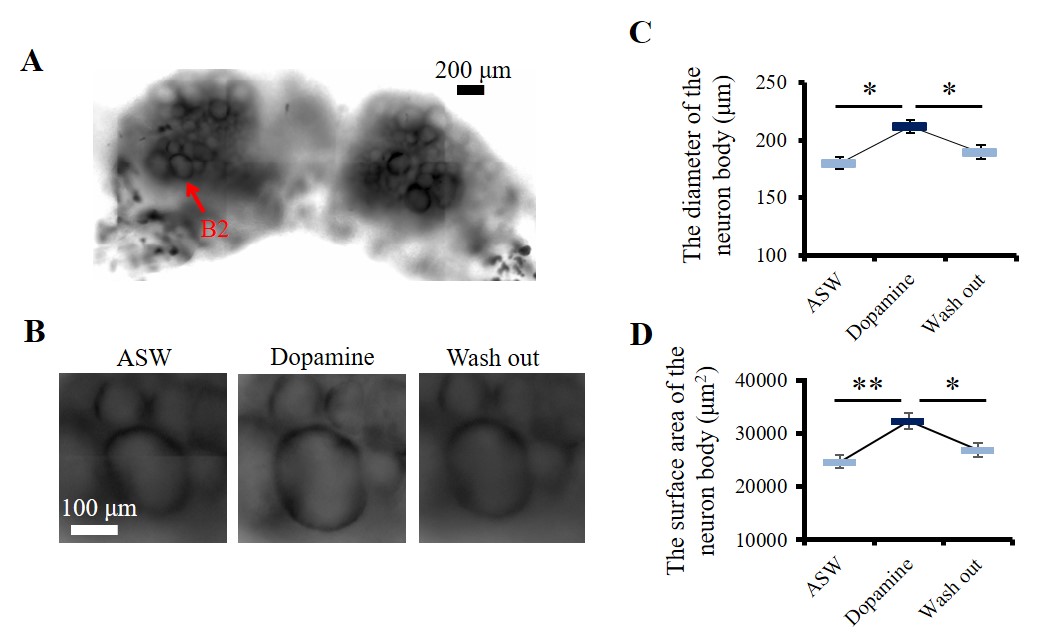
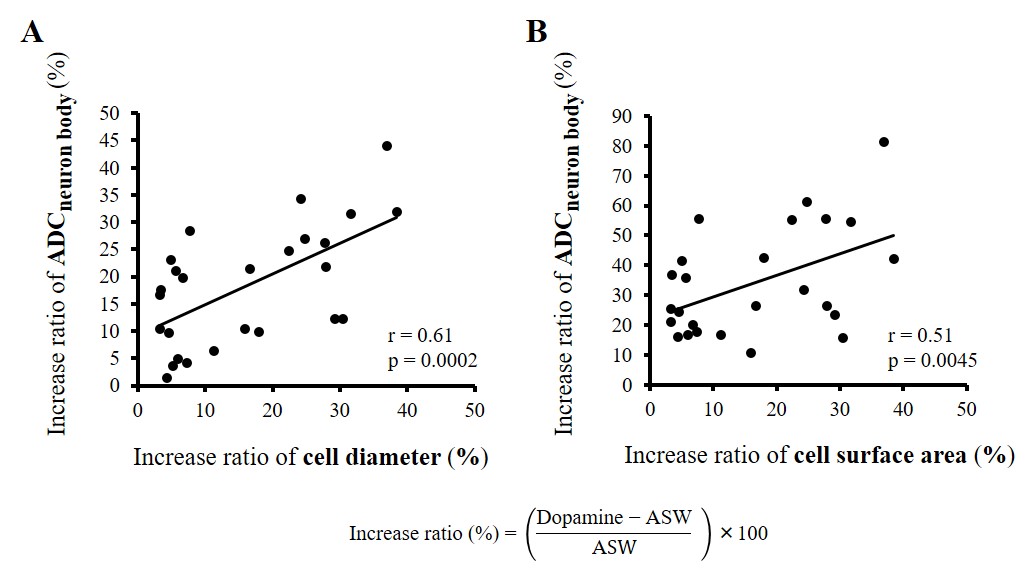
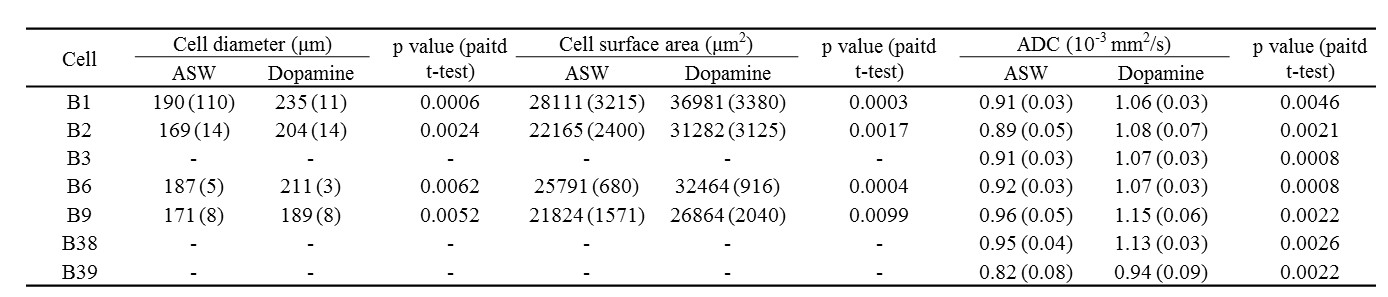
Optical microscopy images showed a significant increase in cell diameter and cell surface area upon dopamine stimulation (Fig. 2 and Table 1), confirming cell swelling. After dopamine washout both the cell diameters and surface areas went down (Fig. 2). Upon dopamine stimulation, the water ADC increased inside neuron cell bodies (Fig. 3C and Table 1). The amount of ADC increase in neuron bodies was significantly correlated with the increase in cell diameter and surface area (Fig. 4). In contrast, the ADC decreased at the level of the whole ganglia (Fig. 3B). These results agree with earlier reports using hypotonic stress or ouabaine (swelling inducer)7. No change in ADC was observed in ROIs not containing the ganglia when changing the perfusion from dopamine solution to ASW (Fig. 3D).Discussion and conclusion
Our results confirm that neural swelling occurs upon neural activation, resulting in an ADC decrease at ganglia level and an intracellular ADC increase. While the intracellular ADC increase likely reflects a dilution effect in cytoplasm upon cell swelling, the mechanism of the ADC decrease at ganglia or tissue level upon cell swelling remains putative at this stage. Possible explanations include increased tortuosity in the extracellular space8,9 or volumetric increase of a surface layer of slow diffusing water bound to the cell membrane5,10. Although one must remain cautious with the extrapolation of these findings to the mammalian brain, they support the hypothesis that the ADC decrease observed with DfMRI upon neuronal activation at tissue level reflects activation induced cell swelling.Acknowledgements
We thank Françoise Geffroy for technical help with the optical microscopy experiments. We thank the Louis-Jeantet and Louis D. Foundations for their generous support. Additional financial support was obtained through Grant ANR-13-BSV5-0014-01 (project ANImE).References
1. Le Bihan D, Urayama S, Aso T, Hanakawa T, Fukuyama H. Direct and fast detection of neuronal activation in the human brain with diffusion MRI. Proc Natl Acad USA. 2006;103(21):8263-8268.
2. Abe Y, Tsurugizawa T, Le Bihan D. Anesthesia increases water diffusion in wakefulness/sleep brain regions in the rat brain. International society for magnetic resonance in medicine. Proc Intl Soc Mag Reson Med 2016;24:3781.
3. Tsurugizawa T, Ciobanu L, Le Bihan D. Water diffusion in brain cortex closely tracks underlying neuronal activity. Proc Natl Acad USA. 2013;110(28):11636-11641.
4. Vincis R, Lagier S, Van De Ville D, Rodriguez I, Carleton A. Sensory-evoked intrinsic imaging signals in the olfactory bulb are independent of neurovascular coupling. Cell Rep. 2015;12(2):313-325.
5. Jelescu IO, Nargeot R, Le Bihan D, Ciobanu L. Highlighting manganese dynamics in the nervous system of Aplysia californica using MEMRI at ultra-high field. NeuroImage. 2013;76: 264-271.
6. Kabotyanski EA, Baxter DA, Cushman SJ, Byrne JH. Modulation of fictive feeding by dopamine and serotonin in aplysia. J Neurophysiol. 2000 ;83(1):74-92.
7. Jelescu IO, Ciobanu L, Geffroy F, Marquet P, Le Bihan D. Effects of hypotonic stress and ouabain on the apparent diffusion coefficient of water at cellular and tissue levels in Aplysia. NMR in Biomedicine. 2014;27(3): 280-290.
8. Syková E, Vargová L, Prokopová S, Simonová Z. Glial swelling and astrogliosis produce diffusion barriers in the rat spinal cord. Glia. 1999;25(1):56-70.
9. Chen KC, Nicholson C. Changes in brain cell shape create residual extracellular space volume and explain tortuosity behavior during osmotic challenge. Proc Natl Acad USA. 2000;97(15):8306-8311.
10. Le Bihan D. The 'wet mind': water and functional neuroimaging. Phys Med Biol. 2007;52(7):R57-R90.
Figures