5247
Study of the PSF distortion correction for ultra-high field BOLD fMRI1Department of Physics, University of Pisa, Pisa, Italy, 2Imago7 Research Center, Pisa, Italy, 3Department of Neurologic Surgery, Mayo Clinic, Rochester, MN, United States, 4Biomedical Magnetic Resonance, Otto-von-Guericke University, Magdeburg, Germany, 5GE Healthcare, Pisa, Italy, 6IRCCS Stella Maris, Pisa, Italy, 7Leibniz Institute for Neurobiology, Magdeburg, Germany, 8Center for Behavioral Brain Sciences, Magdeburg, Germany, 9German Center for Neurodegenerative Diseases, Magdeburg, Germany
Synopsis
Distortion correction is an essential step for anatomically faithful analysis of ultra-high-field fMRI data due to strong susceptibility-induced geometric distortions in echo-planar imaging (EPI). Although the point-spread-function (PSF) method allows accurate unwarping and increase in SNR, its effectiveness in modulating the undistorted BOLD signal is still unknown. In this study we applied the PSF-based distortion correction using different types of correction kernels to GRE- and SE-EPI data at different resolutions and directly to the BOLD contrast maps, and evaluated the effectiveness by assessing functional contrast, specificity, and false-positive-rate.
Purpose
Ultra-high field EPI-based fMRI offers improved BOLD sensitivity1-3. Yet, strong geometrical distortions cause a mismatch between functional and anatomical images, which is a significant obstacle for reliable fMRI applications. The point-spread-function (PSF) mapping method suggested recently4-5 allows accurate distortion correction and increase in SNR after distortion correction, but its effectiveness in modulating the undistorted BOLD signal is still unknown. In this study we evaluate the spatial distribution of the functional maps in GRE- and SE-fMRI at different acquisition resolutions in distorted and distortion-corrected (DiCo) space.Acquisition
Four healthy volunteers (ages: 26-32, 1 female) were scanned on a whole body 7T MRI (Siemens Healthcare, Erlangen, Germany) using a 32-channel head coil (Nova Medical, Wilmington, USA). Experiments were approved by the local ethics committee. SE- and GRE-EPI sequences were optimized for high-resolution targeted fMRI. Fourteen slices were prescribed obliquely, parallel to the calcarine sulcus covering V1 and V5/hMT+. Imaging parameters for GRE- and SE-fMRI were: TR/TE(GRE)/TE(SE)=3000/23/45ms, flip-angle(GRE)=62º, FoV=19.2mm, slice thickness=1.4mm, spacing=0.1mm, GRAPPA=2, phase-encoding=Anterior-to-Posterior, fat suppression, partial-Fourier=5/8. The functional task was a dynamic display of coherent motion (15s blocks of dots moving coherently, followed by 15s blocks of gray screen) with total duration of 3’00” per scan. Each fMRI experiment was repeated with three different in-plane resolutions including 1.5×1.5mm2, 1.0×1.0mm2, and 0.75×0.75mm2. As a pre-scan, corresponding PSF reference scans5 were conducted with the parameters identical to fMRI scan.
At the highest resolution, a longer TR of 8 seconds was applied for GRE- and SE-PSF scans to cover the entire brain. High-resolution whole brain MP2RAGE6 and SWI were also obtained, respectively for anatomical co-registration of MNI V1 and V5, and for calculation of venograms.
Data Analysis
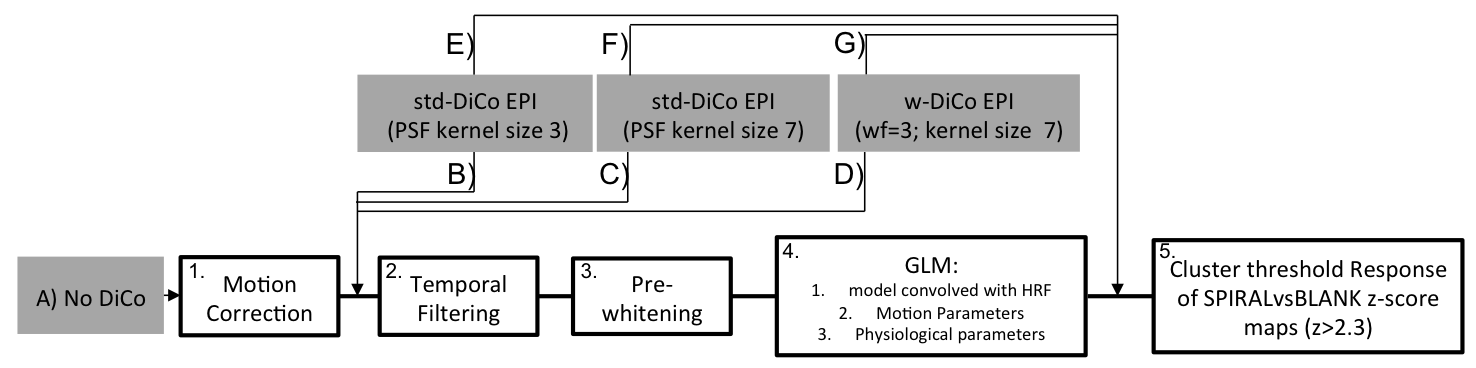
Seven different fMRI pipelines were evaluated (Figure 1; Figure 2). Two distortion correction kernels ($$$H_c$$$) of different kernel sizes (3 and 7) were calculated from the PSF data according to In et al.5 and applied to distorted data. Alternatively, a kernel weighting approach (w-DiCo) is used on the kernel ($$$H_c$$$) for distortion correction of EPI $$$I(x,y)$$$:
$$I_c(x,s)=\int I(x,y)[H_c(xy,s)]^{wf}ds.$$
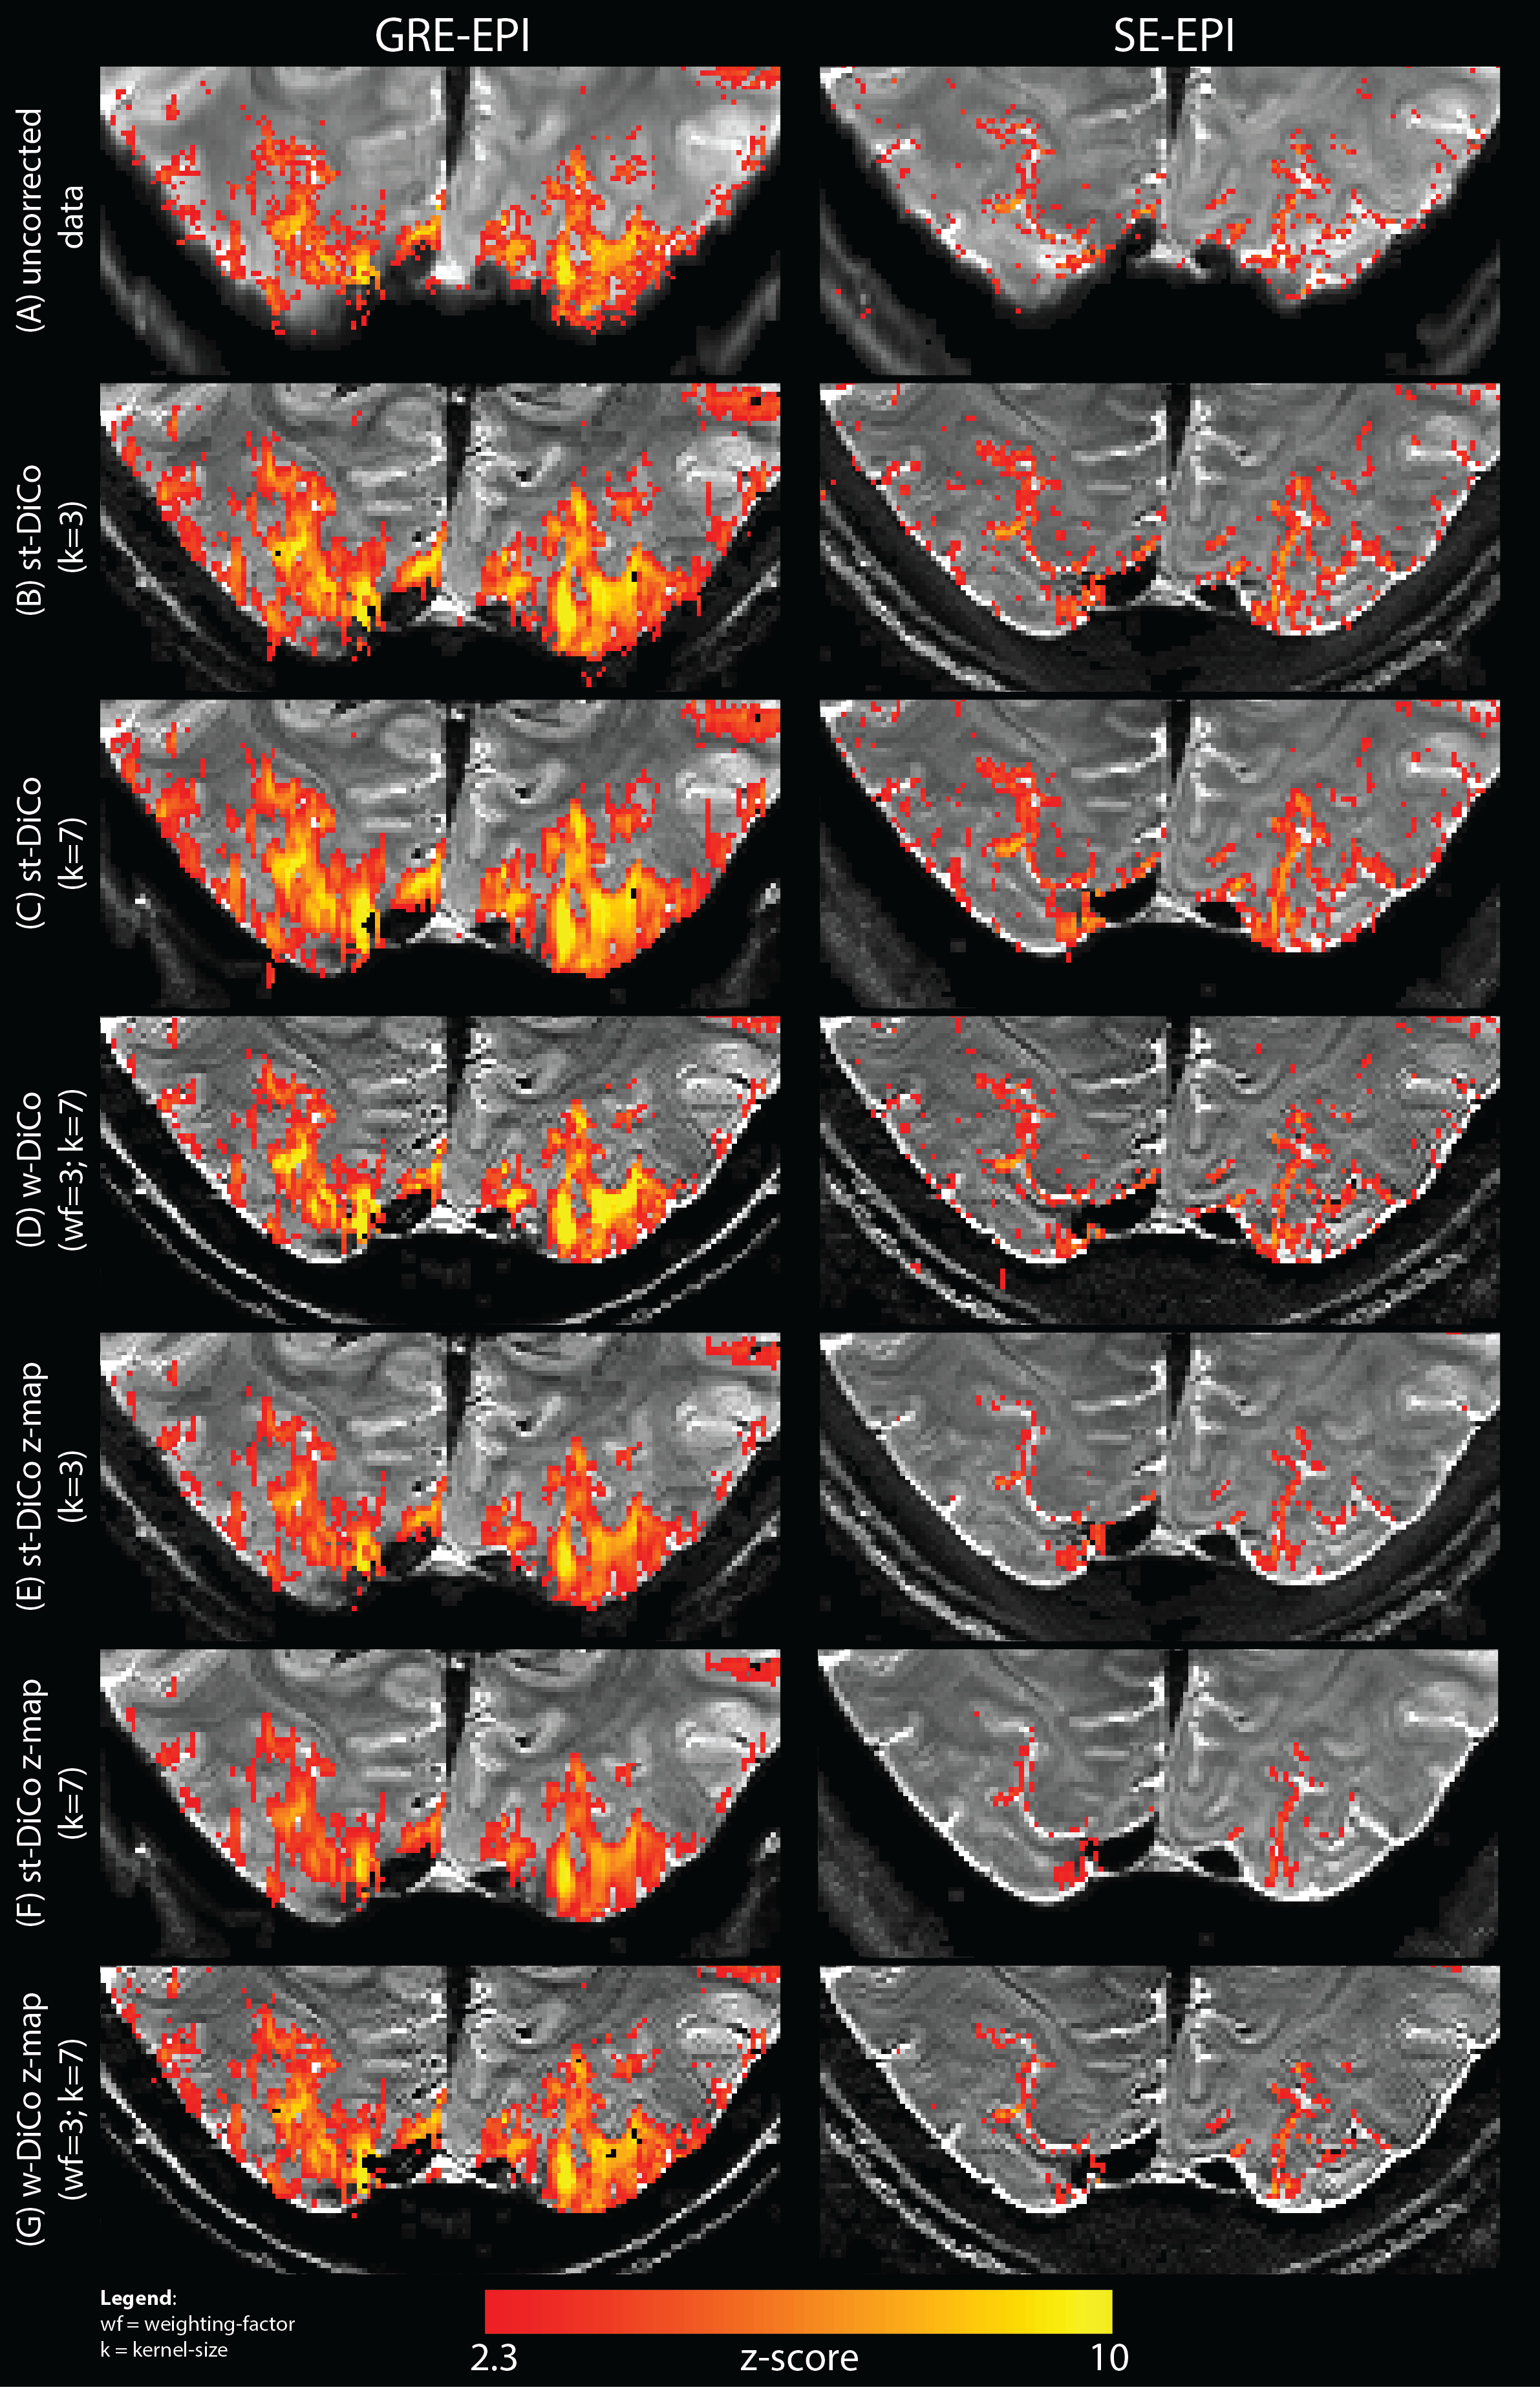
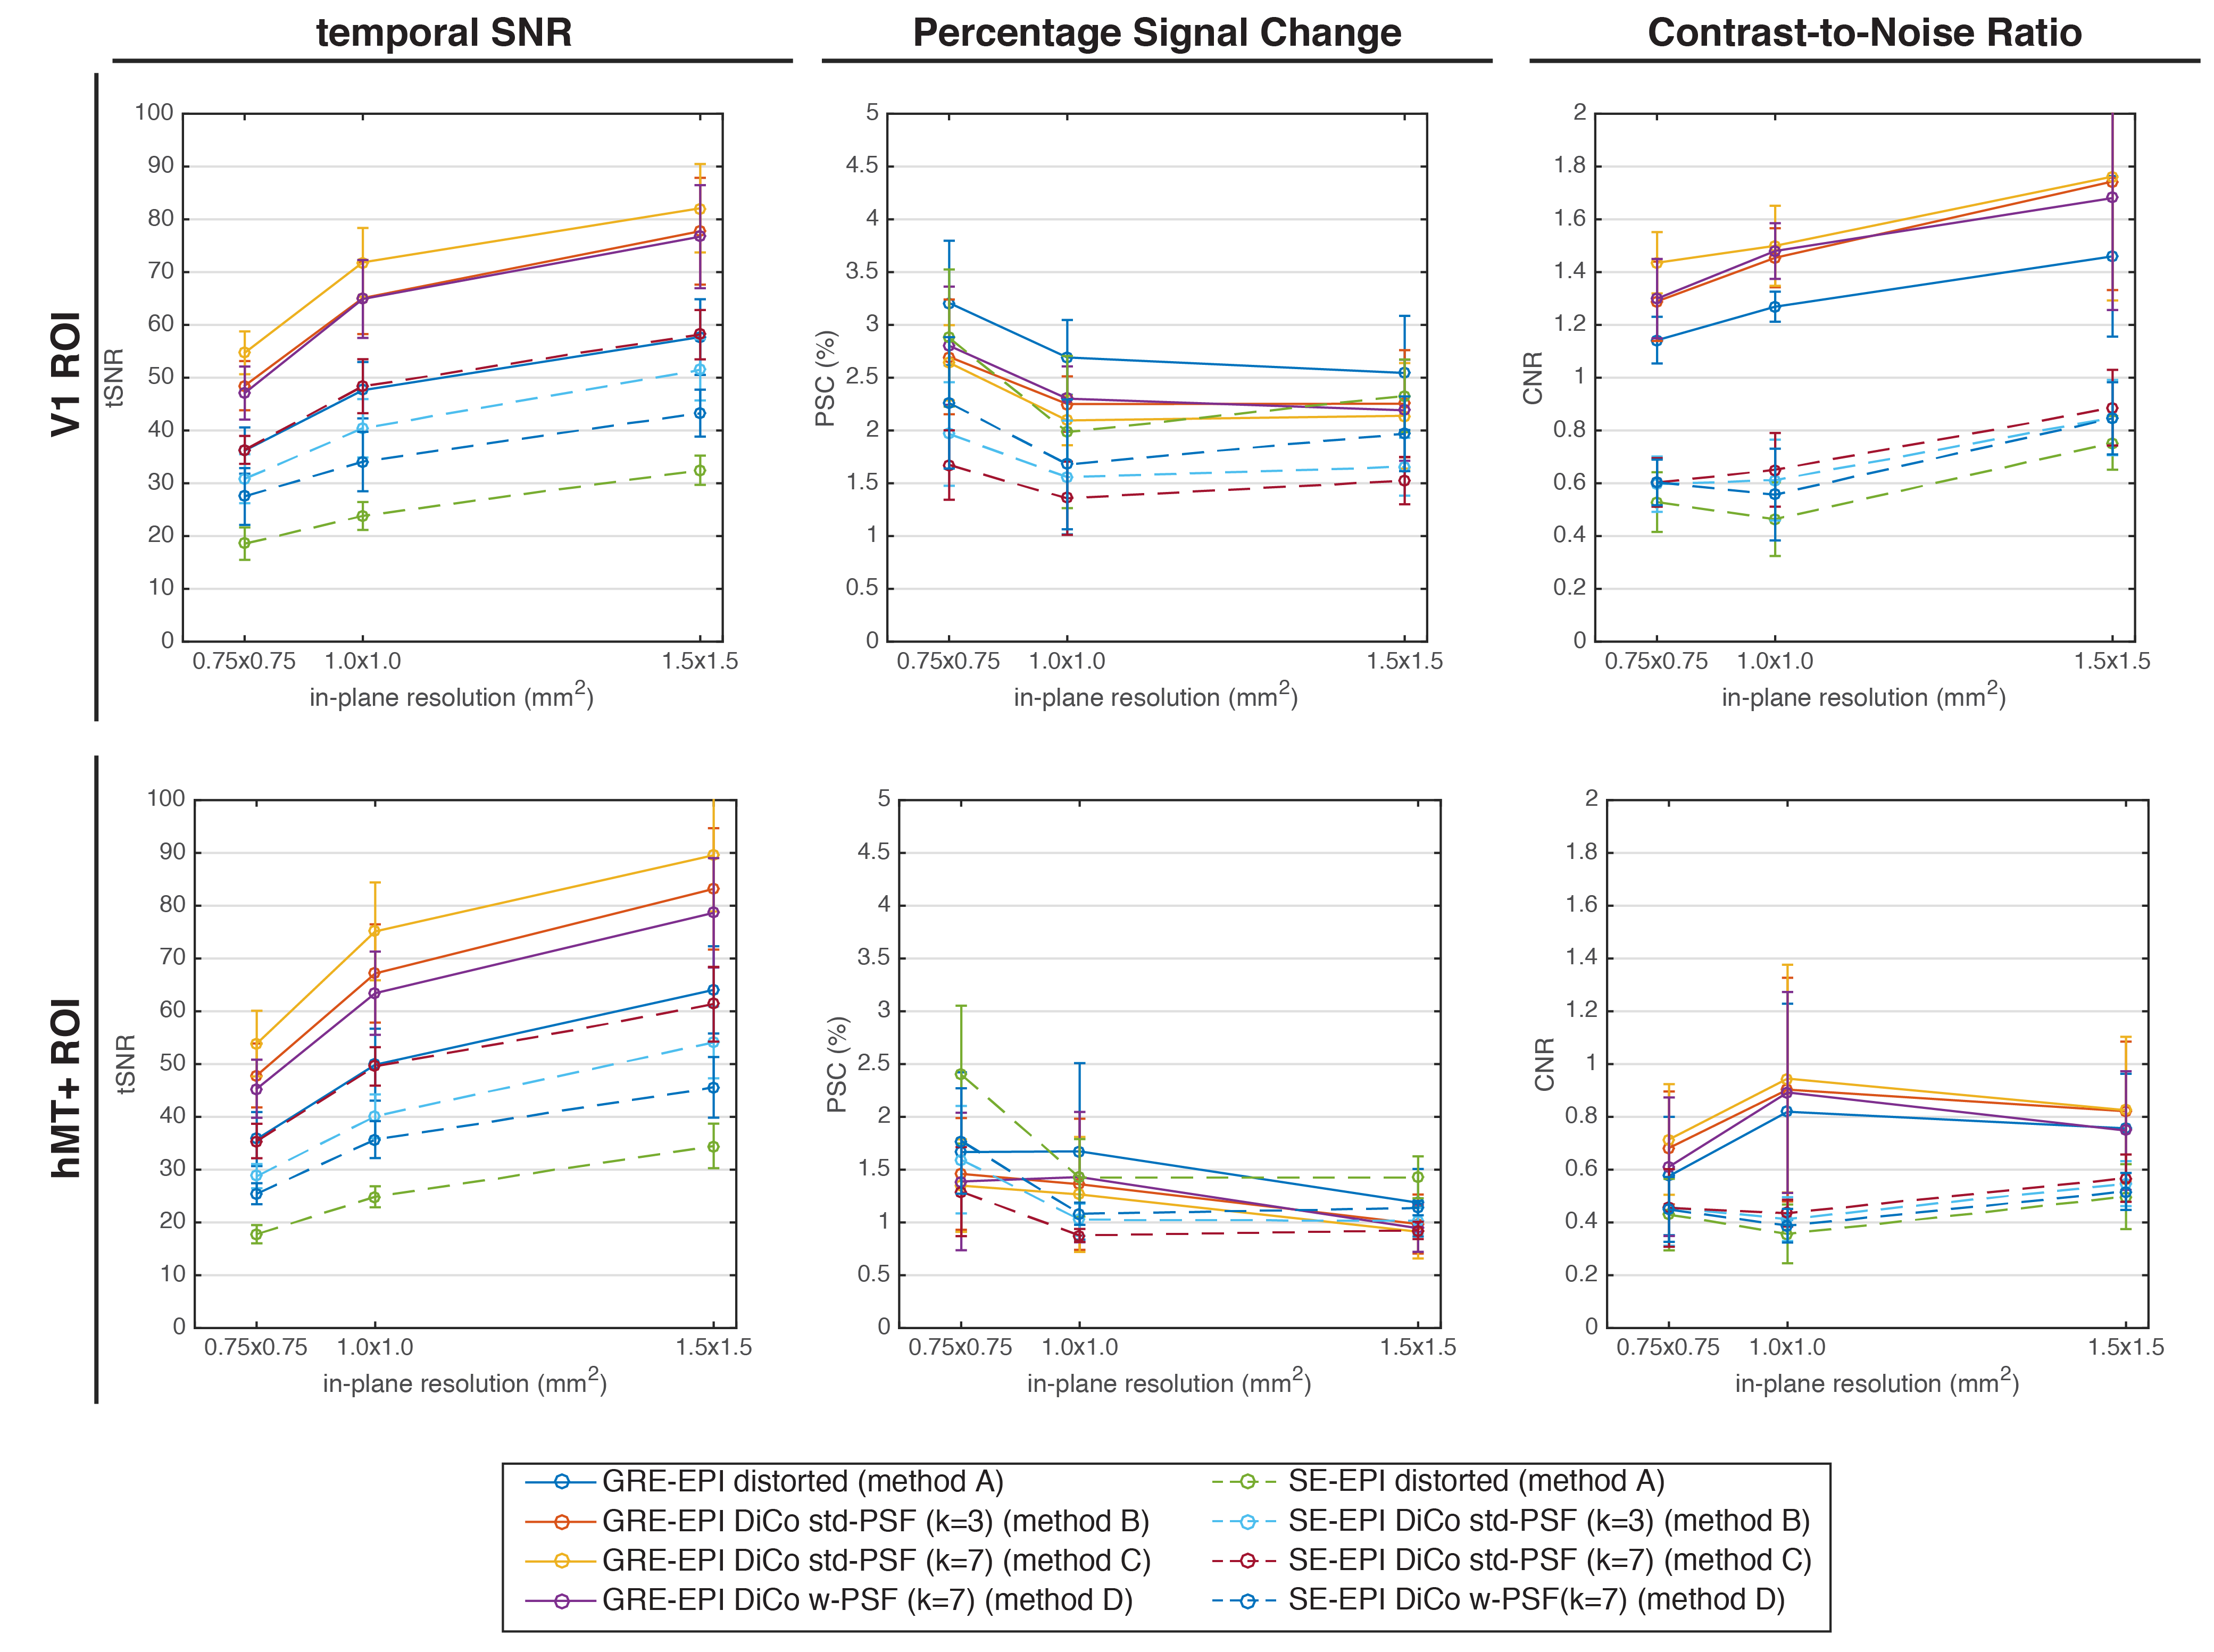
After motion-correction in AFNI7, temporal high-pass filtering (Hcut-off=60s), and pre-whitening using FEAT8, functional BOLD contrasts for visual stimulus effects were calculated from different variants of GRE- and SE-EPI series, which included distorted EPI, std-DiCo EPI (kernel sizes of 3 and 7), and w-DiCo EPI (wf=3). Distortion kernels were applied either to the corresponding EPI time series, or to the functional map after statistical inference. Averages of temporal-SNR (tSNR), percent-signal-change (PSC) and contrast-to-noise-ratio (CNR=PSC×tSNR) were calculated from all statistically significant voxels in V1 and hMT+.
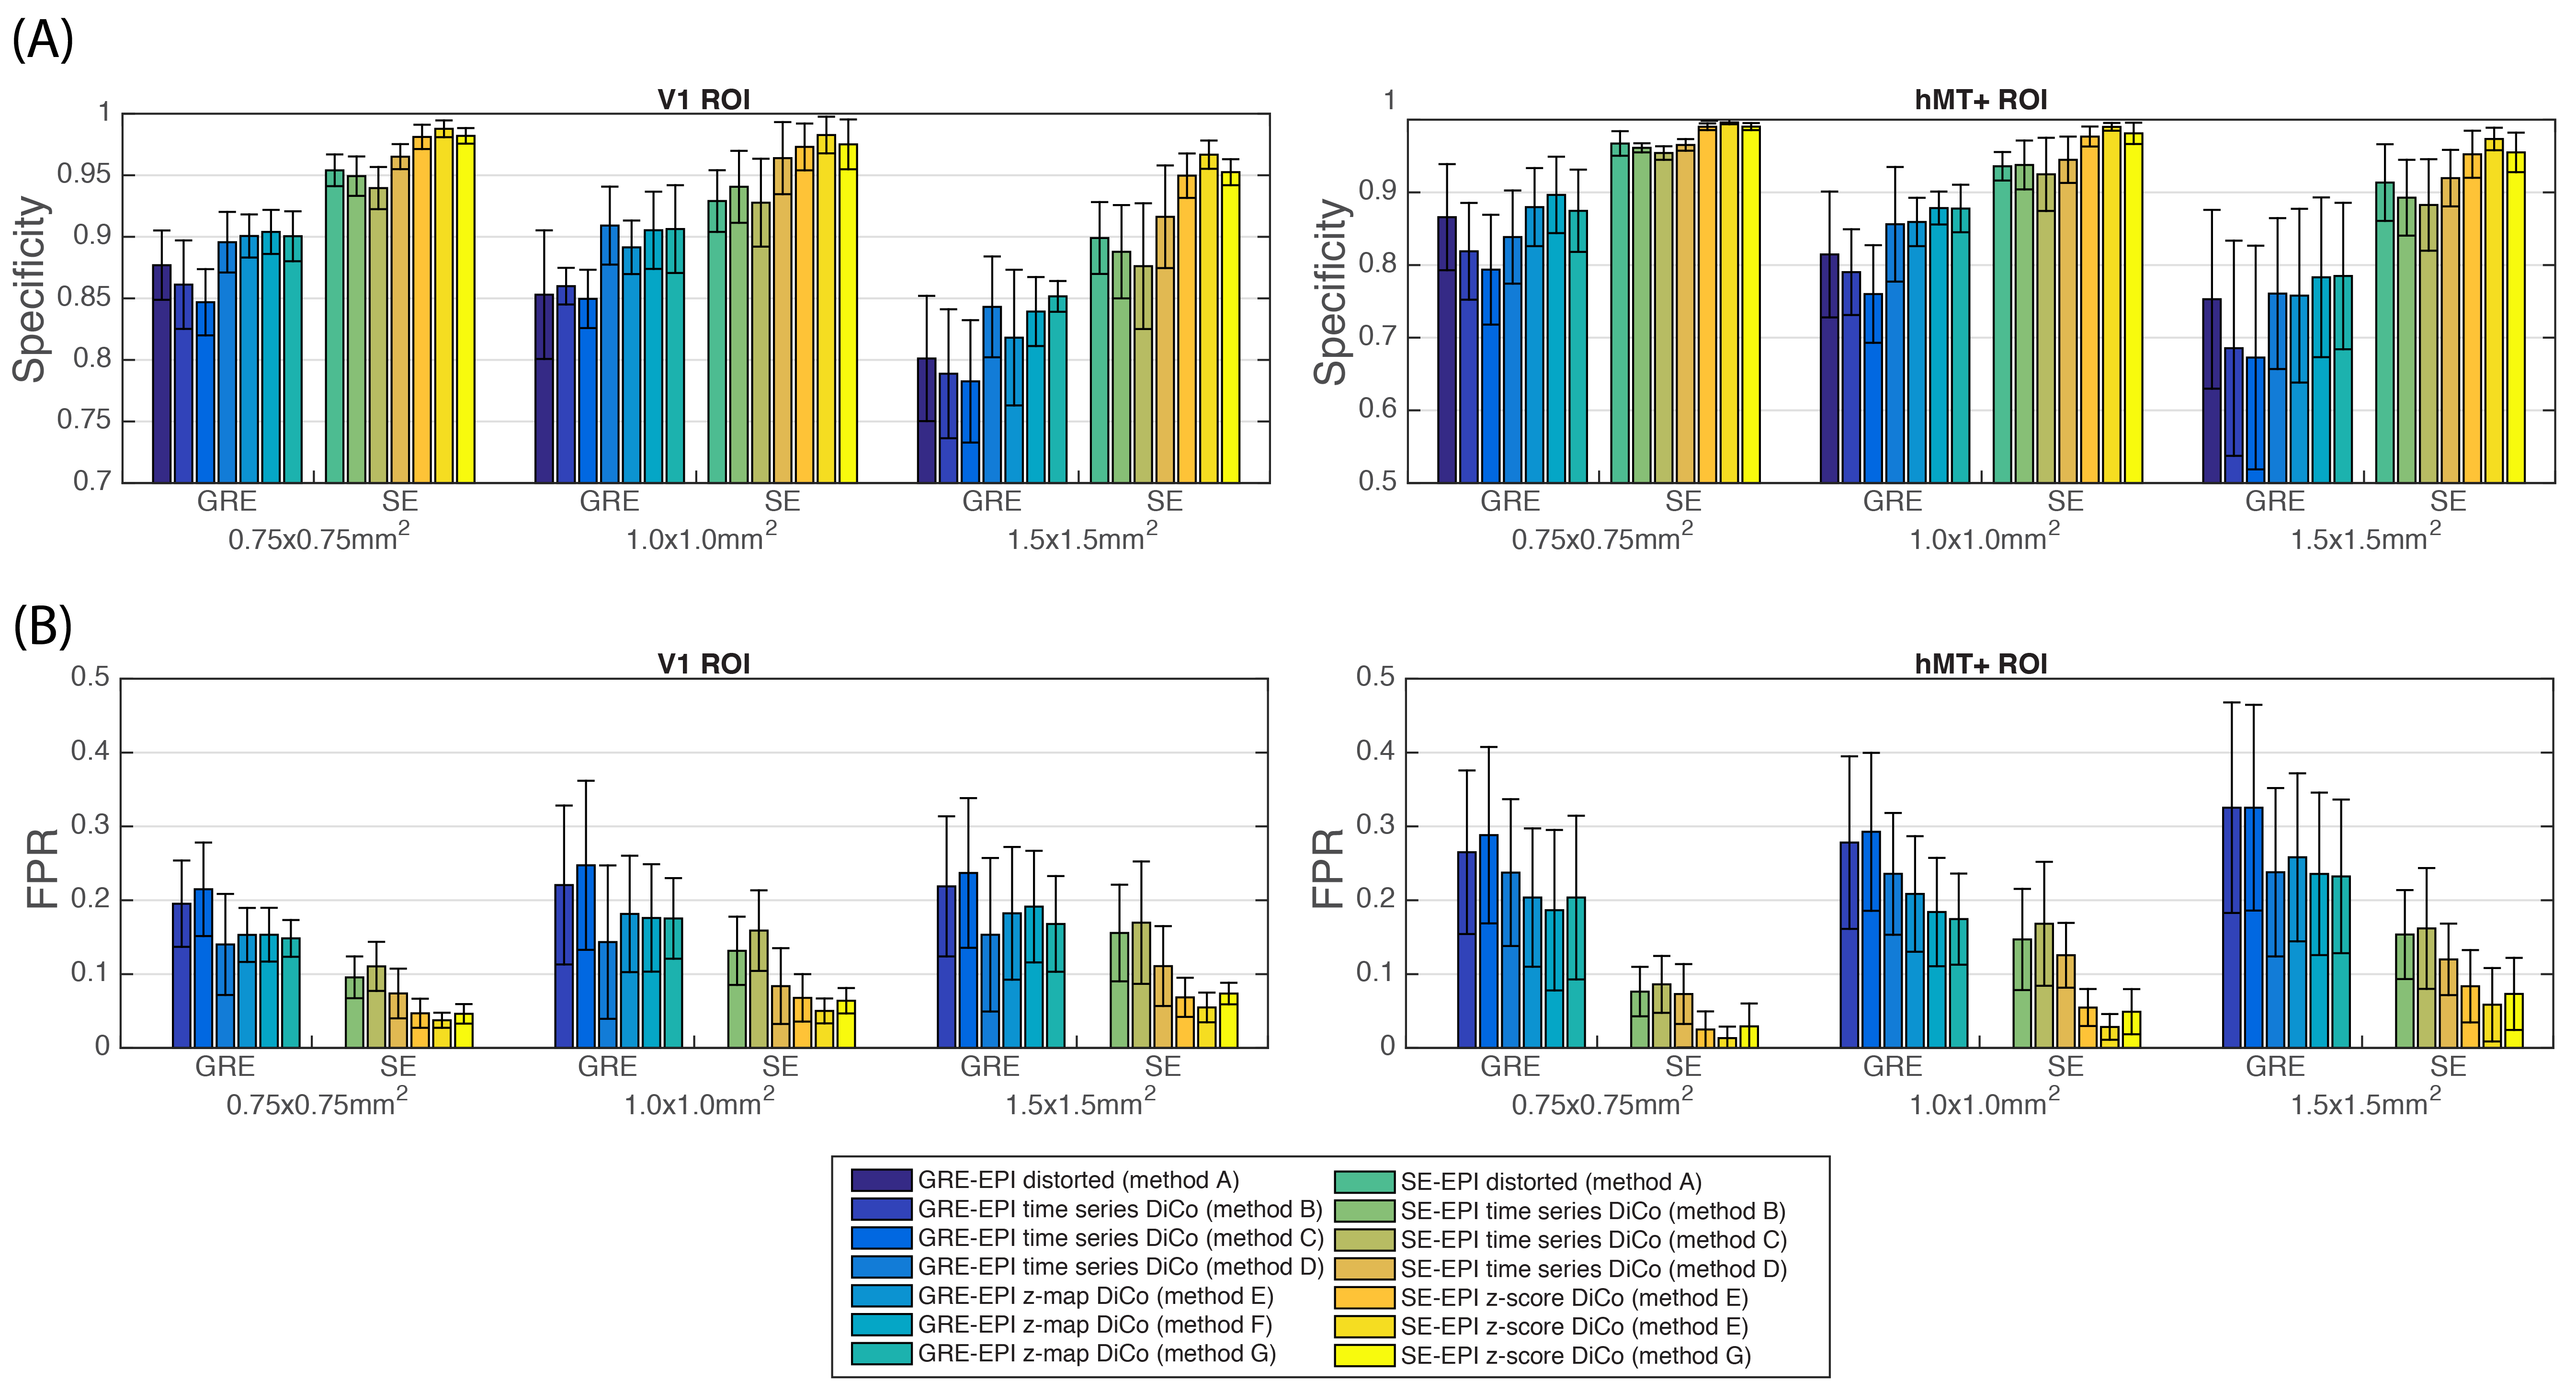
The PSF data with a longer TR were subsampled to each resolution and an automated segmentation of gray-matter (GM) was achieved with FAST from FSL8 in distorted and DiCo space; tissue not included in the GM-mask was labeled as ‘NGM’. Functional specificity was defined as: $$$Spec=TN/N_{NGM}$$$, where $$$TN$$$=number of non-active voxels in NGM and $$$N_{NGM}$$$=total number of NGM voxels. QSM maps were computed from the phase data of the SWI9, and were hard-thresholded to obtain distortion-free venograms. The False-Positive-Rate (FPR) was computed as the number of active voxels in the vein mask divided by the number voxels in the vein mask. Statistical differences on the measured parameters were assessed with the Adonis test in R10.
Results
After distortion correction, temporal-SNR for SE and GRE-EPI series was increased by up to 68.0% and 40.72%, respectively (F=113;R2=0.20;p-value=0.001) (Figure 3). In the average CNR, however, no significant differences were shown between distorted and DiCo data (F=3.87;R2=0.01;p-value=0.013).
Although a mild average decrease (SE: (-2.67±0.90)%. GRE: (-1.67±1.75)%) in specificity was observed in the functional map calculated from data with std-DiCo compared to the map from distorted data, the specificity of the functional map was increased considerably with w-DiCo (Figure 4). However, when the correction is applied directly to the functional map, GM-specificity increased and FPR decreased further (Specificity: F=9.3;R2=0.049;p-value=0.001. FPR: F=7.7;R2=0.055;p-value=0.001).
The overall trends observed above were similar for the different resolutions tested.
Discussion and Conclusion
In this study we show that the geometrical changes induced by the distortion correction didn’t reveal changes in BOLD contrast at standard or sub-millimeter resolution acquisitions. However, there were significant differences between the functional maps calculated from DiCo data and directly distortion-corrected. The statistical properties of the data may be modified in the distortion correction process, potentially by changes in the spatial or temporal noise and signal distribution, as shown in the DiCo results with different kernels for image interpolation. In the future, further investigation is needed to provide the most suitable DiCo approach for an optimal functional specificity, which can be helpful to better understand the spatial localization of brain function.Acknowledgements
This work was supported by the Initial Training Network, HiMR, funded by the FP7 Marie Curie Actions of the European Commission, grant number FP7-PEOPLE-2012-ITN-316716, and by the NIH, grant number 1R01-DA021146.References
1. Duong T Q, Yacoub E, Adriany G, et al. Microvascular BOLD contribution at 4 and 7 T in the human brain: gradient-echo and spin-echo fMRI with suppression of blood effects. Magn. Reson. Med. 2003;49:1019–1027.
2. Yacoub E, Duong T Q, Van de Moortele P F, et al. Spin-echo fMRI in humans using high spatial resolutions and high magnetic fields. Magn. Reson. Med. 2003;49:655–664.
3. Zwaag W, Francis S, Head K, et al. fMRI at 1.5, 3 and 7 T: Characterizing BOLD signal changes. Neuroimage 2009;47:1425-1434.
4. In M-H, Speck O. Highly accelerated PSF-mapping for EPI distortion correction with improved fidelity. Magn. Reson. Mater. Phy. 2012;25:183-192.
5. In M-H, Posnansky O, Beall E B, et al. Distortion Correction in EPI using an extended PSF method with a reversed phase gradient approach. PLoS ONE 2015;10(2):e0116320.
6. Marques J P, Kober T, Krueger G, et al. MP2RAGE, a self bias-field corrected sequence for improved segmentation and T1-mapping at high field. Neuroimage 2010;49:1271-1281.
7. Cox R W. AFNI: software for analysis and visualization of functional magnetic resonance neuroimages. Comput. Biomed. Res. 1996;29:162–173.
8. Smith S M, Jenkinson M, Woolrich M W, et al. Advances in functional and structural MR image analysis and implementation as FSL. Neuroimage 2004;23:S208-S219.
9. Acosta-Cabronero J, Williams G B, Cardenas-Blanco A C, et al. In Vivo Quantitative Susceptibility Mapping (QSM) in Alzheimer’s Disease. PLoS ONE 2013;8(11):e81093.
10. R Core Team. R: A language and environment for statistical computing. R Foundation for statistical Computing, Vienna, Austria. 2014.
Figures