5243
Characterization of laminar profiles in human auditory cortex using a dense 24-channel temporal lobe array at 3T1Institute of Biomedical Engineering, National Taiwan University, Taipei, Taiwan, 2Institute of Applied Physics, National Chengchi University, Taipei, Taiwan, 3Institute of Neuroscience, National Yang Ming University, Taipei, Taiwan, 4Department of Neuroscience and Biomedical Engineering, Aalto University, Espoo, Finland
Synopsis
By using a dedicated 24-channel temporal lobe array and surface based laminar depth analysis, we revealed the tonotopic representations in the human primary auditory cortex on a 3T MRI system. We found that, compared to deep and superficial layers, the minimal inter-subject variability of the tonotopic representation and frequency tuning width were found at the middle layer. Locations in the auditory cortex with finer frequency tuning had smaller inter-subject variability. Taken together, our findings suggested that middle layer of the auditory cortex has more specific frequency preference and selectivity, consistent with neurophysiological animal studies.
Target audience
Scientists interested in high spatial resolution fMRI across cortical layers.Purpose
The functional organization of auditory cortex is complex. The auditory cortex has been subdivided into multiple functionally specialized fields along the cortical surface1-7. In the direction normal to the cortical surface, many functional properties, such as response latency8,9, frequency tuning width10, complexity preference to acoustic information9,11, and binaural interactions12, have been found varying systematically across laminar layers based on electrophysiology recordings in animals. Together, these studies indicate a neuronal transformation of information across cortical layers at the auditory cortex13. To unravel how the auditory cortex integrates inputs, modulates information, and generates outputs, it is important to precisely delineate the intra-laminar computations. However, due to the highly folded nature and the thin thickness of human cortex14, investigating the functional organization across cortical depths using fMRI remains challenging. To date, human fMRI across cortical layers are mostly done at 7T15-18. Using a customized 24-channel receiver coil array tailored for temporal lobe imaging19 and surface based laminar depth analysis16, we revealed how tonotopic maps, frequency tuning widths, and their variabilities varies across cortical depths on a 3T MRI system.Methods
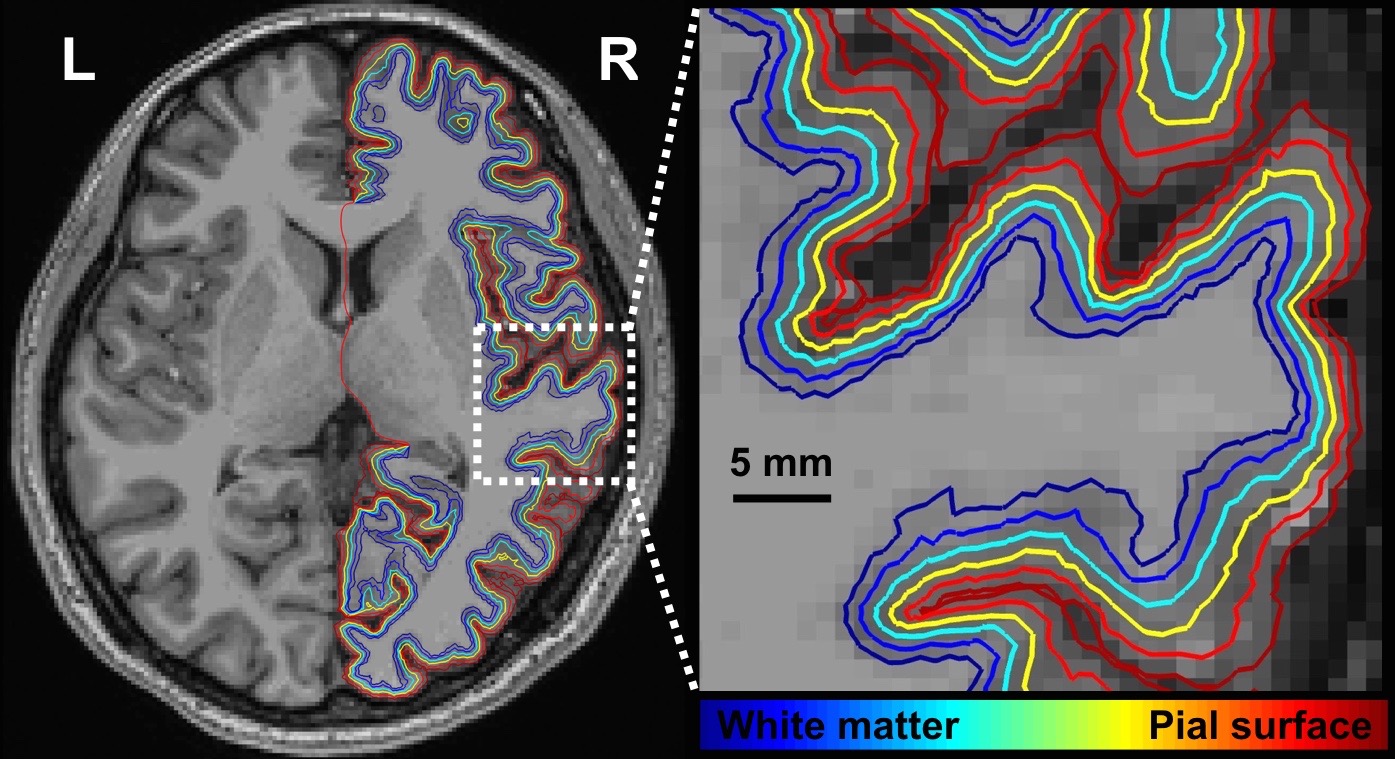
Sixteen healthy subjects participated in the study. All data were acquired on a 3T MRI system (Skyra, Siemens). Structural images were acquired with a 1 mm isotropic resolution MPRAGE pulse sequence. Nine intermediate cortical surfaces for each subject were generated following the procedures published in a previous study16. To obtain tonotopic maps, subjects were presented with a 20-s logarithmic tone chirp with the frequency spanning from 250 to 4000 Hz, followed by a 10-s silent period. This 30-s cycle was repeated 15 times. EPI with 1.5 mm isotropic resolution was used in the functional experiments. After morphing the time-series data onto each cortical surface, tonotopic maps were estimated based on the phase at the stimulus presentation frequency20. To estimate the tuning width, time series data were segmented and averaged into one chirp presentation block, then the full width at half maximum (FWHM) of the Gaussian fitting to the averaged time series was calculated. The inter-subject tonotopic map variability was calculated by averaging the absolute value of the best frequency difference ratio between each subject and the mean. To estimate intra-subject variability, we first arbitrarily separated all stimulus blocks into two groups. Second, tonotopic map and tuning FWHM were separately estimated for these two groups using the method described above. The intra-subject variability was calculated across 60 (2 groups x 30 repeats) estimated results.Results
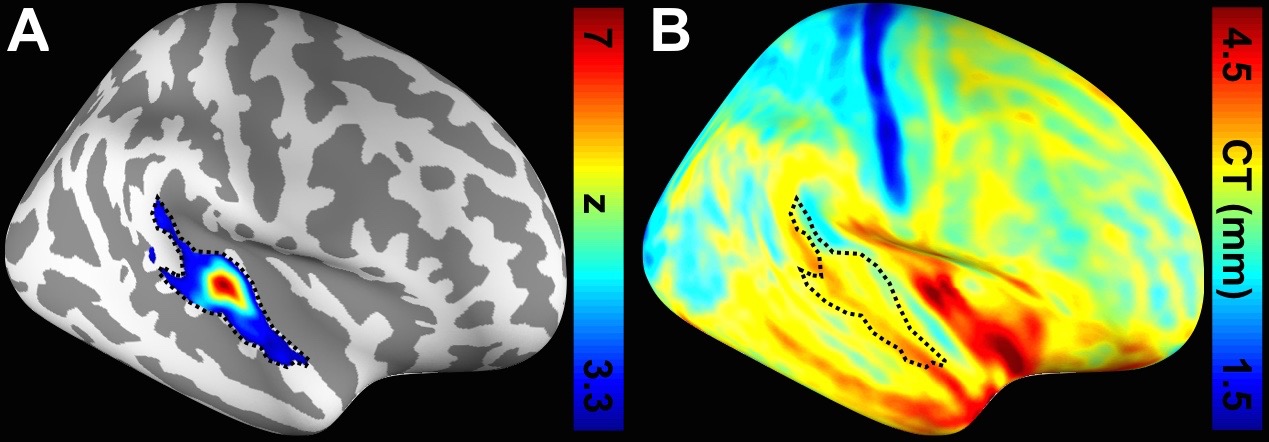
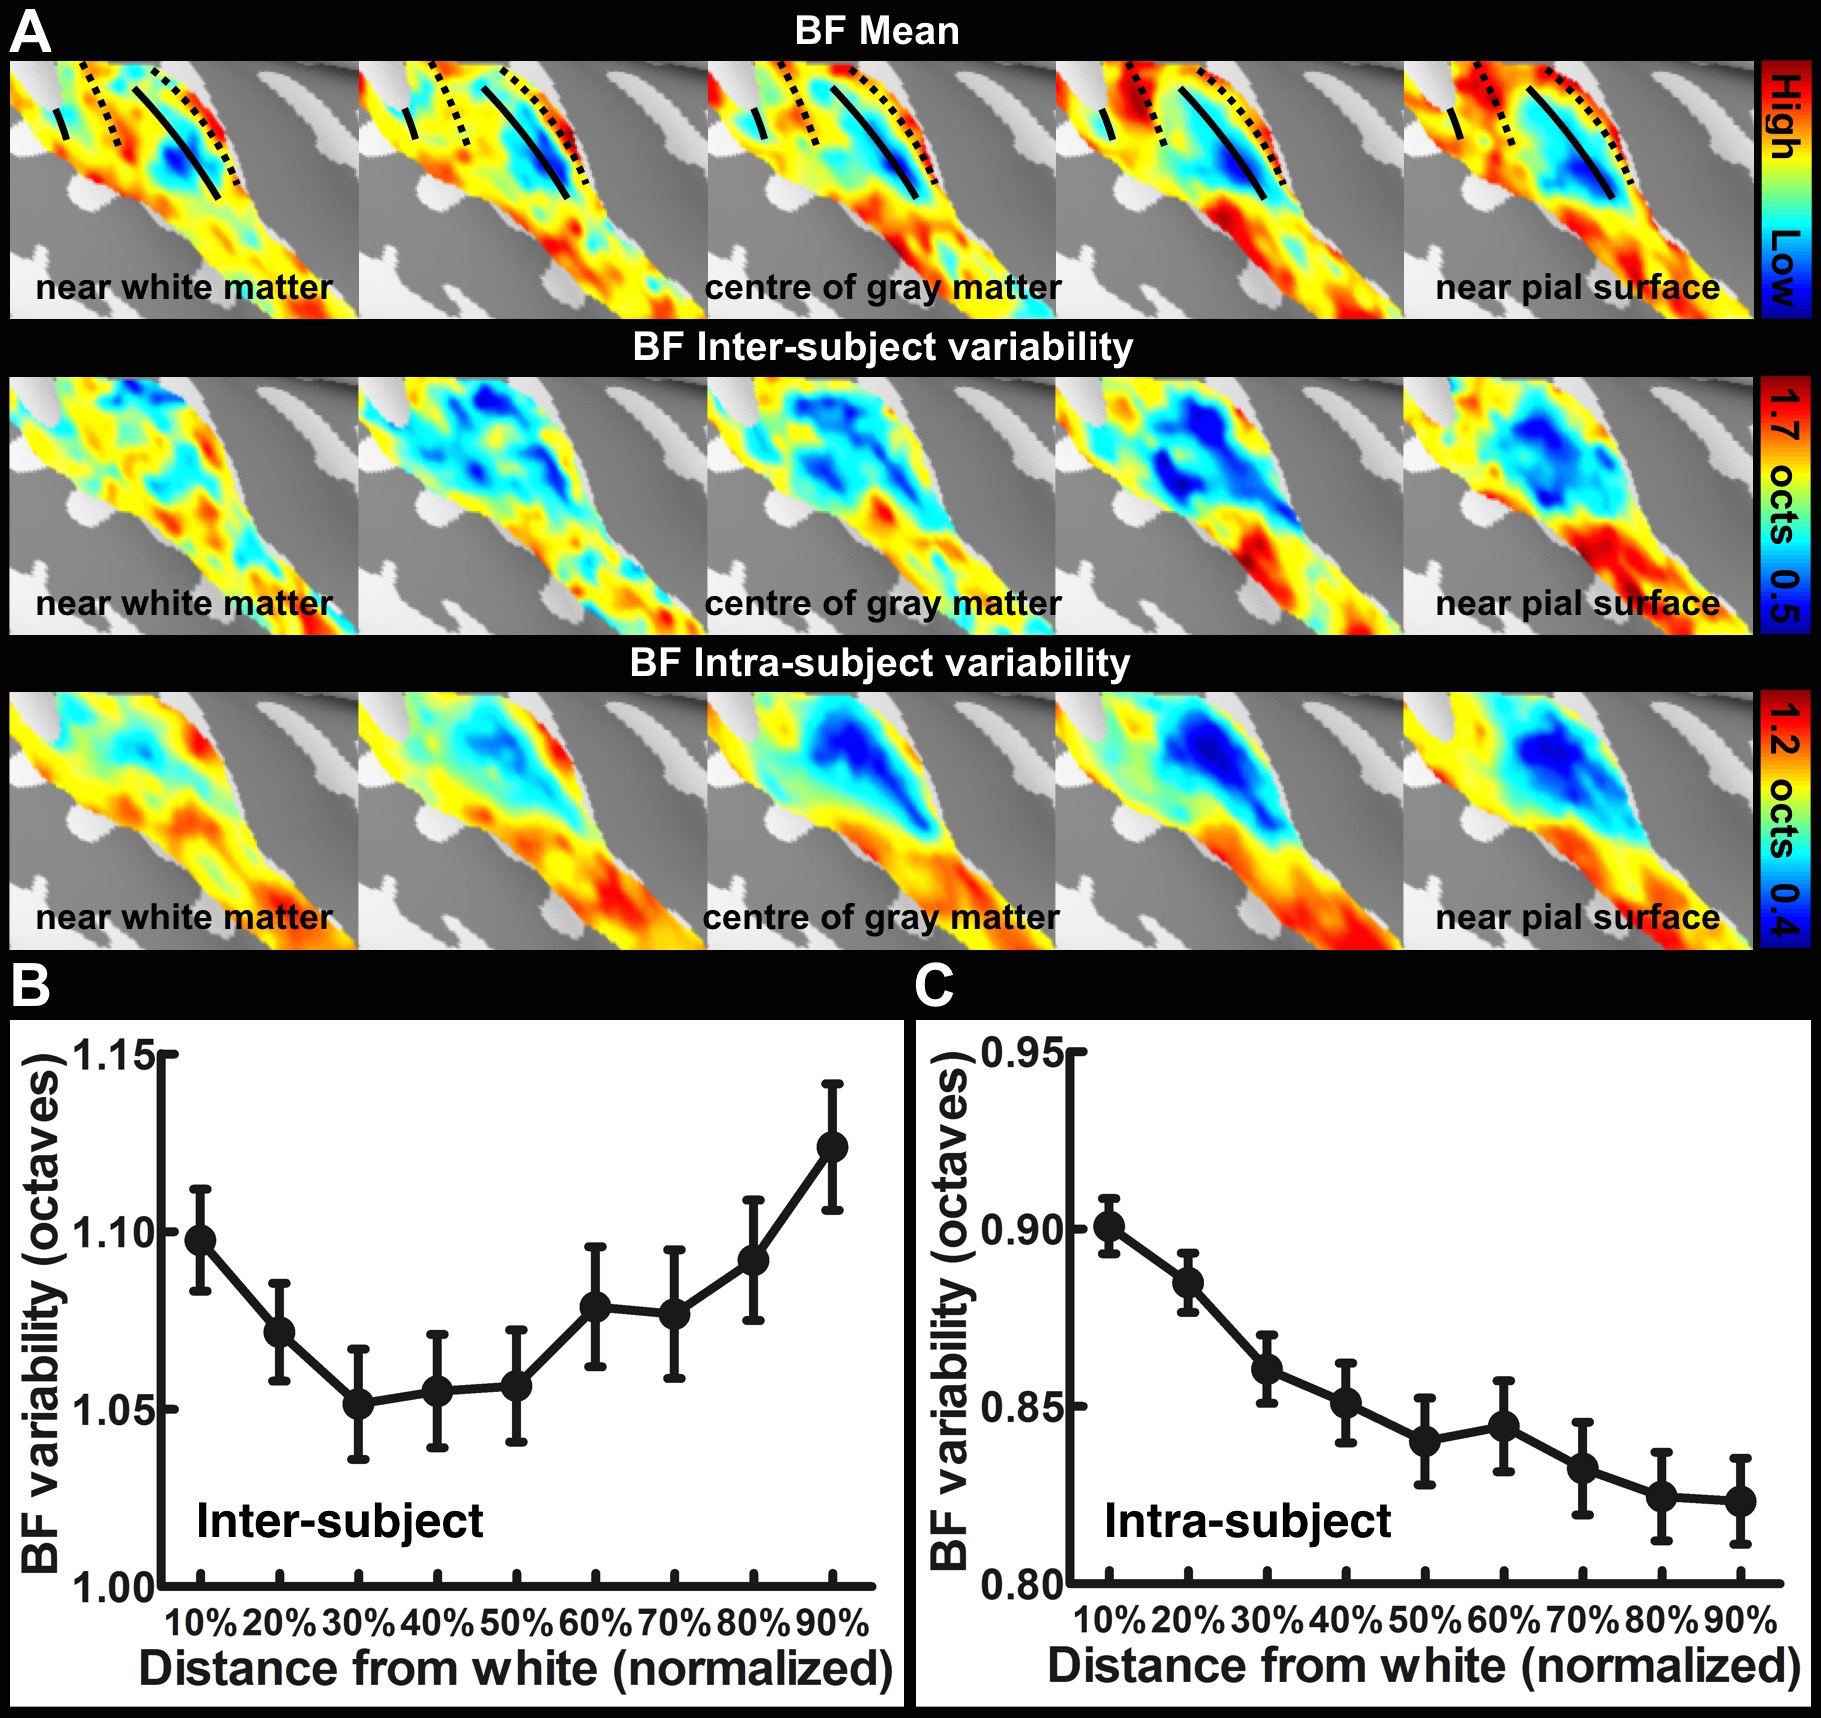
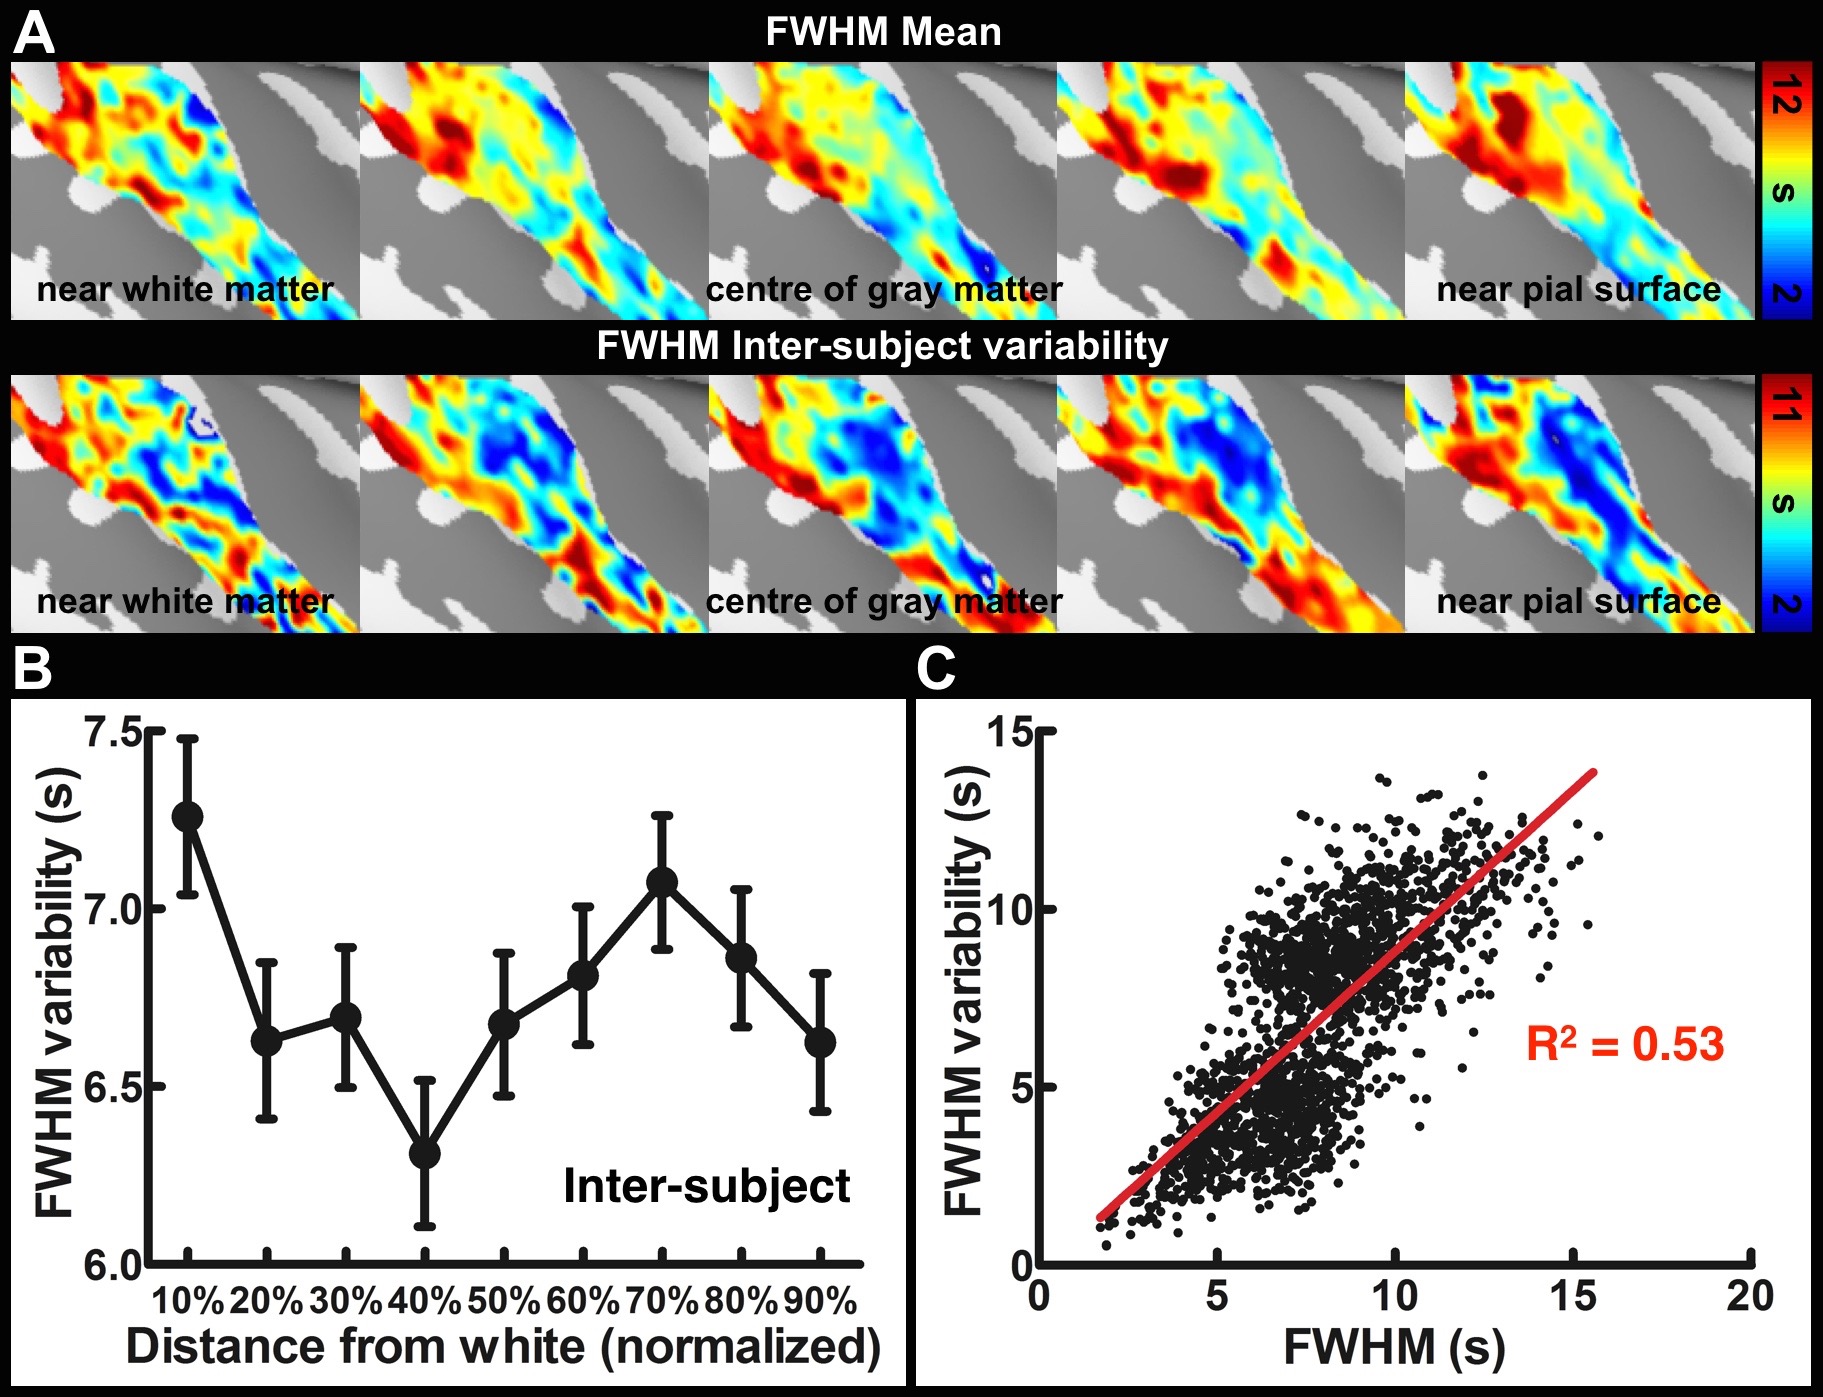
Figure 1 shows one structural image and six intermediate cortical surfaces from the white matter to the pial surface in one representative subject. Figure 2A shows the auditory cortex ROI (averaged correlation Z > 3.28, p < 0.001). Figure 2B shows the averaged cortical thickness map from our subjects. Quantitative the average thickness at the ROI was 3.3±0.2 mm, more than two voxels (1.5x1.5x1.5 mm3) across cortical layers in the auditory cortex. Figure 3A shows the mean, inter-subject variability and intra-subject variability of the best frequency (BF) at five intermediate surfaces. The tonotopic maps show a clear mirror-symmetric high (dotted line)-low (solid line)-high frequency gradient perpendicular to the Heschl’s gyrus (HG), and are almost constant across cortical depths. In contrast, both the inter-subject and intra-subject variability profiles show significant differences across layers (one-way ANOVA, p < 0.05) that the minimum is at the middle and the superficial layer, respectively (Figure 3B, C). Figure 4A shows the mean and inter-subject variability of the tuning width at five intermediate surfaces. The inter-subject variability is found the lowest at the middle layer (Figure 4B). The tuning width and its inter-subject variability are significantly correlated between each other (p < 0.0001, Figure 4C), indicating that locations in the auditory cortex with finer frequency tuning have smaller inter-subject variability.Discussion
Our results corroborated with previous studies16,18 by showing the superficial layer of the auditory cortex has the minimal intra-subject variability and maximal inter-subject variability, potentially due to the increasing BOLD signals towards the pial surface but higher venous vasculature variability across subjects. However, the middle layer has the least inter-subject variabiilty of both tonotopic representation and frequency tuning width, suggesting a more specific frequency preference and selectivity. This was consistent with neurophysiological animal studies that the granular layer has the highest specificity of frequency tuning organization10,21,22. Our results demonstrated the feasibility of measuring high spatial resolution fMRI across cortical layers at 3T with optimized receivers to compensate the SNR to be obtained at a higher field.Acknowledgements
This work was partially supported by Ministry of Science and Technology, Taiwan (103-2628-B-002-002-MY3, 105-2221-E-002-104), and the Academy of Finland (No. 298131).References
1. Hackett TA, Stepniewska I, & Kaas JH (1998) Subdivisions of auditory cortex and ipsilateral cortical connections of the parabelt auditory cortex in macaque monkeys. J Comp Neurol 394(4):475-495.
2. Rauschecker JP (1998) Cortical processing of complex sounds. Curr Opin Neurobiol 8(4):516-521.
3. Kaas JH, Hackett TA, & Tramo MJ (1999) Auditory processing in primate cerebral cortex. Curr Opin Neurobiol 9(2):164-170.
4. Kaas JH & Hackett TA (2000) Subdivisions of auditory cortex and processing streams in primates. Proc Natl Acad Sci USA 97(22):11793-11799.
5. Recanzone GH & Sutter ML (2008) The biological basis of audition. Annu Rev Psychol 59:119-142.
6. Kusmierek P & Rauschecker JP (2009) Functional specialization of medial auditory belt cortex in the alert rhesus monkey. J Neurophysiol 102(3):1606-1622.
7. Woods DL, et al. (2010) Functional properties of human auditory cortical fields. Front Syst Neurosci 4:155.
8. Phillips DP & Irvine DR (1981) Responses of single neurons in physiologically defined primary auditory cortex (AI) of the cat: frequency tuning and responses to intensity. J Neurophysiol 45(1):48-58.
9. Atencio CA & Schreiner CE (2010) Laminar diversity of dynamic sound processing in cat primary auditory cortex. J Neurophysiol 103(1):192-205.
10. Sugimoto S, Sakurada M, Horikawa J, & Taniguchi I (1997) The columnar and layer-specific response properties of neurons in the primary auditory cortex of Mongolian gerbils. Hear Res 112(1-2):175-185.
11. Atencio CA, Sharpee TO, & Schreiner CE (2009) Hierarchical computation in the canonical auditory cortical circuit. Proc Natl Acad Sci USA 106(51):21894-21899.
12. Reser DH, Fishman YI, Arezzo JC, & Steinschneider M (2000) Binaural interactions in primary auditory cortex of the awake macaque. Cereb Cortex 10(6):574-584.
13. Linden JF & Schreiner CE (2003) Columnar transformations in auditory cortex? a comparison to visual and somatosensory cortices. Cereb Cortex 13(1):83-89.
14. Fischl B & Dale AM (2000) Measuring the thickness of the human cerebral cortex from magnetic resonance images. Proc Natl Acad Sci USA 97(20):11050-11055.
15. Koopmans PJ, Orzada S, Barth M, & Norris DG (2009) Distinguishing pial and laminar gradient-echo BOLD signals at 7 Tesla. Proc ISMRM 17:1558 [Abstract].
16. Polimeni JR, Fischl B, Greve DN, & Wald LL (2010) Laminar analysis of 7 T BOLD using an imposed spatial activation pattern in human V1. Neuroimage 52(4):1334-1346.
17. De Martino F, et al. (2015) Frequency preference and attention effects across cortical depths in the human primary auditory cortex. Proc Natl Acad Sci USA 112(52):16036-16041.
18. Ahveninen J, et al. (2016) Intracortical depth analyses of frequency-sensitive regions of human auditory cortex using 7TfMRI. Neuroimage 143:116-127.
19. Wu PY, Chu YH, Tsai SY, Kuo WJ, & Lin FH (2016) High spatial resolution functional imaging of human temporal lobe cortical layers at 3T. Proc ISMRM 24: 3515 [Abstract].
20. Striem-Amit E, Hertz U, & Amedi A (2011) Extensive cochleotopic mapping of human auditory cortical fields obtained with phase-encoding fMRI. PLoS One 6(3):e17832.
21. Guo W, et al. (2012) Robustness of cortical topography across fields, laminae, anesthetic states, and neurophysiological signal types. J Neurosci 32(27):9159-9172.
22. Kanold PO, Nelken I, Polley DB (2014) Local versus global scales of organization in auditory cortex. Trends Neurosci 37:502-510.
Figures