5240
A more accurate account of the effect of k-space sampling and signal decay on the effective spatial resolution in functional MRI1University of Tübingen, Tübingen, Germany, 2Center for Magnetic Resonance Research, University of Minnesota, Minneapolis, MN, United States, 3Montreal Neurological Institute, McGill University, Montreal, QC, Canada, 4Center for Magnetic Resonance Research, University of Minnesota, MN, United States
Synopsis
We show that the magnitude PSF fails to accurately represent the true effects of k-space sampling and signal decay. As an alternative, we propose to model fMRI with separate MR sampling and signal decay effects. We approximate the latter as a convolution with a Gaussian PSF or, if the effect is that of high-pass filtering, as reversing the effect of a convolution with a Gaussian PSF. At 7T signal decay in SE has a moderate blurring effect (FWHM = 0.89 voxels). Gradient‐Echo acts as a high‐pass filter, reversing blurring with FWHM = 0.59 voxels.
Introduction
The effects of k-space sampling and signal decay on the effective spatial resolution of MRI and fMRI are commonly assessed by means of the magnitude point-spread function (PSF), defined as the absolute values (magnitudes) of the complex MR imaging PSF1-6. It is commonly assumed that this magnitude PSF signifies blurring, which can be quantified by its full-width at half-maximum (FWHM). However, the magnitude PSF fails to accurately represent the true effects of k-space sampling and signal decay.
Firstly, a substantial part of the width of the magnitude PSF is due to MRI sampling per se. This part is independent of any signal decay and its effect depends on the spatial frequency composition of the imaged object. Therefore, it cannot always be expected to introduce blurring.
Secondly, MRI reconstruction is typically followed by taking the absolute values (magnitude image) of the reconstructed complex image. This introduces a non-linear stage into the process of image formation. The complex imaging PSF does not fully describe this process, since it does not reflect the stage of taking the magnitude image. Its corresponding magnitude PSF fails to correctly describe this process, since convolving the original pattern with the magnitude PSF is different from the true process of taking the absolute following a convolution with the complex imaging PSF.
Lastly, signal decay can have not only a blurring, but also a high-pass filtering effect. This cannot be reflected by the strictly positive width of the magnitude PSF.
Methods
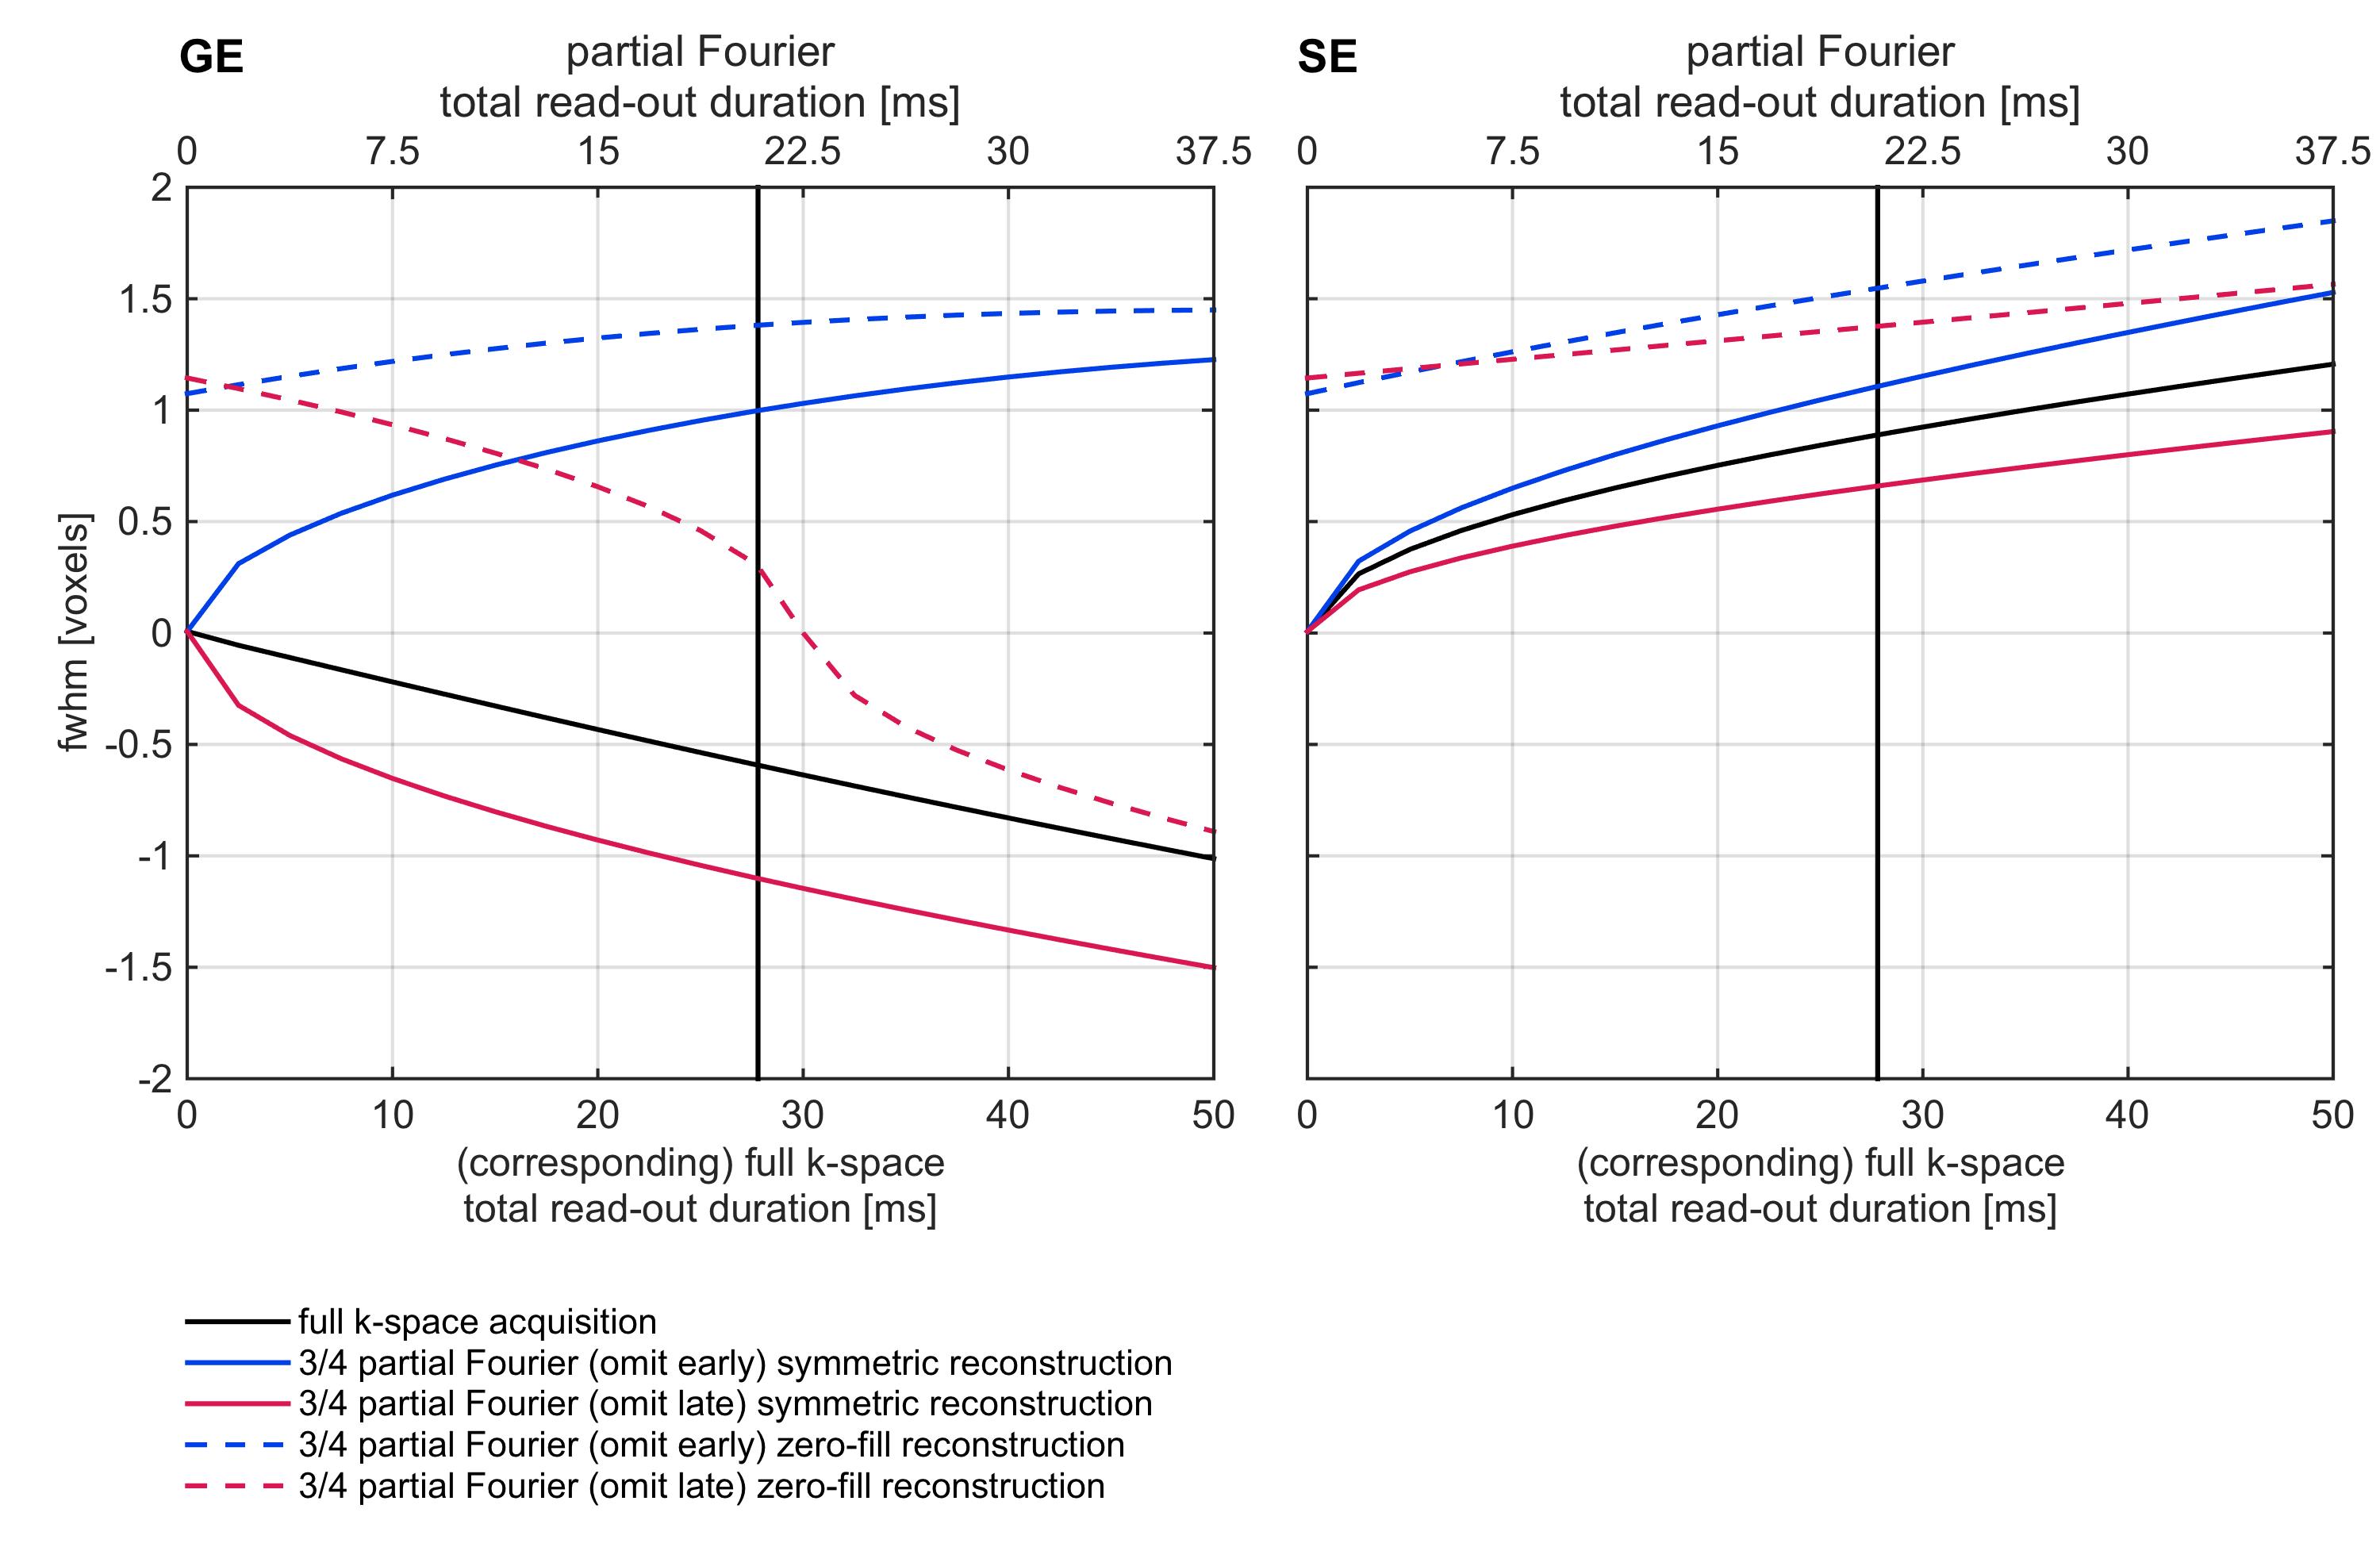
We simulated $$$T_2/T^*_2$$$ decay of GE and SE EPI at 7T and MR sampling of simulated realistic columnar patterns7,12. If not stated otherwise, a total read-out time of 27.8 ms for the full k-space acquisition using 32 phase-encode steps was assumed. Full k-space acquisition and different partial Fourier acquisition and reconstruction schemes were simulated.
Linear approximations to the complete MR imaging process in the form of modulation-transfer functions (MTFs) were calculated as a function of total read-out duration and acquisition type. Gaussian functions were fitted to these MTFs and their inverses. The Gaussian Fourier transform of the fit with the higher R2 was computed. This Gaussian, representing a blurring kernel, was used to characterize the effects of signal decay.
Results
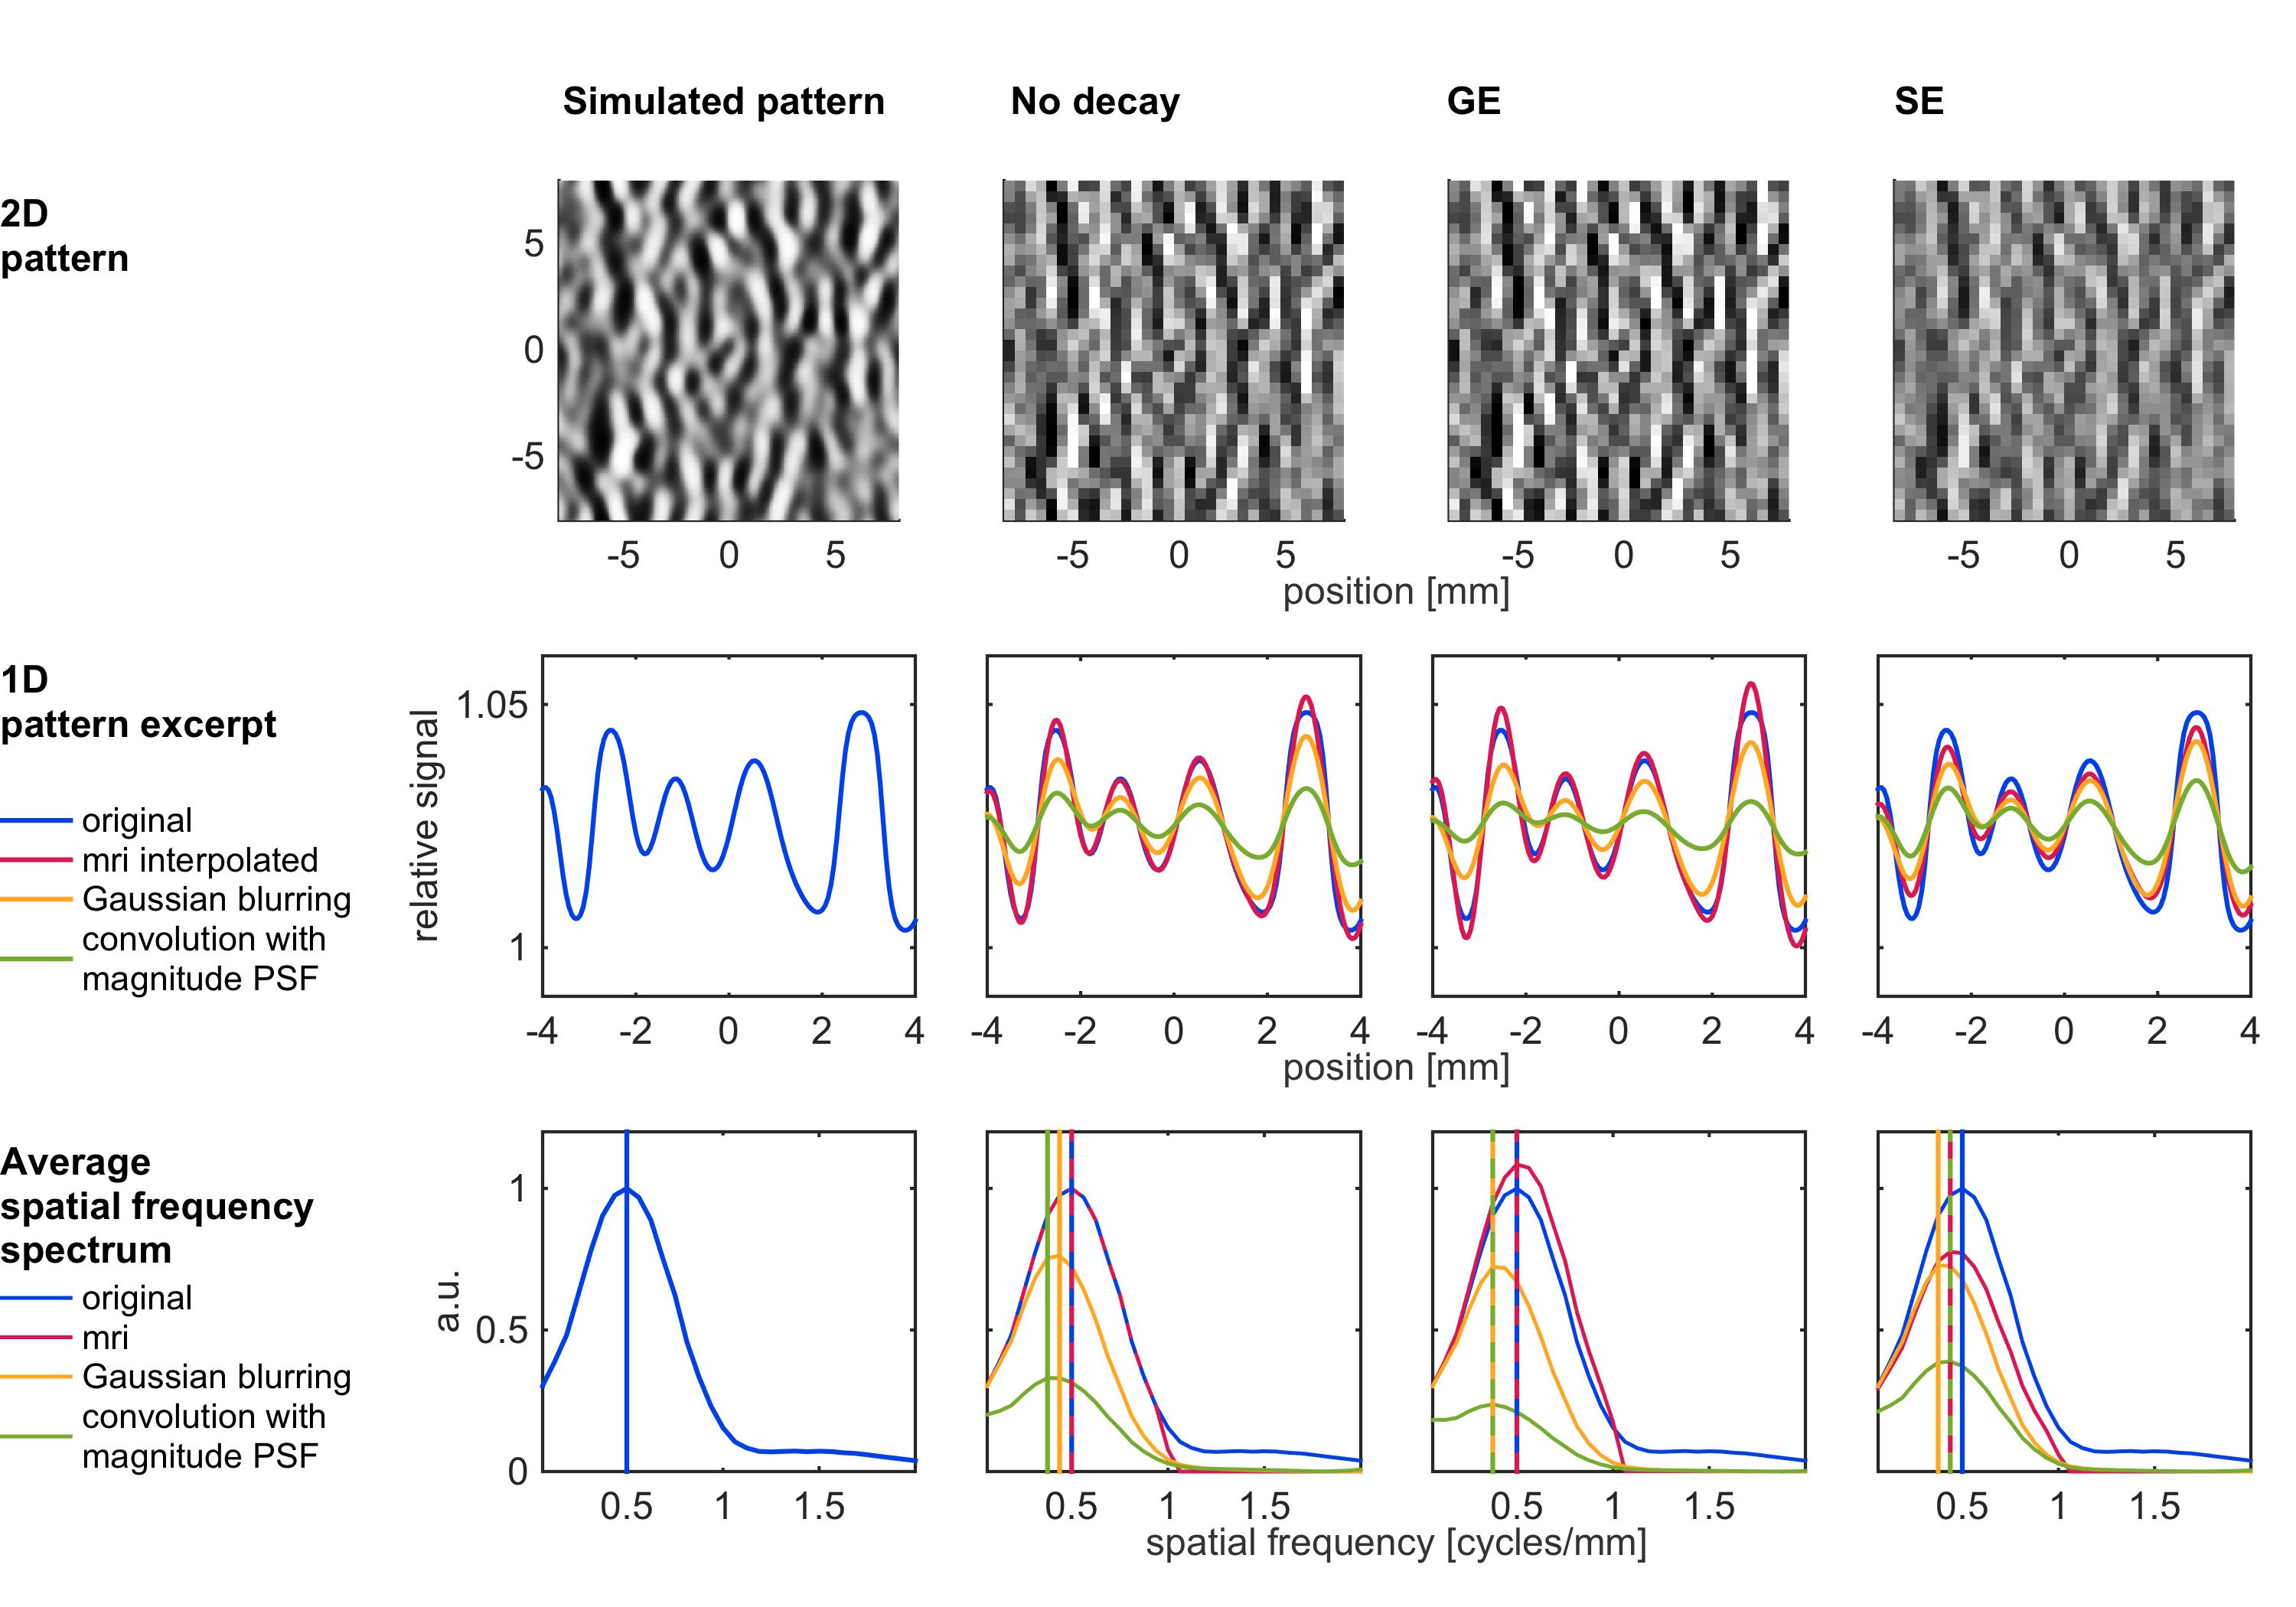
For MR imaging with no signal decay, the imaged pattern was very similar to the original pattern (Figure 1). Note, however, that the FWHM of the magnitude PSF corresponding to MRI with no signal decay was 0.6 mm. GE imaging had the effect of a moderate high-pass filter. Also this result could not be expected by simply considering the positive FWHM of the magnitude PSF, which was 0.67 mm. The SE image was slightly blurred. However, convolutions of the original pattern with Gaussian PSFs of the same widths as those computed from the SE magnitude PSFs and convolutions with the SE magnitude PSF itself resulted in stronger blurring.
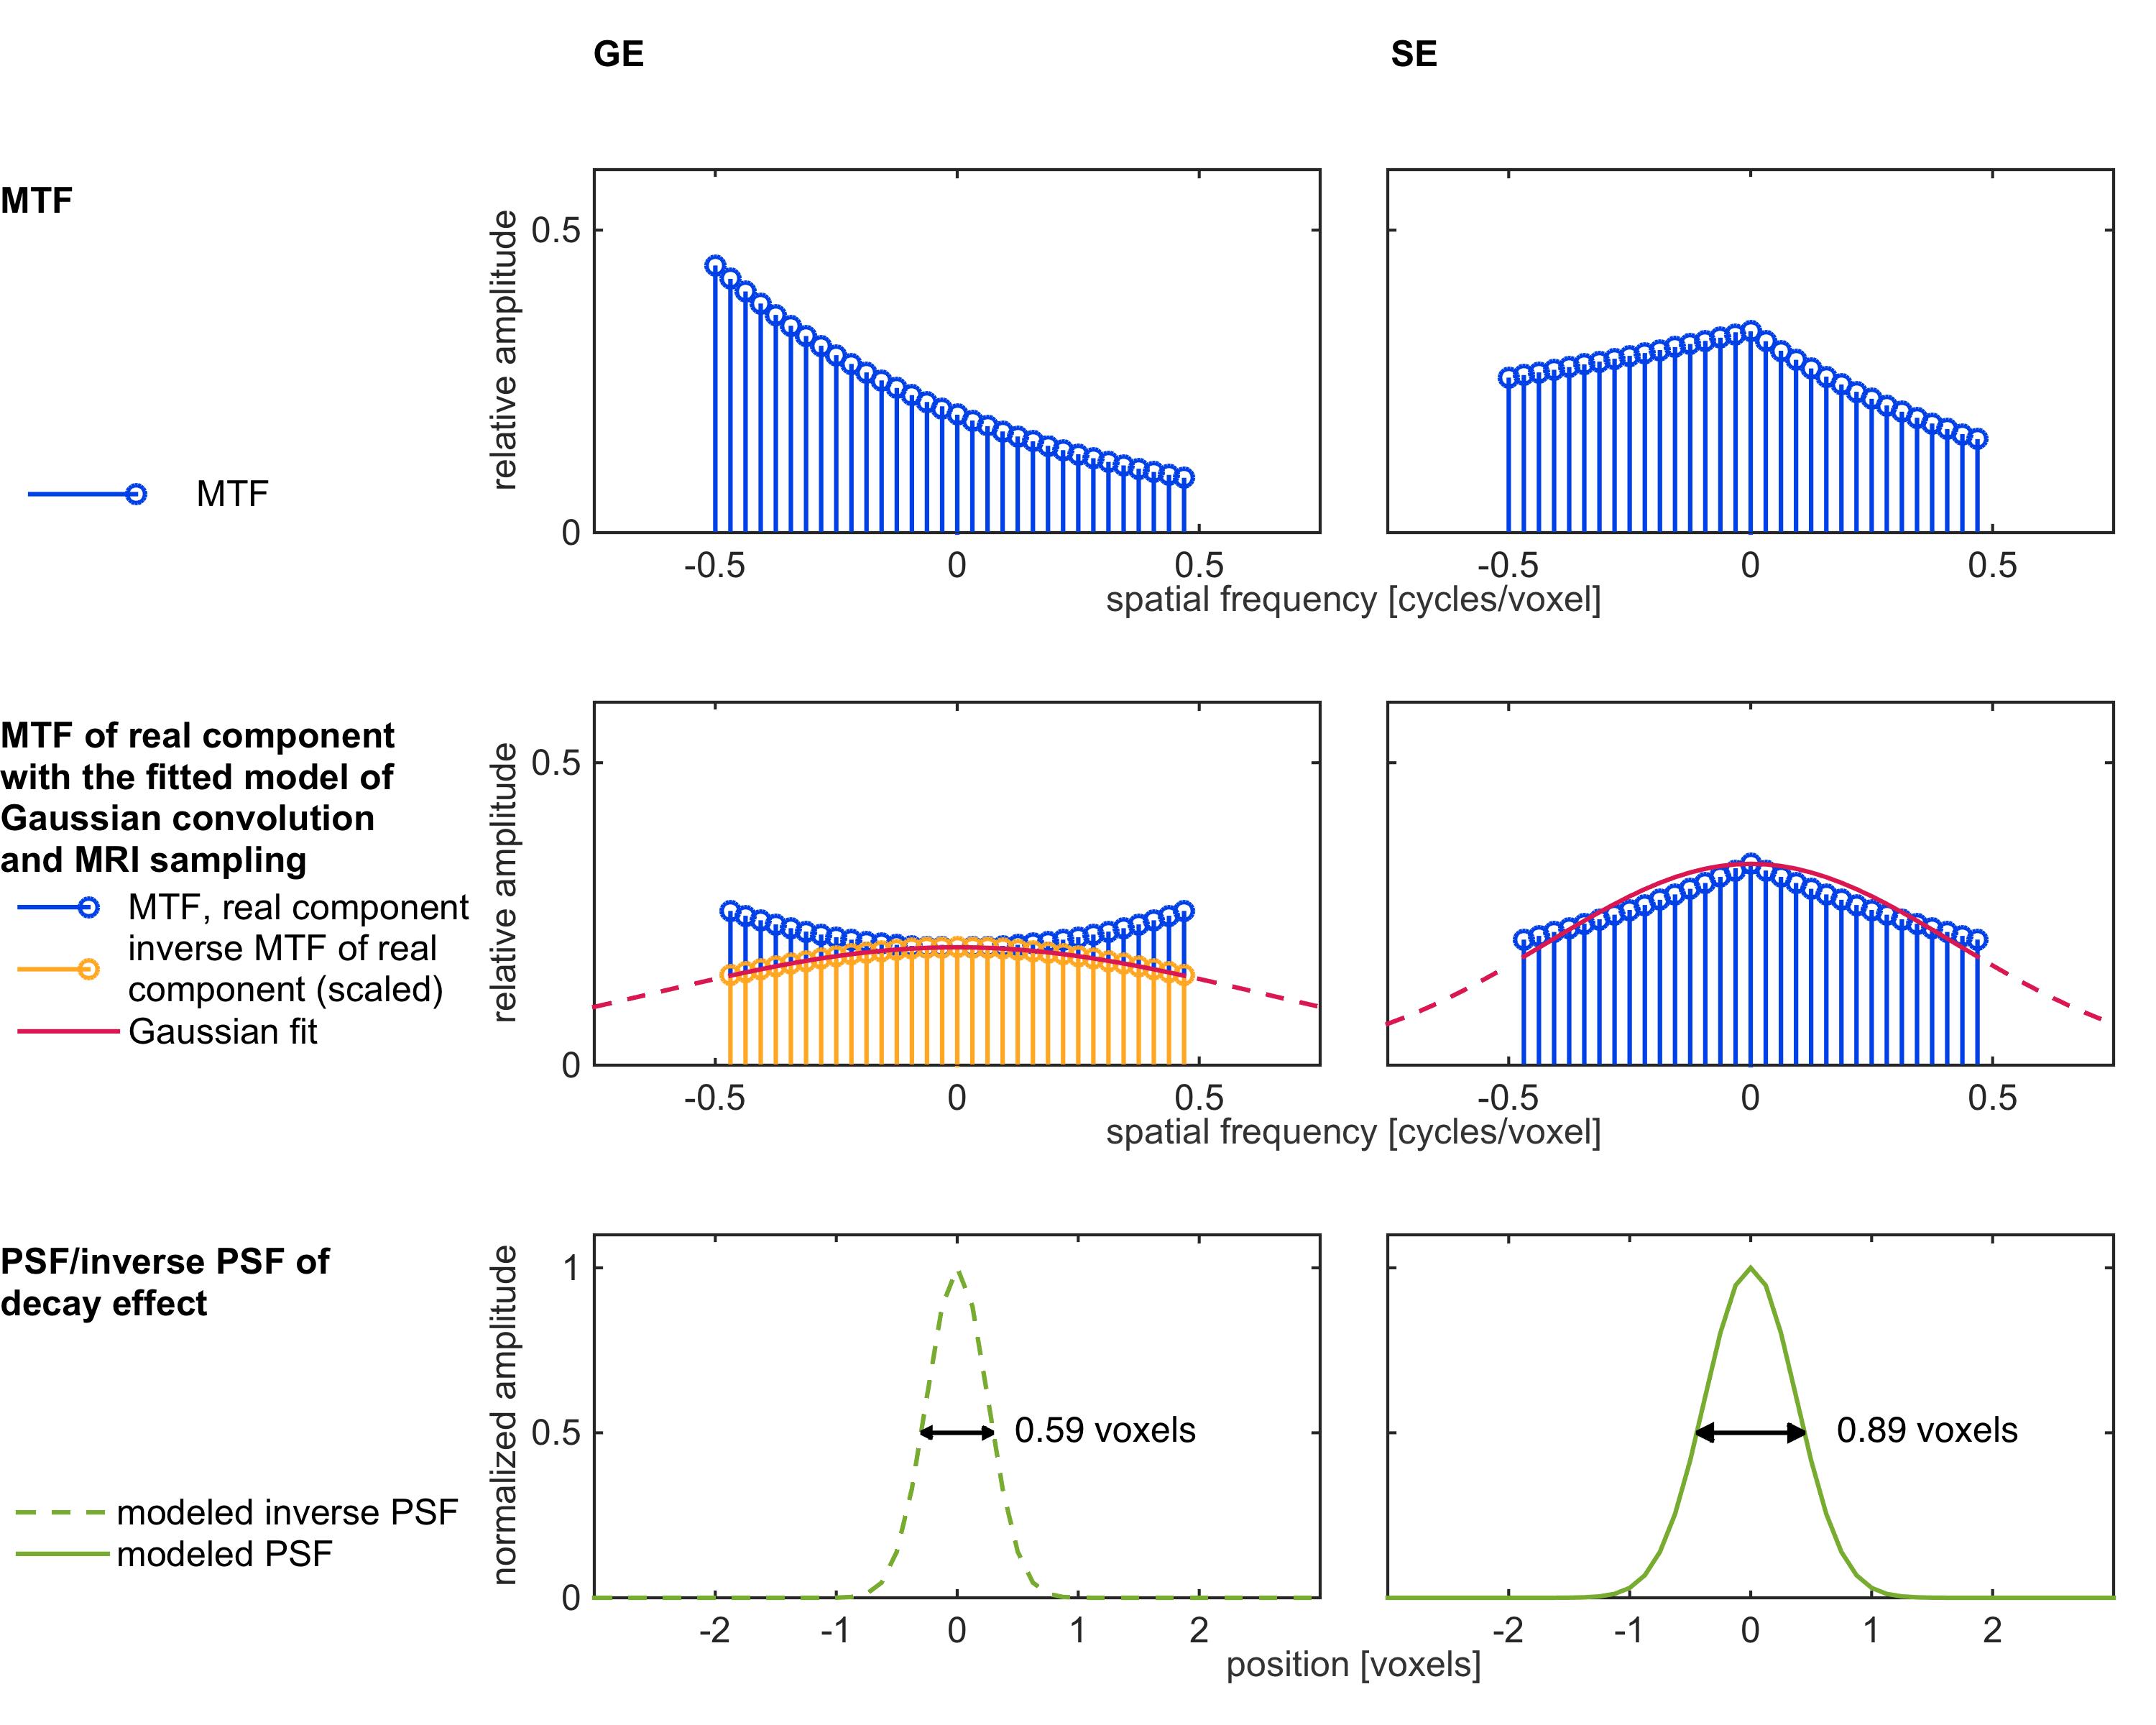
In order to characterize the complete non-linear MRI process using a PSF, we propose an alternative method. First we approximated the MRI process linearly by computing its functional derivative. For small deviations from a spatially constant baseline pattern the resulting linear approximation is identical to a convolution with the real component of the complex imaging PSF.
In a second step, we fitted Gaussians to the MTF of the real component of the imaging PSF (and to its inverse; Figure 2). This allowed us to approximate the MRI process as a convolution with a Gaussian PSF or, if the effect is that of high-pass filtering, as reversing the effect of a convolution with a Gaussian PSF, followed by MR sampling with no decay. We found that signal decay in SE has a moderate blurring effect (FWHM = 0.89 voxels, corresponds to 0.44 mm for 0.5 mm wide voxels). In contrast, GE acts as a moderate high-pass filter that can be interpreted as reversing a Gaussian blurring with FWHM = 0.59 voxels (0.30 mm for 0.5 mm wide voxels). Figure 3 shows further results for a range of total read-out durations as well as for different partial Fourier acquisition and reconstruction schemes.
Discussion
The magnitude PSF describes the absolute level of influence that neighboring positions in the original pattern have on each other’s value in the image. However, it fails to characterize the nature of this influence (e.g. blurring or high-pass filtering). While our approach is an approximation, it results in an intuitive characterization of the blurring associated with signal decay and makes it possible to compare it to previously reported FWHMs of PSFs associated with the entire BOLD fMRI process (BOLD PSF)8-11.Acknowledgements
This work was supported by grants from the Natural Sciences and Engineering Research Council of Canada (AS, NSERC Discovery grants RGPIN 375457-09 and RGPIN-2015-05103).References
1. Haacke, M. E. The effects of finite sampling in spin-echo or field-echo magnetic resonance imaging. Magn Reson Med 4, 407–421 (1987).
2. Oshio, K. & Singh, M. A computer simulation of T2 decay effects in echo planar imaging. Magn Reson Med 11, 389–397 (1989).
3. Farzaneh, F., Riederer, S. J. & Pelc, N. J. Analysis of T2 limitations and off-resonance effects on spatial resolution and artifacts in echo-planar imaging. Magn Reson Med 14, 123–139 (1990).
4. Constable, R. T. & Gore, J. C. The loss of small objects in variable TE imaging: implications for FSE, RARE, and EPI. Magn Reson Med 28, 9–24 (1992).
5. Qin, Q. Point spread functions of the T2 decay in k-space trajectories with long echo train. Magn Reson Imaging 30, 1134–1142 (2012).
6. Kemper, V. G. et al. Sub-millimeter T2 weighted fMRI at 7 T: comparison of 3D-GRASE and 2D SE-EPI. Front Neurosci 9, 163 (2015).
7. Rojer, A. & Schwartz, E. Cat and monkey cortical columnar patterns modeled by bandpass-filtered 2D white noise. Biol Cybern 62, 381–391 (1990).
8.Engel, S. A., Glover, G. H. & Wandell, B. A. Retinotopic organization in human visual cortex and the spatial precision of functional MRI. Cereb Cortex 7, 181–192 (1997).
9. Parkes, L. M. et al. Quantifying the spatial resolution of the gradient echo and spin echo BOLD response at 3 Tesla. Magn Reson Med 54, 1465–1472 (2005).
10. Shmuel, A., Yacoub, E., Chaimow, D., Logothetis, N. K. & Ugurbil, K. Spatio-temporal point-spread function of fMRI signal in human gray matter at 7 Tesla. Neuroimage 35, 539–552 (2007).
11. Chaimow, D., Yacoub, E., Ugurbil, K. & Shmuel, A. Spatial specificity of the functional MRI blood oxygenation response relative to metabolic activity. in (2016).
12. Chaimow, D., Yacoub, E., Ugurbil, K., Shmuel, A., 2011. Modeling and analysis of mechanisms underlying fMRI-based decoding of information conveyed in cortical columns. Neuroimage 56, 627–642. doi:10.1016/j.neuroimage.2010.09.037
Figures