5236
Comparison of Carotid Arterial Signal Automatically Extracted from fMRI Data and Pulse Oximetry1Radiology, Mayo Clinic, Rochester, MN, United States
Synopsis
Using only imaging data from an fMRI time series carotid cardiac cycle information may be automatically extracted. By merging data across slices "faster than TR" sampling is achieved. The resulting time series agree with pulse oximetry (PO) data. The distribution of relative peak times between PO and fMRI has standard deviation of around 40ms. The fMRI data was quite reliable with cardiac signal observed for all but two of approximately 3000 seconds; PO data was much less reliable.
PURPOSE
The use of pulse oximetry (PO) in multi-center trials for physiological noise correction in functional MRI (fMRI) presents challenges. Typically managed as “sidecar” files, PO data can easily be lost. PO data may be corrupted by patient hand motion. Extracting comparable information directly from fMRI time series is of obvious interest. Two issues naively preventing this are 1) finding a clean signal not confounded by functional changes and 2) assuming whole brain coverage at 2-3mm spatial resolution is desired, even simultaneous multi-slice (SMS) acquisitions have an insufficient sampling for commonly encountered heart rates1.
Spatially adjacent slices are not typically temporally adjacent. Exploiting this allows automatic extraction of carotid artery time courses from fMRI time series for heart rates up to approximately 100 BPM using unmodified commercially available SMS acquisitions.
IMAGING AND METHODS
fMRI data were acquired on three healthy volunteers recruited in an IRB-approved study. Each had four five-minute time series; two series using a 20 channel coil and two using a 64 channel coil. Within each coil configuration one image set was acquired with TR 600ms, 2.5mm isotropic resolution and the other with TR 399ms, 3.4mm isotropic resolution. A 50 degree flip angle, TE~30ms, and axial slices covering approximately 160mm S/I were used throughout. Simultaneous multi-slice (SMS) acquisition factor 8 was used with no in-plane acceleration and CAIPI-shift=4. Imaging was done on a Siemens Prisma scanner running software version VD13D with SMS support via vendor WIP 877.
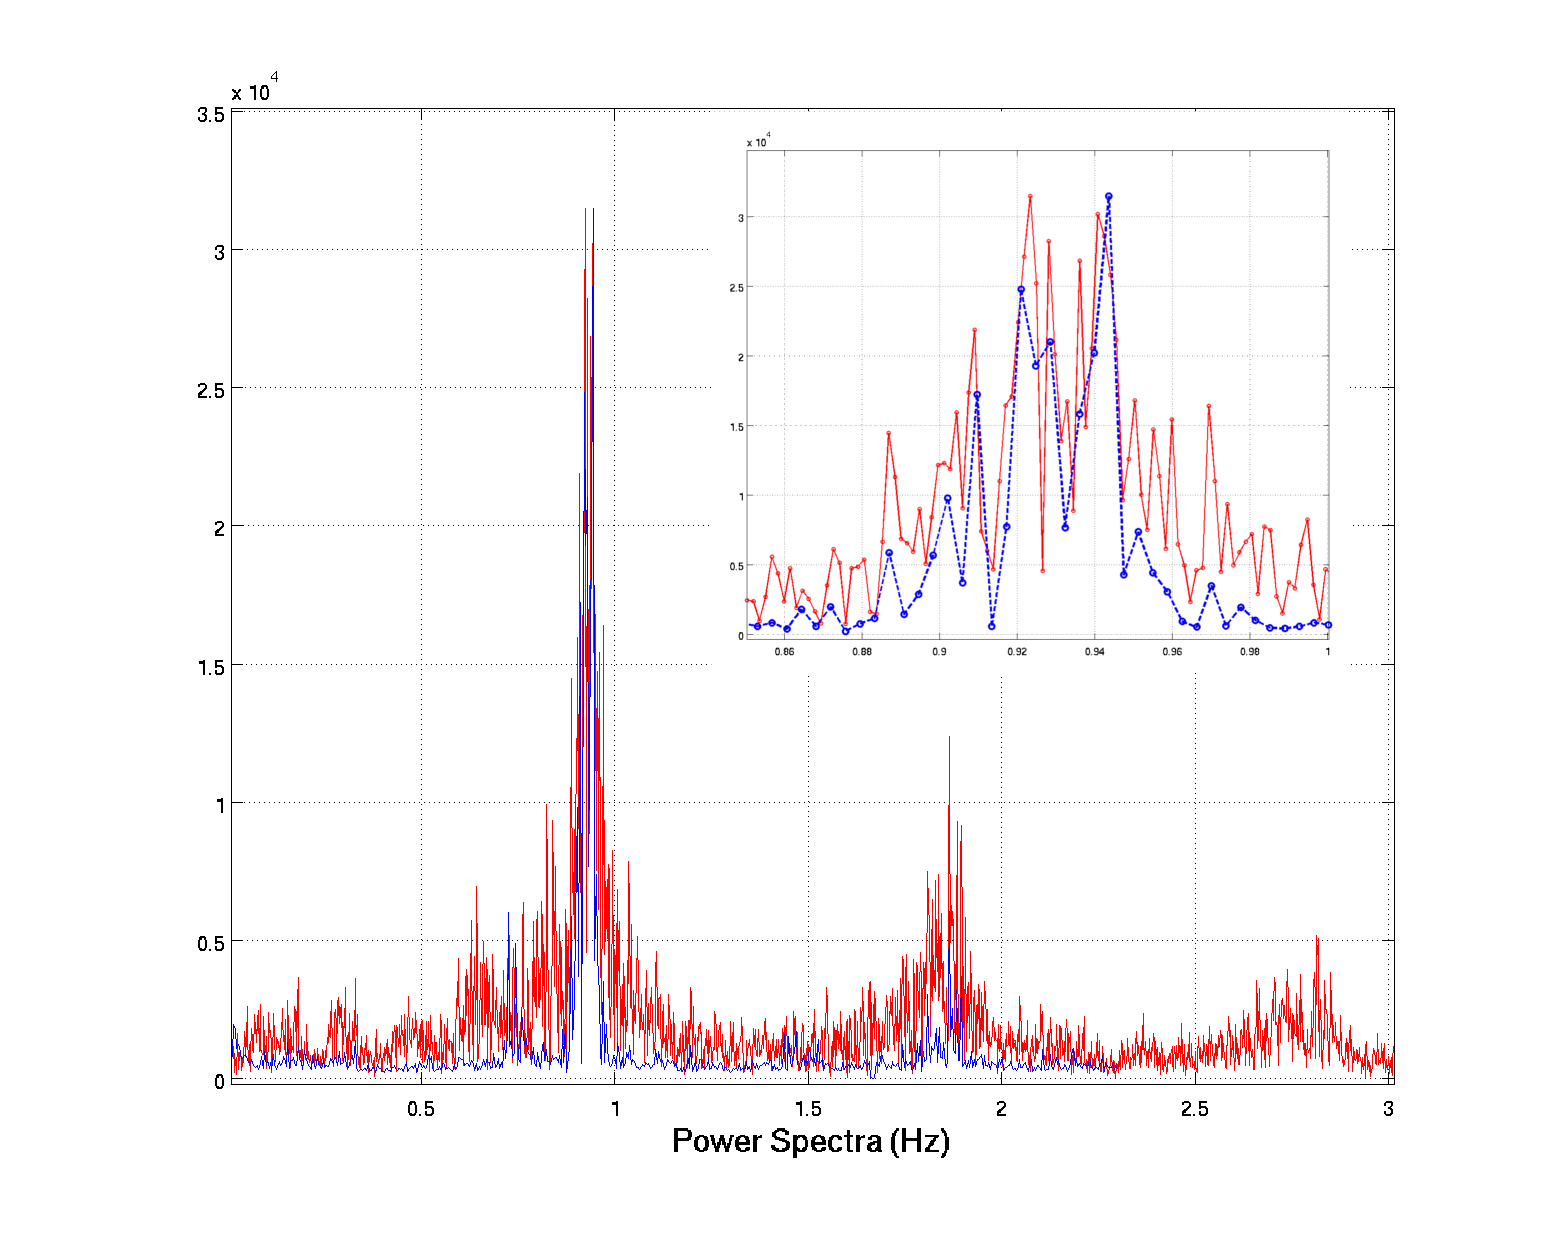
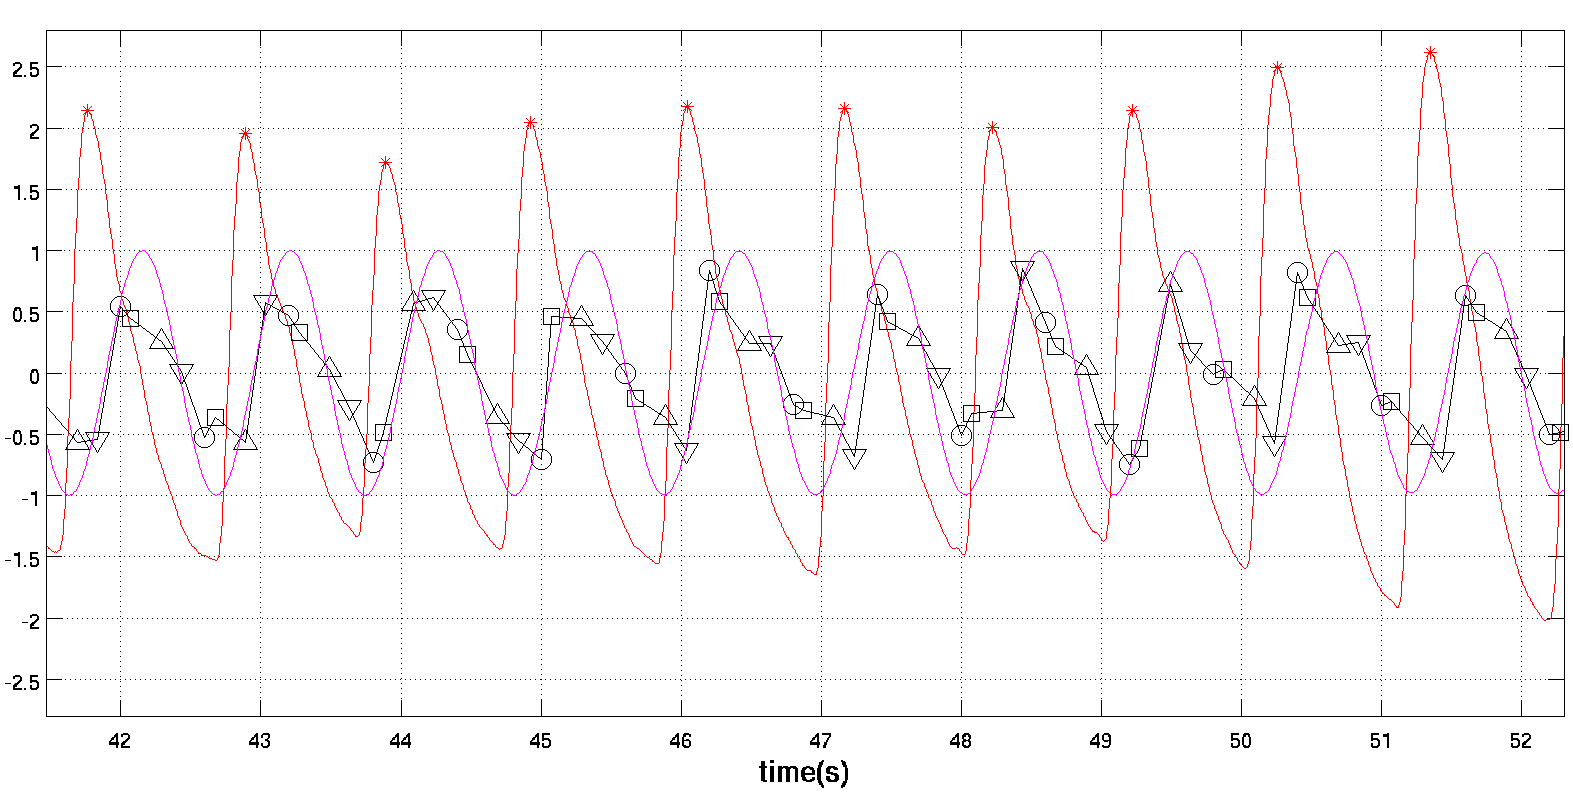
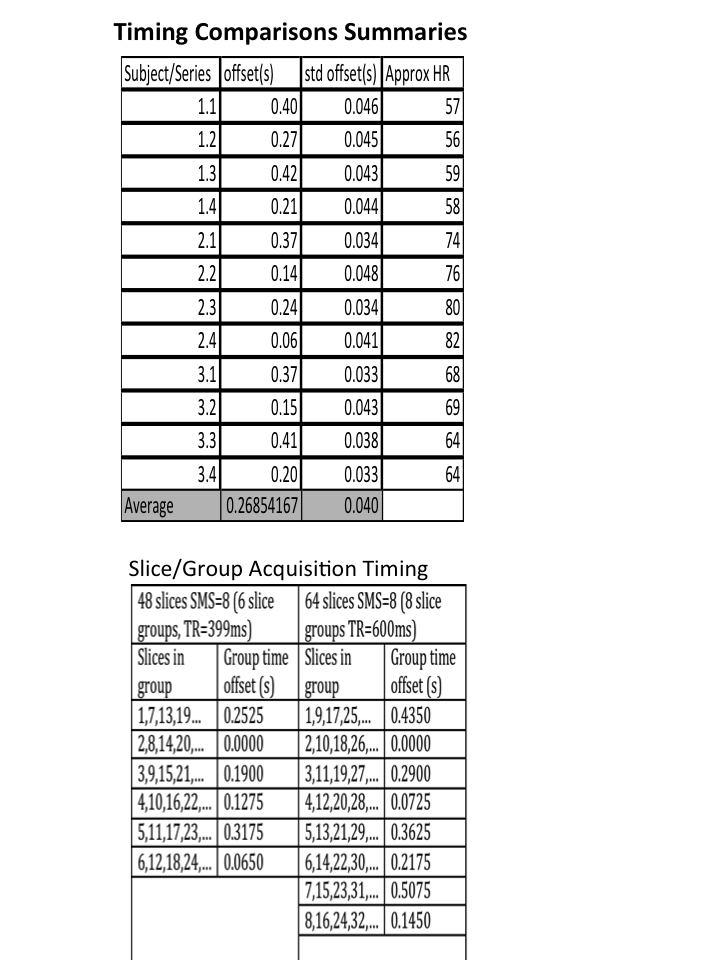
Data from the N=4 of most inferior slices are combined to make a time series with “faster than TR” sampling. After removing the initial five seconds of data, each voxel time series is detrended, set to zero mean and scaled to unit standard deviation. Data across the N-slices are interleaved in time to create a single merged slice. Power spectra are then calculated using a discrete time Fourier transform (DTFT) as the sample times are non-uniform (see Table in Figure 4). The maximum frequency considered in the DTFT is pessimistically taken from the longest inter-sample interval. The power spectrum above a minimum frequency (here 0.75Hz) is summed for each pixel. Pixels with largest sum (here >99.5th percentile) are selected and the time courses averaged. From visible inspection, this automatically selects the carotid and often basilar arteries. A local frequency estimation (LFE) scheme is used to synthesize a smooth approximation of the averaged time course. The peak times in the synthesized time course are compared with the PO peak times.
RESULTS
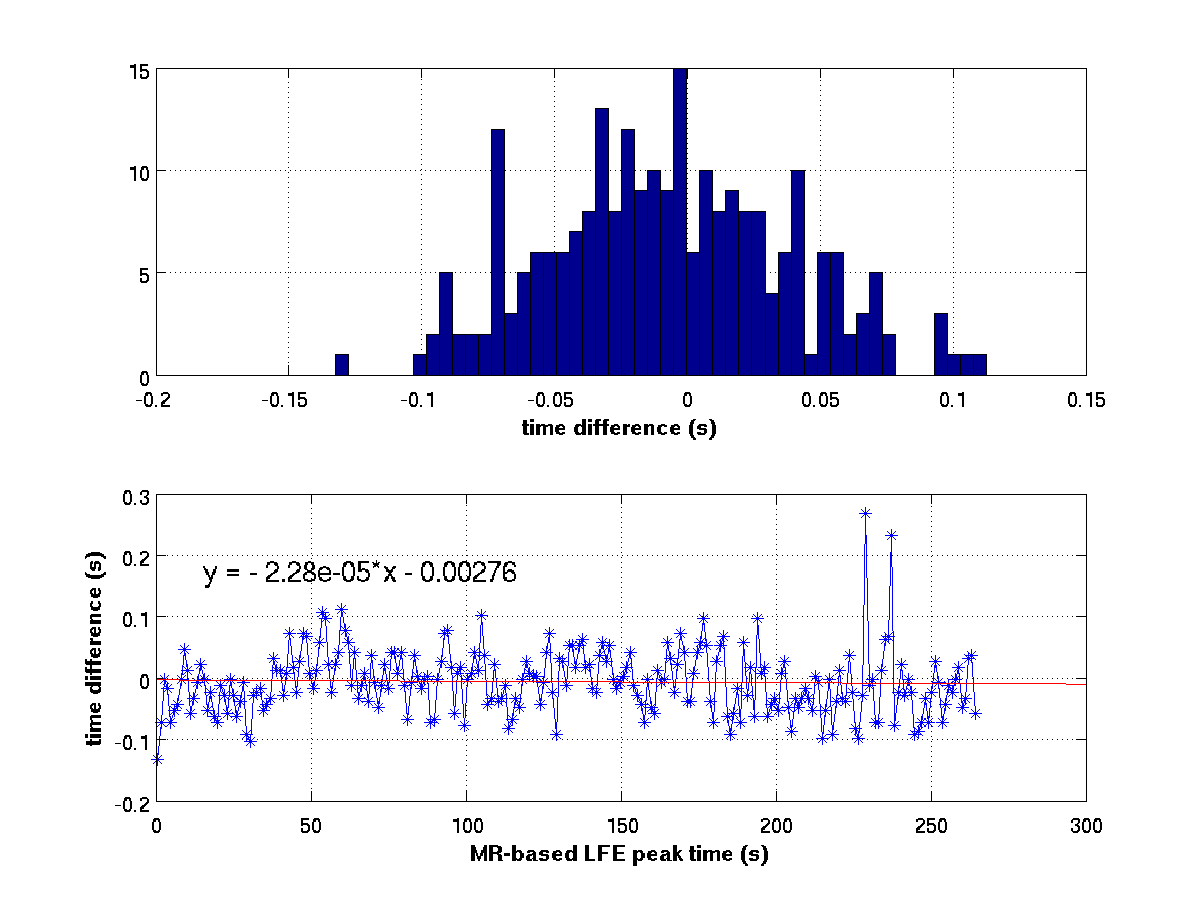
Cardiac signal was observed in all fMRI image data sets. A representative power spectrum from a TR=600ms acquisition is shown in Figure 1 along with corresponding the PO power spectrum. The PO time series, the average selected pixel time course, and the synthesized time course are shown in Figure 2 for a 10s time window. Differences in MR-based and PO-based peak times (Figure 3) have a standard deviation of approximately 40ms. Summary data for all 12 series is presented in Figure 4 along with slice acquisition ordering information.
PO data was sanity checked and three of the traces required manual clean up. Careful (beat by beat) inspection found only one interval of approximately two seconds where the merged MR signal did not have an obvious pulse-like fluctuation.
DISCUSSION
Pulse oximetry adds complexity fMRI data management. These results show that cardiac cycle information may be automatically extracted from fMRI images. Empirically, it appears that the MRI based signal from arteries in the neck is also more reliable.
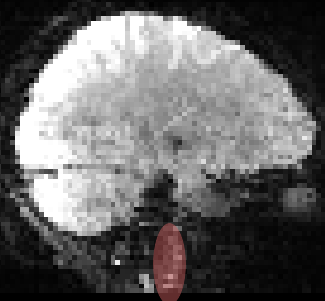
Weaknesses of the current method are the assumption that the carotid arteries are perpendicular to the imaging plane (Figure 5) and simply ignoring the possibility of corruption due to patient motion. Registration and anatomy should be used to drive decisions on what voxels should be merged. The simple-minded intensity normalization also assumes that MRI signal fluctuations are not phase locked with the acquired images.
Clearly there is more structure in the merged MRI time series than is captured in the LFE-base synthetic time series. It is possible, even likely, that the proximity of the carotid arteries to the brain conveys advantages over peripheral PO measurements. Understanding the structure of the MRI carotid artery signal and its implications for physiological noise removal is an area of future work.
CONCLUSION
It is possible to automatically extract reliable cardiac rhythm information from function MRI data sets with no human intervention. The information is comparable to that obtained by pulse oximetry without the need to track additional data beyond the images.Acknowledgements
The authors would like to thank members of the Mayo Clinic Center for Advanced Imaging Research for useful discussions.References
1. S. M. Smith et al., NeuroImage 80, 144-168 (2013).Figures