5232
Quantitative assessment of cerebral venous oxygenation in mouse using T2-Relaxation-Under-Spin-Tagging (TRUST) MRI at 11.7T1Department of Radiology, The Johns Hopkins University, Baltimore, MD, United States
Synopsis
Venous oxygenation level reflects the cerebral metabolic rate of oxygen and its measurement facilitates studies of animal models of diseases. We developed a non-invasive and non-contrast-agent method based on T2-Relaxation-Under-Spin-Tagging (TRUST) to quantify cerebral venous oxygenation in mice at 11.7T. A series of studies were performed to optimize key imaging parameters. This method may prove useful in studies of brain physiology and pathophysiology in animal models.
Purpose
Brain oxygen extraction fraction (OEF) and cerebral metabolic rate of oxygen (CMRO2) are traditionally a niche market of PET imaging, which in itself is a complex procedure and requires the injection/inhalation of three 15O labeled radiotracers as well as continuous arterial blood sampling to measure arterial input function. However, such procedures are not feasible in animal models such as in mice because, among other obstacles, there is simply not enough blood in the animal to be sampled during the experiment. Thus, little is known about oxygen homeostasis in mice in vivo. The present study aims to fill this gap and to develop an MRI technique to quantify cerebral venous oxygenation (Yv), which is a critical step toward measurement of OEF and CMRO2 in live mice. Establishment of non-invasive and non-contrast-agent-based techniques to measure brain physiological parameters such as Yv, OEF, and CMRO2 is expected to be useful for the study of animal models of disease.Method
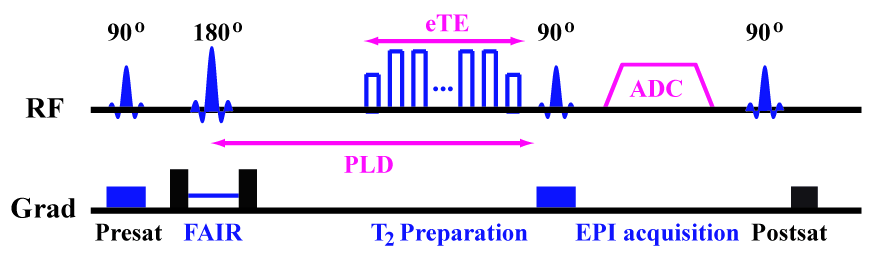
Our approach to measure Yv is based on the T2-Relaxation-Under-Spin-Tagging (TRUST) sequence, developed on humans but never before applied in mice. All experiments were performed on a Bruker 11.7T system. Given the numerous differences between human and mouse imaging in terms of brain size, blood circulation time, field strength, blood flow, and the different blood T2 range at 11.7T, the entire sequence had to be re-optimized. The TRUST sequence has been described previously (Fig. 1). The gist of the sequence is that the spin labeling principle is applied on venous vessels to allow the isolation of pure venous blood signal, the T2 of which is then measured with a series of T2-preparation pulses.1 Blood T2 can then be converted to oxygenation through their well-known relationship.2 Six separate studies were conducted to optimize different parameters of the sequence. (Study I): Optimal imaging slice location was determined by comparing results across 6 locations along the sagittal sinus (N=3 mice); (Study II): Optimal inversion slab thickness was determined by comparing results across 6 slab thickness of 1.5, 2.5, 3.5, 4.5, 6.5, and 8.5 mm (N=3); (Study III): Optimal post-labeling delay (PLD) was determined by comparing 13 PLDs ranging from 200 to 2600 ms (N=3); (Study IV): In terms of acquisition schemes, optimal EPI factor was determined by comparing results using 32, 16, 8, and 4(N=4); (Study V): Optimal TR was determined by comparing 7 TRs of 2, 3.5, 5, 6.5, 8, 10, and 12 s; (Study VI): Sensitivity of the technique was tested by comparing blood T2 (oxygenation) measured under normoxia and hyperoxia conditions (N=2). Other imaging parameters are: FOV=20×15 mm2, matrix=128×128 and slice thickness=0.5 mm.Results and discussion
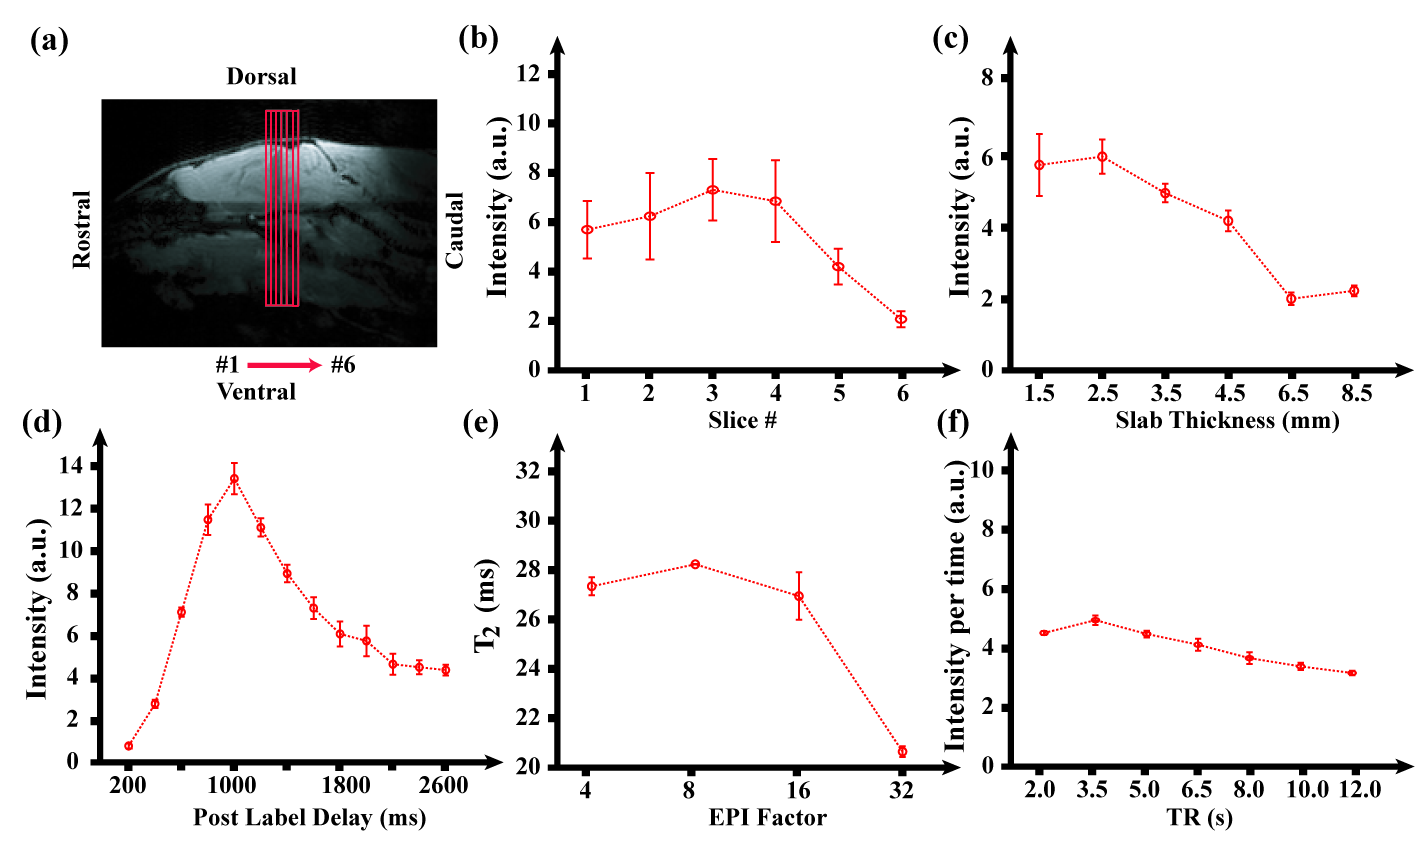
(Study I) Fig. 2a shows the 6 imaging locations we tested, which centered around the sinus confluence (where all the veins merge). Fig. 2b shows the difference signal (i.e. pure vein signal obtained from control-label) as a function of slice location. It was found that the slice corresponding to sinus confluence revealed the highest signal intensity and thus is used as optimal position. (Study II) Fig. 2c shows the difference signal as a function of inversion slab thickness in FAIR module. A thickness of 2.5 mm yielded the highest signal intensity. Thicker slab would not allow sufficient time for the uninverted spin to reach the imaging slice. (Study III) Fig. 2d displays difference signal as a function of PLD. A PLD=1000ms was found to yield the highest signal. (Study IV) Fig. 2e shows blood T2 values measured with different EPI factors. EPI factors of 4, 8, and 16 revealed similar T2 values, while EPI factor of 32 showed under-estimation. Since scan duration is inversely related to EPI factor, a factor of 16 is considered optimal. (Study V) Fig. 2f shows signal per unit time (i.e. signal/sqrt(TR)) vs. TR to evaluate the time efficiency, and a TR of 3.5s revealed the highest value. (Study VI) Using the optimized protocol, blood T2 were found to be 26.3 ± 2.1 and 31.6 ± 1.6 ms when breathing room air and 100% oxygen, respectively (N=2), which correspond to an oxygenation-level of 74.0 ± 2.9% to 82.3 ± 2.3%, respectively. Note that isoflurane may suppression neural metabolism, resulting in a higher venous oxygenation. Our further study will focus on the effects of anesthesia on cerebral physiology.Conclusion
We develop a non-invasive and non-contrast method to quantify cerebral oxygenation in mice at 11.7T. A series of studies were performed to optimize key imaging parameters. This method may prove useful in studies of brain physiology and pathophysiology in animal models.Acknowledgements
This work is partly supported by NIH grants R01 MH084021 and P41 EB015909.References
1. Lu H, Ge Y. Quantitative evaluation of oxygenation in venous vessels using T2-Relaxation-Under-Spin-Tagging MRI. Magn. Reson. Med. 2008; 60 (2): 357-363. 2. Lin A, Qin Q, Zhao X, Duong T. Blood longitudinal (T1) and transverse (T2) relaxation time constants at 11.7 Tesla. Magn. Reson. Mater. Phys. 2012; 25 (3): 245-249.
Figures