5230
Dynamic functional connectivity using multi-band multi-echo EPI (M2-EPI) imaging for resting-state fMRI1Department of Radiology and Imaging Sciences, Emory University School of Medicine, Atlanta, GA, United States, 2Department of Biomedical Engineering, Georgia Institute of Technology & Emory University School of Medicine, Atlanta, GA, United States, 3Department of Medicine, Emory University School of Medicine, Atlanta, GA, United States
Synopsis
In this abstract, we evaluated dynamic functional connectivity (FC) using multi-band multi-echo EPI (M2-EPI) resting-state data, which has higher temporal resolution, less susceptibility related signal dropouts and better signal-to-noise ratio. Dynamic FC and its states can be observed using M2-EPI data. Reduced temporal variation in dynamic FC was found using M2-EPI data acquisition as compared to conventional single-shot EPI imaging. The use of M2-EPI BOLD imaging may help to better delineate the structure of resting-state functional networks.
Introduction
Mapping and characterizing the human brain networks using resting-state fMRI (rs-fMRI) has gained substantial attention in recent years 1. rs-fMRI is conventionally performed using a single-band single-echo EPI sequence, which is limited by low temporal and spatial resolutions, susceptible to signal dropouts in the vicinity of air-tissue interfaces and vulnerable to superficial correlations owing to noise sources not related to neuronal activities in BOLD signal 2. In the present study, we estimated dynamic functional connectivity (FC) using a multi-band multi-echo EPI (M2-EPI) imaging method 3, which has higher temporal resolution, less susceptibility related signal dropouts and better signal-to-noise ratio.Methods
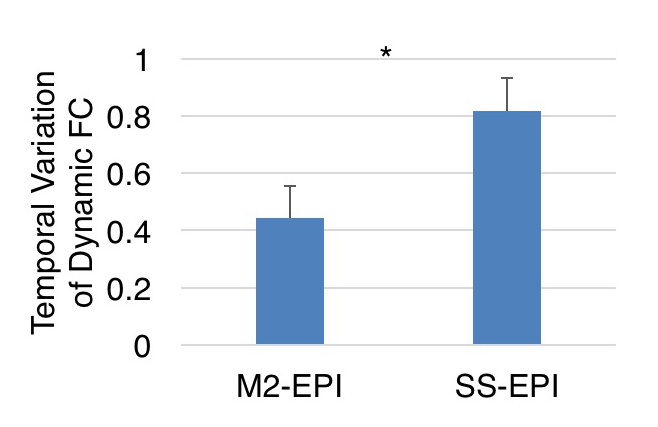
Seventeen participants (age, 42.53 ± 16.85 years; range 20-68 years; 7 females) were included in the study. Resting-state functional images were acquired using a M2-EPI pulse sequence, which combines multiband excitation and multi-echo EPI readouts, with the following parameters: TR = 840 ms, TE = 12/30/48 ms, FOV = 220 x 220 mm2, matrix = 68 x 68, slice thickness/gap = 3.4/0.4 mm, 33 slices, multi-band factor = 3, GRAPPA factor = 2. The M2-EPI scan consisted of 980 contiguous image volumes (823.2 s). A single-shot EPI (SS-EPI) imaging (TR = 2000 ms, TE = 30 ms, FOV = 220 x 220 mm2, matrix = 64 x 64, slice thickness/gap = 3.4/0.4 mm, 33 slices) with 400 image volumes (800 s) was performed for comparison. ME-ICA 4 was applied to M2-EPI data for multi-echo combination and denoising. Ninety ROIs were obtained according to the automated anatomical labeling atlas. A sliding window of 100 s was used to estimate dynamic FC between ROIs. Dynamic FC was further converted to Fisher Z value. Temporal variation of dynamic FC was calculated by dividing the SD by the mean across time windows. Statistical comparison between temporal variation of dynamic FC obtained from M2-EPI and SS-EPI data was performed using paired t-test. rs-fMRI data was also used to classify the brain activity into different states, termed FC states. To obtain FC states, k-means clustering was applied to correlation matrices with L1 distance. The number of cluster was selected by using the elbow criterion of silhouette values.Results
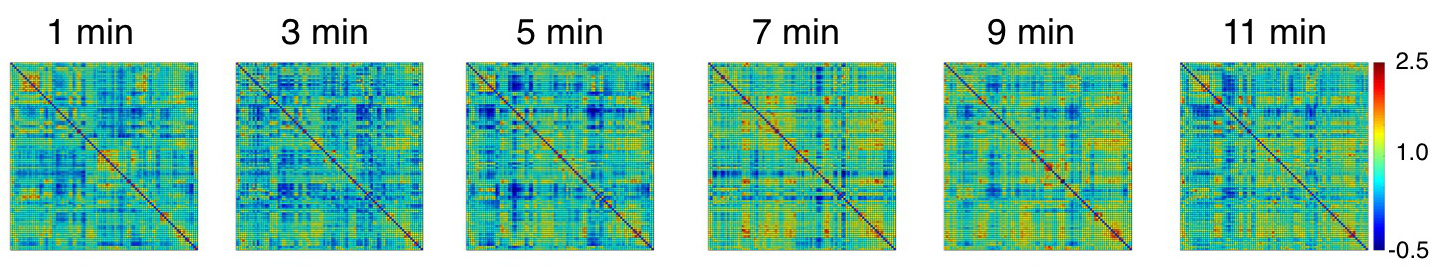
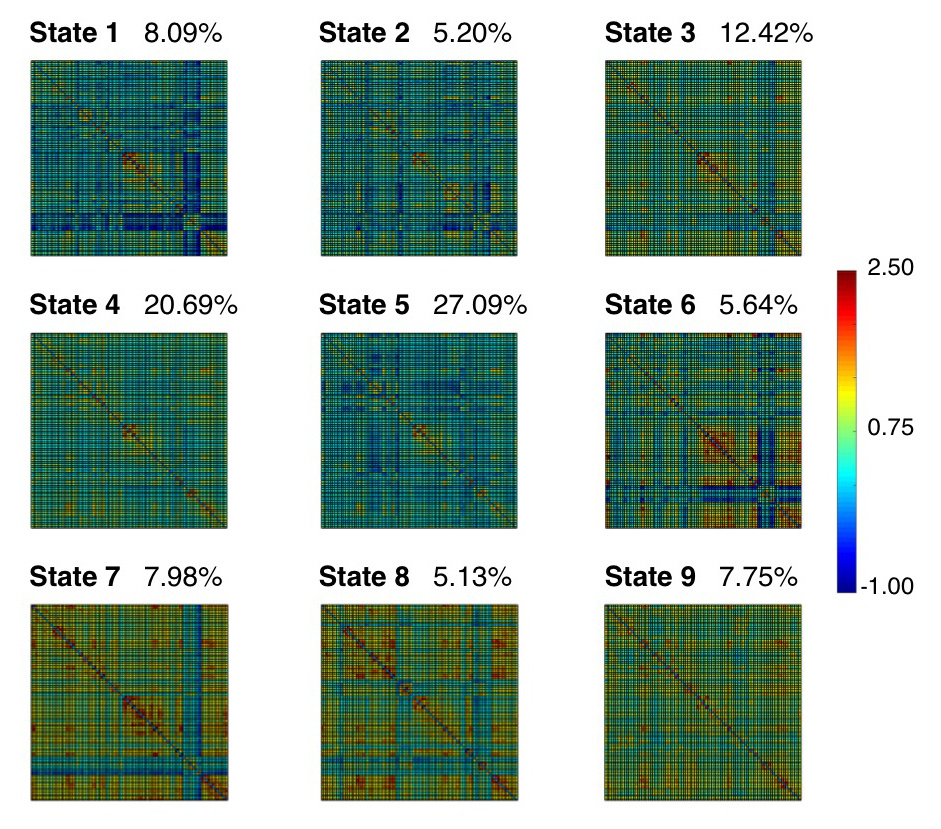
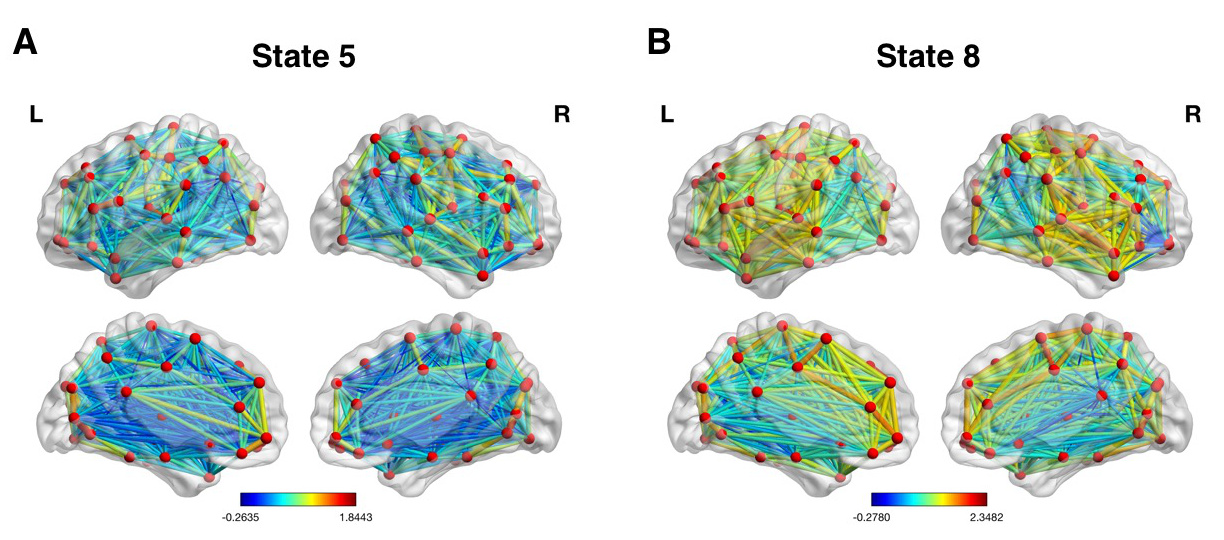
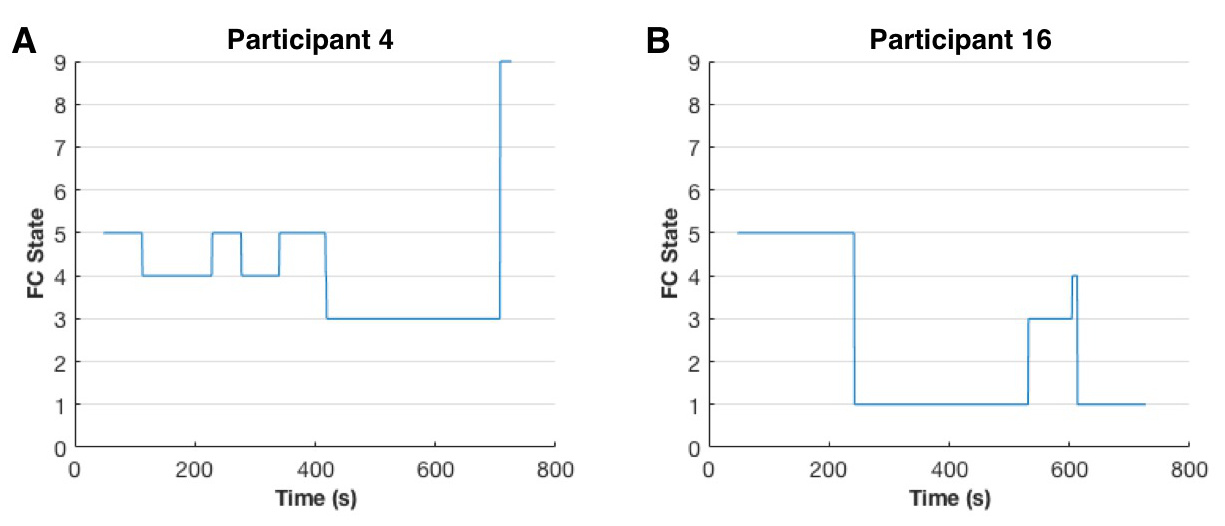
Fig 1 displays correlation matrices within different time windows in a representative participant, which shows variation of FC over time. Lower temporal variation of dynamic FC was observed using M2-EPI relative to SS-EPI (paired t-test, P < 0.001) (Fig 2). FC states derived from k-mean clustering algorithm with k = 9 were shown in Fig 3. Each matrix represents the cluster centroid, indicating a state of dynamic FC. Robust differences among FC states could be observed through visual inspection. Fig 4 further presents these differences with weighted graphs constructed from correlation matrices in Fig 3. The components of default mode network were present in State 5, which occurred in 27.09% of the time. In State 8, the occipital and parietal regions were densely connected and formed a community. Transitions between different FC states as a function of time were found during resting state (Fig 5).Discussion and Conclusion
Dynamic FC and its states can be observed using M2-EPI rs-fMRI data. Compared to conventional SS-EPI imaging, reduced temporal variation in dynamic FC is achieved using M2-EPI data acquisition, possibly due to fast acquisition and improvement in noise reduction. The use of M2-EPI BOLD imaging may help to better delineate the architecture of resting-state functional networks.Acknowledgements
No acknowledgement found.References
1. Hutchison, R.M., et al., Dynamic functional connectivity: Promise, issues, and interpretations. NeuroImage, 2013. 80: 360-378.
2. Marx, M., K.B. Pauly, and C. Chang, A novel approach for global noise reduction in resting-state fMRI: APPLECOR. NeuroImage, 2013. 64: 19-31.
3. Qiu, D., et al. Multi-band multi-echo EPI for dynamic susceptibility contrast perfusion imaging: A feasibility Study. in Proceedings of 23rd International Society for Magnetic Resonance in Medicine. 2015.
4. Kundu, P., et al., Differentiating BOLD and non-BOLD signals in fMRI time series using multi-echo EPI. NeuroImage, 2012. 60(3): 1759-1770.
Figures