5229
Identification of BOLD and non-BOLD components using Multi-Echo ICA analysis: is native space better than MNI space?1Centre for Neuroimaging Sciences, IoPPN, King's College London, London, United Kingdom
Synopsis
This work looks to see the effects of analysing and de-noising resting state functional data in the native space in comparison to the conventional methodology which utilises the normalistaion, by voxel interpolation and re-sampling, of images to a standard space. We sought to investigate these effects in rs-fMRI data collected in healthy volunteers and analysed with multi-echo ICA de-noising and seed based connectivity.
Introduction
Spatial normalisation of images is crucial for group level inferences. However, van den Huevel1 suggested that transformation to standard space can introduce artificial correlations between voxels. Magalhaes et al., 2 showed that for graph theory analysis more conservative pre-processing, avoiding resampling and interpolations is beneficial compared to normalised analysis. In this work, we investigated if Multi-Echo-ICA de-noising 3, performed differently in subject (native) space compared with spatially normalised resting state fMRI data and seed based connectivity analysis.Methods
The study was approved by the KCL REC. Scans were acquired in a GE 3T MR750 scanner in 8 healthy volunteers (2F). ME-EPI parameters were: FA = 80°, TR = 2500ms TE = 12, 28, 44 ms, voxel-size: 3.3x3.3x4mm. Participants observed a cross-hair on a dark screen for a total of 8mins (192) images. A 1mm isotropic T1-weighted MPRAGE image was also acquired for co-registration and spatial normalisation.
MNI Image processing
(a) The 1st echo was motion corrected and motion parameters were applied to subsequent echoe time series (McFLIRT). (b) EPI images were co-registered to the anatomical T1W image using FSL and (c) normalised to MNI co-ordinates using ANTs (antsApplyTransforms), (d) skulled-stripped using Brain extraction tool (FSL). (e) Normalised images were smoothed with a 5mm Gaussian kernel using SPM-12. (f) Echo time series were concatenated along the z-axis prior to the ME-ICA pipeline3.
Native Space Image processing
For native space data we took the data from step (a) above and (d) de-skulled each echo time series. Following ME-ICA the de-noised time-series was normalised using steps b-c.
Both native and MNI analyses were performed on unsmoothed and smoothed data (5mm, SPM-12).
Further de-noising and seed based connectivity analyses
All de-noised data was further filtered with standard de-noising techniques: motion regression, regression of WM/CSF signal, data de-trending and band-pass filtering (>0.1Hz) prior to seed based connectivity analysis, with a supplementary motor area (SMA) seed. Connectivity maps were computed for each permutation using a customised SPM FC script and compared using a 2nd level analysis (SPM-12).
Summary statistics
ME-ICA de-noised outputs were compared using student’s t-tests. We evaluated the number of BOLD components identified that remained in the de-noised data, and also the number of unidentified components (un-id, undistinguishable from BOLD and non-BOLD) that are kept within the data to assess classification ambiguity.
Results
MNI vs Native Space
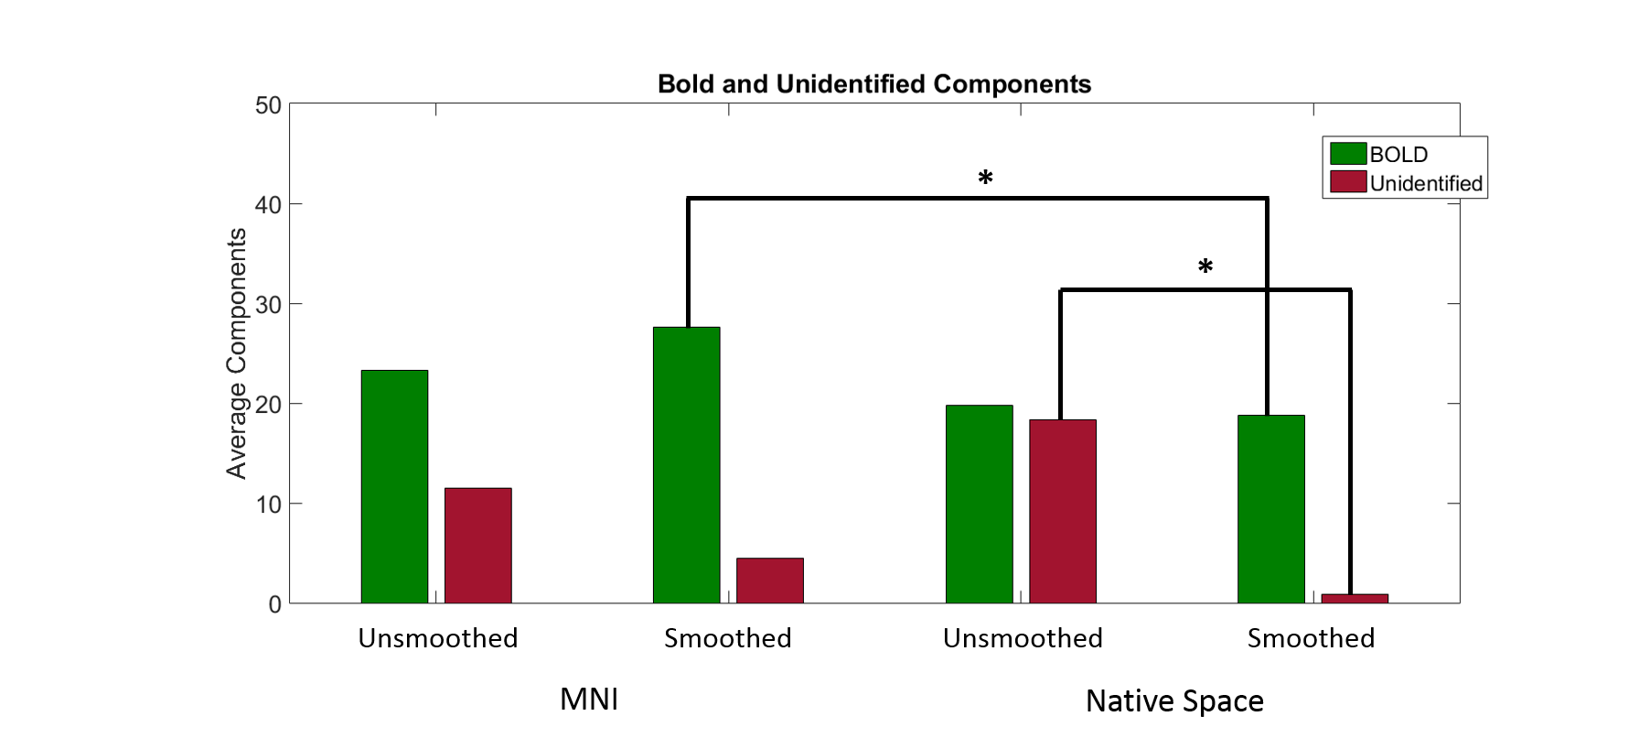
MNI space data found a significantly larger number of BOLD components compared to native space analysis but only in the smoothed data (p<0.05, mean difference=8.875) (Fig 1). No other significant differences were seen between native and MNI space datasets.
Smoothing
Within each method, no differences in the number of identified BOLD components were observed between smoothed and un-smoothed data (for MNI: BOLD-smoothed=27.62, un-id=4.5 and BOLD-un-smoothed=23.23, un-id=11.5). For native space: BOLD-smoothed=18.75 and BOLD-un-smoothed=19.75). However, there was a significant reduction in un-identified components as a result of smoothing (p<0.05, md=17.5)(Fig1).
FC maps
In spite of the above, there were no significant differences at the second level between any of the permutations, when assessing FC using a SMA seed.
Comparing MNI vs native space we see no differences from the unsmoothed images. But in the smoothed native FC maps we see a reduction and disappearance of an activation cluster around the SMA (Fig 2).
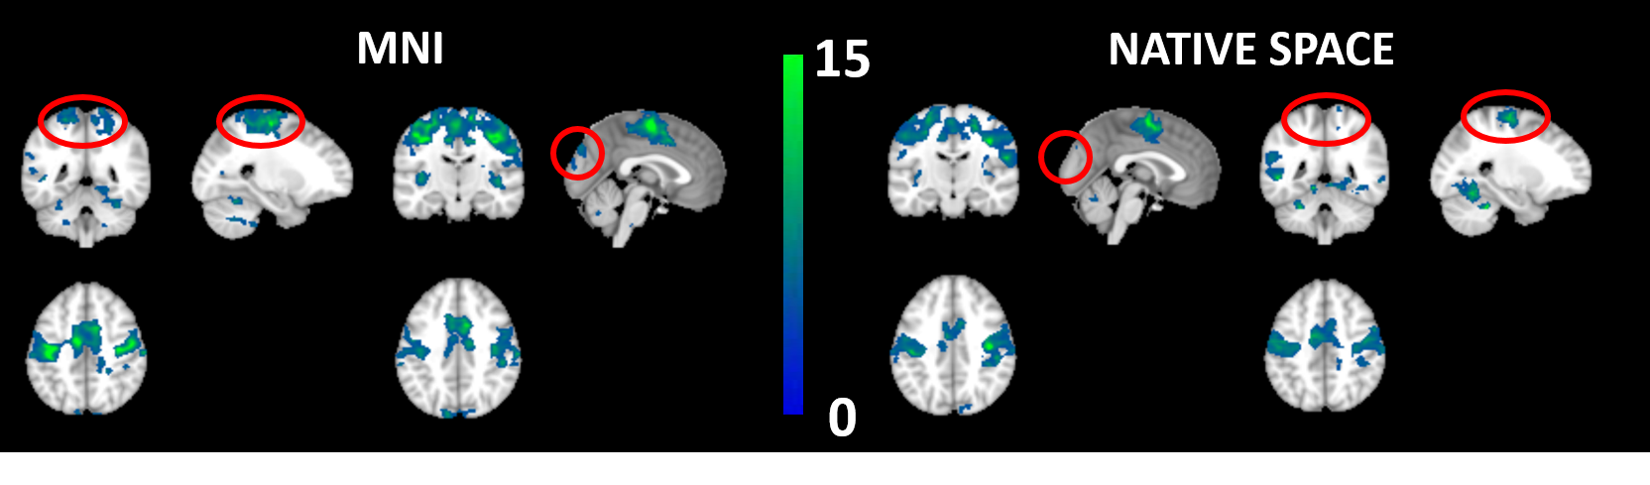
Minor cluster size decreases can be seen as a result of smoothing in the native space images (Fig 3). Whereas cluster size increases can be seen as a result of smoothing in the MNI images (Fig 4).
Discussion
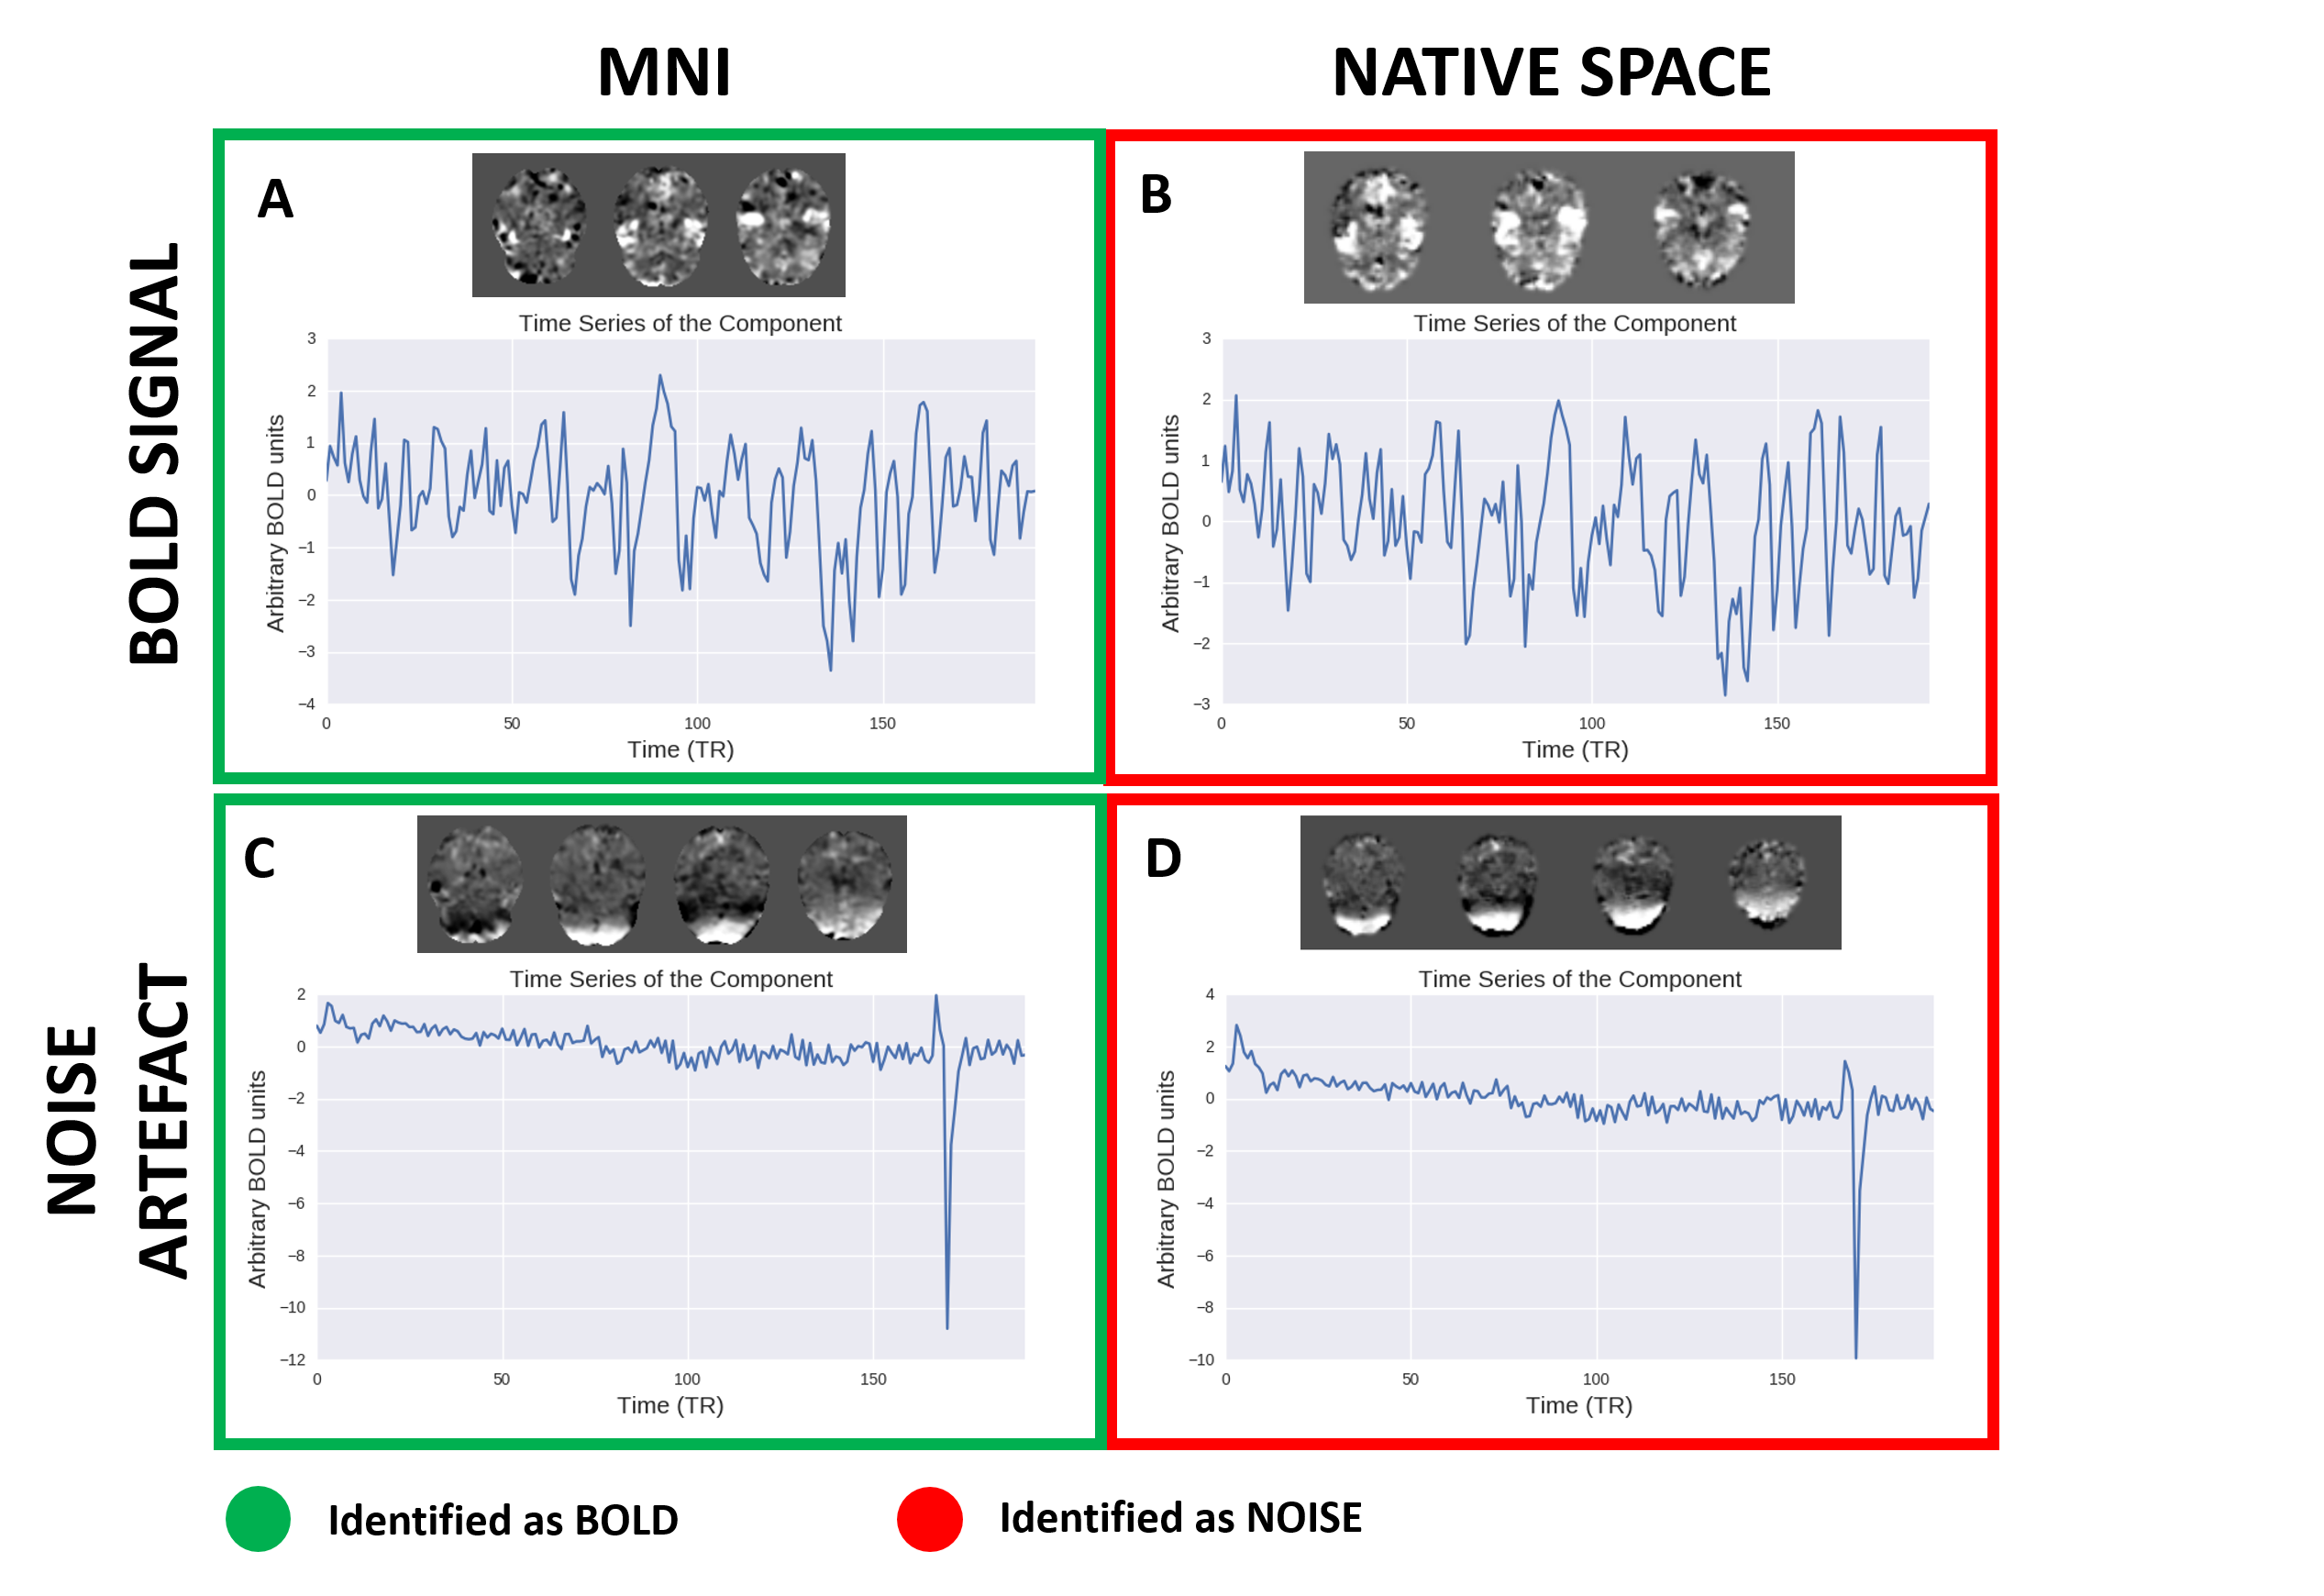
We have shown that native space images ran through ME-ICA decreases the number of BOLD components identified when compared to MNI (Fig 1 and 2). This is most prominent when smoothed. We suspect that native space ME-ICA de-noising is too aggresive in cleaning the functional data and have shown that native space incorrectly identifies BOLD signal components as noise (Fig 5B). Furthermore, this analysis has also shown that ME-ICA in MNI space incorrectly identifies noise signals as BOLD (Fig 5C), and is perhaps too conservative.Conclusion
In spite of the possible correlations that can be introduced by spatial normalisation, we suggest not to implement ME-ICA in the native space as this may lead to over aggressive scrubbing of real BOLD components. Although native space data reduces the ambiguity seen with ME-ICA classification this advantage does not justify its use.Acknowledgements
No acknowledgement found.References
1. van den Heuvel, M. P., Stam, C. J., Boersma, M. & Hulshoff Pol, H. E. Small-world and scale-free organization of voxel-based resting-state functional connectivity in the human brain. NeuroImage 43, 528-539, doi:10.1016/j.neuroimage.2008.08.010 (2008).
2. Magalhaes, R., Marques, P., Soares, J., Alves, V. & Sousa, N. The impact of normalization and segmentation on resting-state brain networks. Brain connectivity 5, 166-176, doi:10.1089/brain.2014.0292 (2015).
3. Kundu, P., Inati, S. J., Evans, J. W., Luh, W. M. & Bandettini, P. A. Differentiating BOLD and non-BOLD signals in fMRI time series using multi-echo EPI. NeuroImage 60, 1759-1770, doi:10.1016/j.neuroimage.2011.12.028 (2012).
Figures
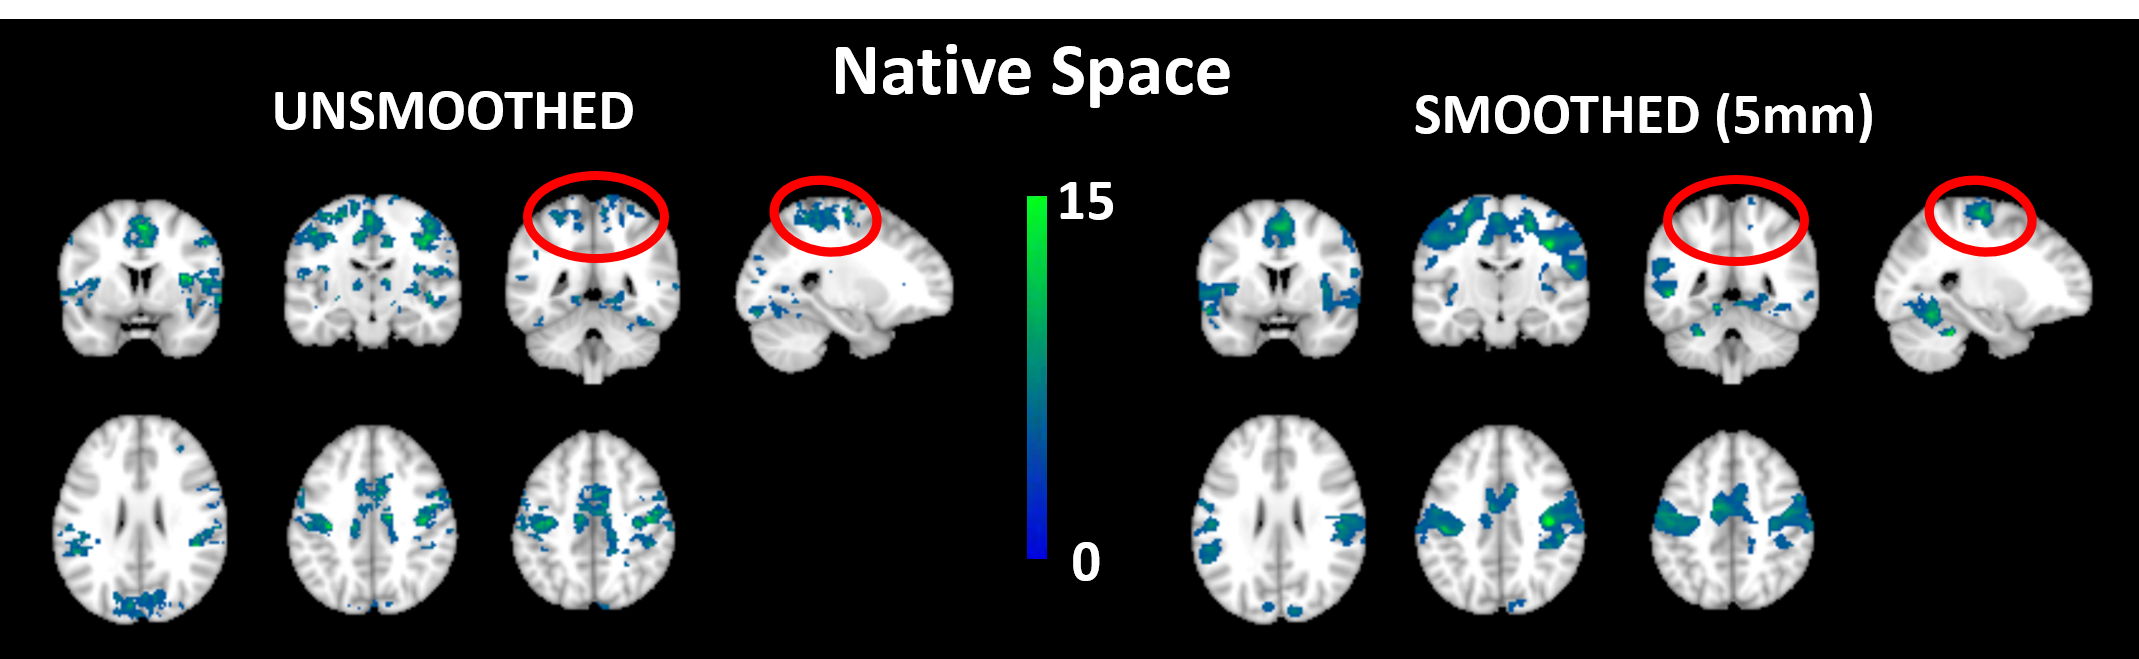
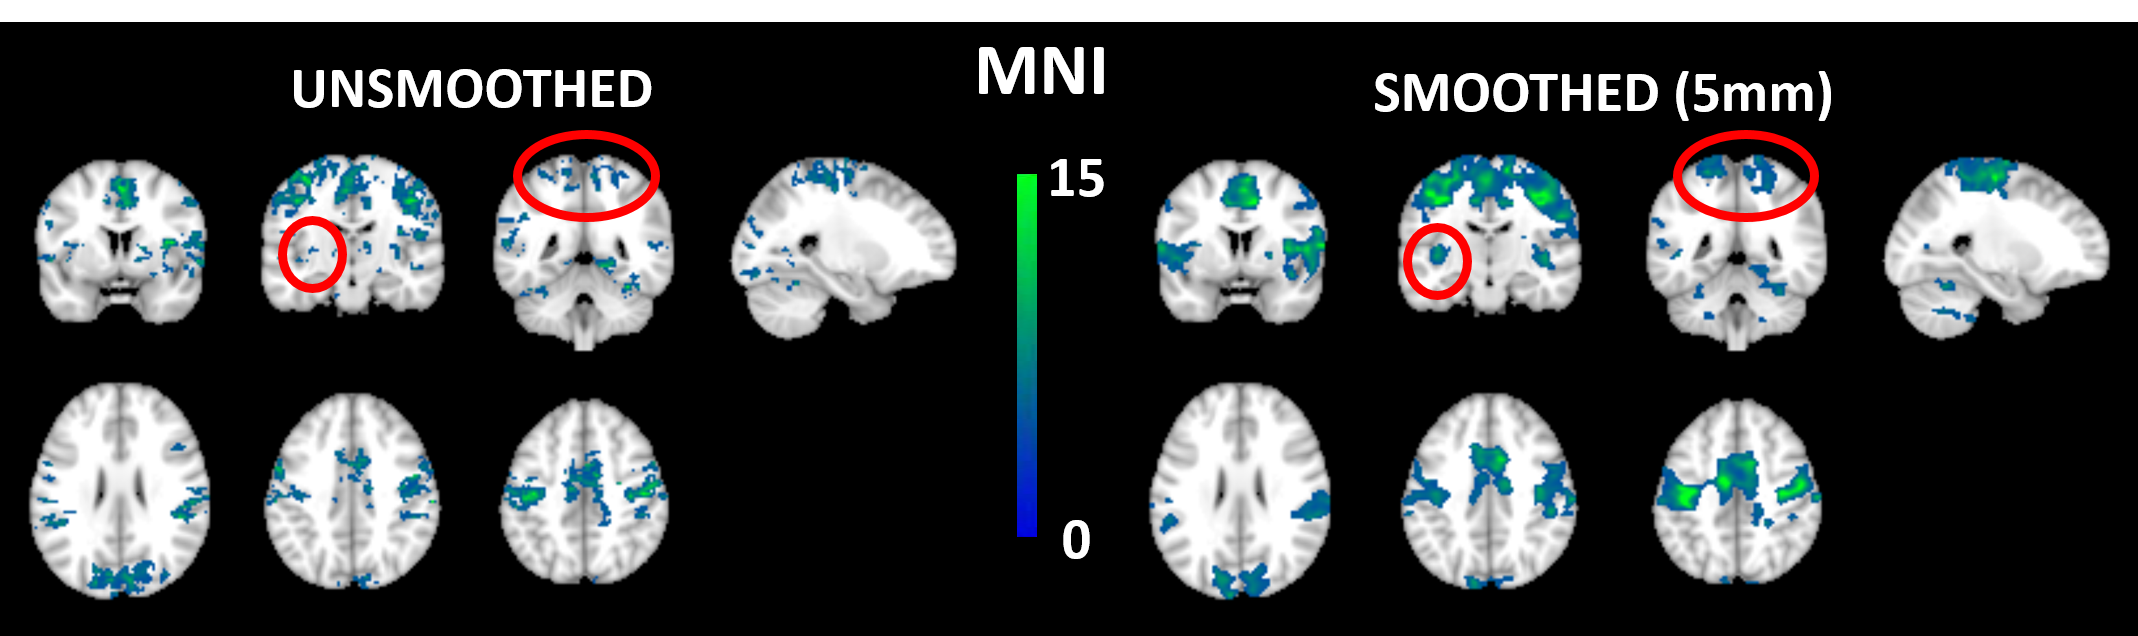
Group Functional
Connectivity T-maps for supplementary motor area seed connectivity for unsmoothed and smoothed (5mm, Gaussian) native
space de-noised datasets (n=8, for each group). Smoothing decreases the
activation cluster extent around the supplementary motor area (circled in red).