5227
High-Resolution fMRI of the visual system at 3T using Zoomed Excitation via Tx-SENSE1Laboratory for Cognitive Brain Mapping, RIKEN - BSI, Wako-shi, Japan, 2Support Unit for Functional Magnetic Resonance Imaging, RIKEN - BSI, Wako-shi, Japan, 3Application Development, Siemens Healthcare, Erlangen, Germany
Synopsis
Zoomed EPI with a transmit SENSE excitation was used to perform high-resolution fMRI of the human visual cortex at 3T. Tx acceleration was used to reduce the minimum TE by 6ms. BOLD responses were detected in the visual cortex with sub-millimeter in-plane resolution. A monocular stimulation paradigm was employed, and voxels displaying a left or right eye preference were detected, but ocular dominance columns were not apparent. These results show that using transmit SENSE at 3T with a 2-channel pTx system for high-resolution fMRI is possible, but would benefit from further steps to improve tSNR.
Purpose
Many regions of the brain are organized into cortical columns that are typically ~1mm in size1. To image such structures requires an effective resolution of significantly less than 1mm. Historically, such fMRI studies have employed multi-shot EPI (either GE-EPI or SE-EPI) to minimize the T2*-blurring and to enable a reasonably short TE1-5. Similar nominal resolutions can be achieved with combinations of in-plane acceleration and partial Fourier, but this leads to significant T2*-blurring and thus a reduced effective resolution6,7. An alternative approach is zoomed imaging, which permits a high-resolution acquisitions with a much smaller acquisition matrix8. With zoomed imaging, the entire image can be acquired in a single shot without the use of partial Fourier. Previously, this strategy has employed outer-volume suppression methods8. Zoomed imaging can also be done using transmit SENSE9,10. In this study, we explore the possibility of using a 2-channel pTx system at 3T for Zoomed EPI with an in-plane resolution of 0.74x0.74mm2, attempting to resolve ocular dominance columns.Methods
All experiments were performed on a 3T MAGNETOM Prisma (Siemens Healthcare, Erlangen, Germany), equipped with a 2-channel transmit body RF coil. Zoomed acquisitions were acquired using a prototyping sequence including Tx acceleration. A 2-dimensional RF pulse was used that was designed to excite slices with an in-plane FOV of 95x26.7mm2 and a thickness of 3mm. A Tx acceleration factor of 2 allowed the minimum TE to be shortened from 51ms to 44ms for the acquisition matrix used (128x36) without degrading image uniformity. With these parameters, an in-plane resolution of 0.74x0.74mm2 and a 5-slice volume was acquired with a TR of 1.0s.
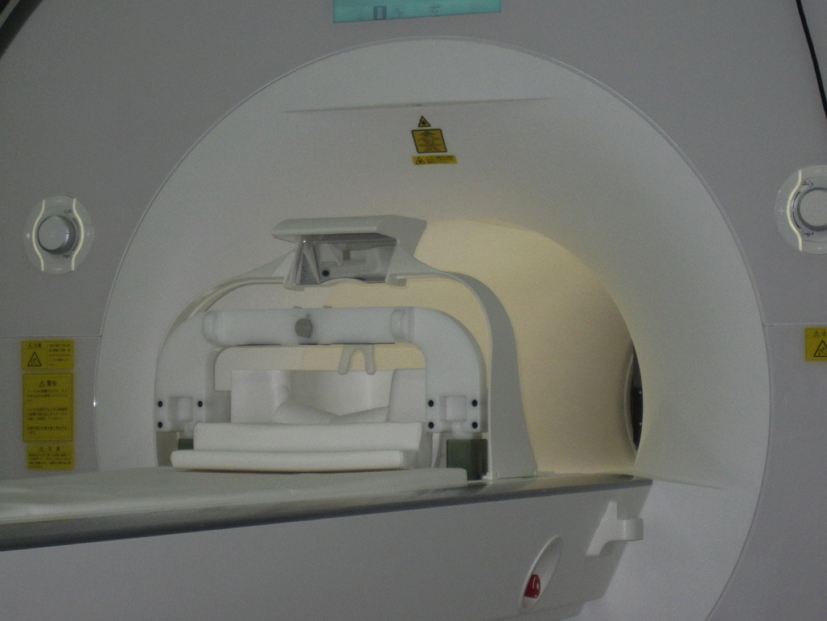
Since the imaged volumes were almost entirely filled with brain, motion correction algorithms could not be used effectively. Therefore, the use of a bite-bar to immobilize the subject was critical for this experiment. The custom-built bite-bar shown in Fig.1 (Takashima Seisakusho) was used together with the posterior portion of the Siemens 64-channel head/neck coil.
The stimulus was presented on a BOLDscreen 3D LCD monitor (Cambridge Research Systems Ltd). The stimulus consisted of 20s periods of a full-field flickering checkerboard separated by 20s periods of gray screen with a fixation cross. Each functional run contained 10 periods of right-eye monocular stimulation, 10 periods of left-eye monocular stimulation, and 10 periods of binocular stimulation. The subjects wore circularly polarized glasses to view the stimuli. Each functional run was 1220s long with two functional runs in each imaging session.
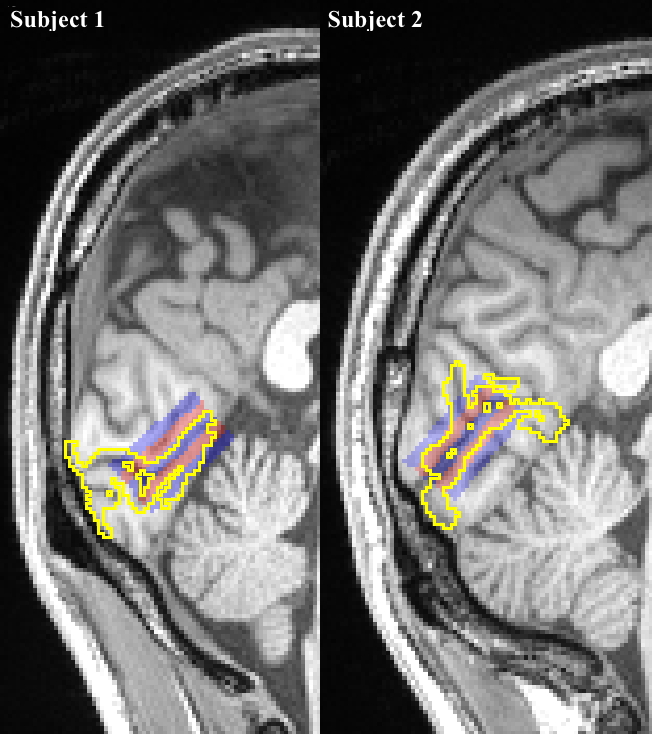
Two male subjects (35±4yrs) participated in this study. Due to the non-isotropic shape of the voxels, the subject needed to have a region in V1 that is flat, so that the slices can be placed parallel to this surface. Fig.2 shows the slice placement along the flat portion right V1 in each subject. Note that in Subject 2 (S2) the target volume is closer to the receive arrays than with Subject 1 (S1), which lead to a 40% improvement in tSNR for S2.
For each subject, the functional runs were concatenated and a GLM analysis was performed in MrTools11.
Results & Discussion
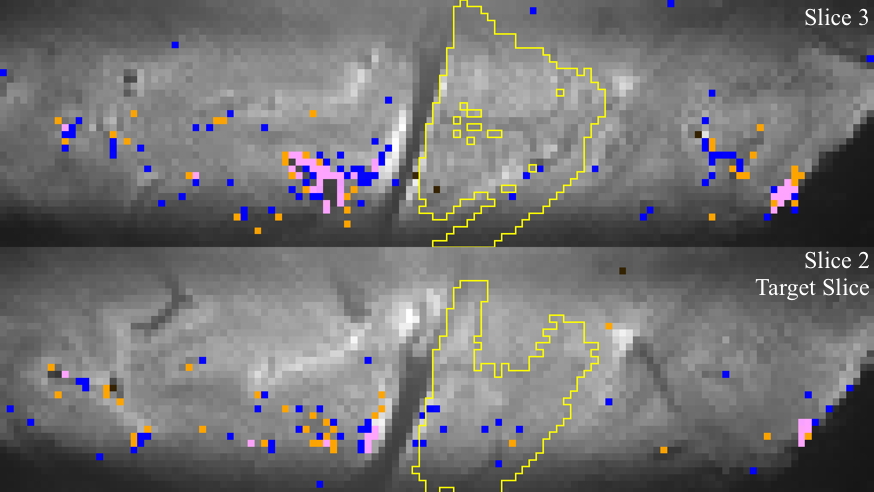
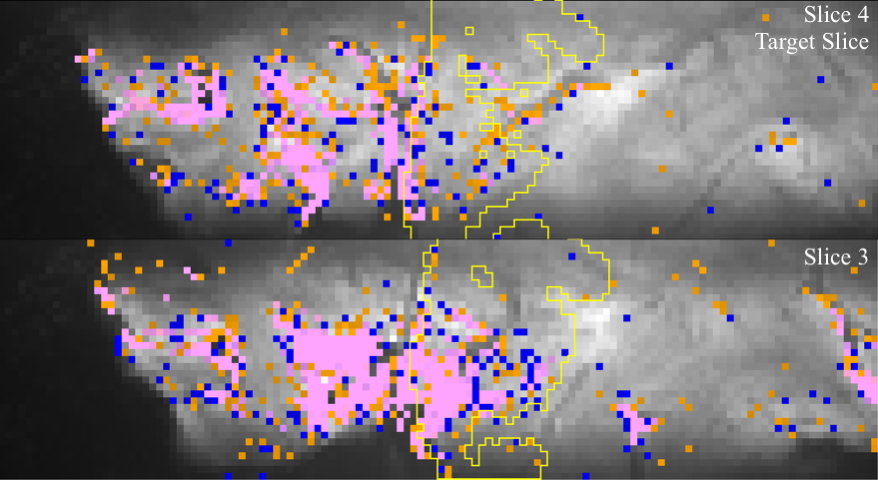
The resulting functional maps
for the target slice and one adjacent slice are shown in Figs. 3&4. The yellow ROIs indicate Right V1 in each
slice. For S1, there are few active
voxels in the target region, with more activation in the visual cortex of the
left hemisphere. The tSNR in the target
region of S1 was 10. For S2, tSNR in the
target region was 14 resulting in a larger extent of detected activation. Outside the target region, most active voxels
do not show a differential response.
Inside the target region, most active voxels show either left (blue) or
right (orange) eye dominance, but the active voxels are sparsely distributed in
this region.
With a slice thickness of 3mm, within the target region, voxels in the target slice were located partially in gray matter and partially in white matter. In other parts of the visual cortex voxels may be fully in the gray matter but oriented incorrectly to resolve columns, resulting primarily in activations without eye preference, as we have observed.
Conclusions
Our results show that it is possible to detect functional activations with pTx zoomed high-resolution imaging at 3T. Though we failed to reliably detect ODCs, our results suggest that it may be possible if tSNR can be improved. This could be accomplished by shortening TE, which could be accomplished by increasing Tx acceleration (which would require more transmit channels) or by incorporating multi-shot EPI.Acknowledgements
This work was partially funded by a grant from the Brain/MINDS project.References
1. Cheng K, Waggoner R A, Tanaka K, Human Ocular Dominance Columns as Revealed by High-Field Functional Magnetic Resonance Imaging. Neuron 2001; 32:359-374.
2. Yacoub E, Shmuel A, Logothetis N, et al. Robust detection of ocular dominance columns in humans using Hahn Spin Echo BOLD functional MRI at 7 Tesla. NeuroImage 2007; 37:1161-1177.
3. Sun P, Ueno K, Waggoner R A, et al. A temporal frequency-dependent functional architecture in human V1 revealed by high-resolution fMRI. Nat. Neurosci. 2007; 10:1404-1406.
4. Yacoub E, Harel N, Ugurbil K, High-field fMRI unveils orientation columns on humans. PNAS 2008; 105:10607-10612.
5. Sun P, Gardner J L, Costagli M. et al. Demonstration of Tuning to Stimulus Orientation on the Human Visual Cortex: A High-Resolution fMRI Study with a Novel Continuous and Periodic Stimulus Paradigm. Cereb. Cortex 2013; 23:1618-1629.
6. Kemper V G, De Martino F, Vu A T, et al. Sub-millimeter T2 weighted fMRI at 7T: comparison of 3D-GRASE and 2D SE-EPI. Front. Neurosci. 2015; 9:163.
7. Zaretskaya N, Polimeni J R, Partial Fourier Imaging Anisotropically Reduces Spatial Independence of BOLD Signal Time Courses. OHBM 2016; 22:1609.
8. Pfeuffer J, van de Moortele P-F, Yacoub E, et al. Zoomed Functional Imaging in the Human Brain at 7 Tesla with Simultaneous High Spatial and High Temporal Resolution. NeuroImage 2002; 17:277-286.
9. Katscher U, Börnert P, Leussler C, et al. Transmit SENSE. Magn. Reson. Med. 2003; 49:144-150.
10. Blasche M, Riffel P, Lichy M, TimTx TrueShape and syngo ZOOMit Technical and Practical Aspects. MAGNETOM Flash 2012; 49:74-84.
11. http://gru.stanford.edu/doku.php/mrTools/overview
Figures