5226
Adaptive combine reconstruction of sodium MRI data of breast and knee at 7 T: optimization and comparison to sum-of-square reconstruction.1High Field MR Centre, Department of Medical Imaging and Image-guided Therapy, Medical University of Vienna, Vienna, Austria, 2Christian Doppler Laboratory for Clinical Molecular MR Imaging, Vienna, Austria, 3Research Unit of Medical Imaging, Physics and Technology, University of Oulu, Oulu, Finland, 4Institute of Radiology, University Hospital Erlangen, Erlangen, Germany, 5Division of Medical Physics in Radiology, German Cancer Research Centre (DKFZ), Heidelberg, Germany
Synopsis
In this work, adaptive combine (AC) reconstruction was optimized on breast and knee sodium MRI data, acquired with a 14-channel breast and a 15-channel knee coils. AC reconstruction was compared with the standard sum-of-square (SoS) reconstruction. The optimal reconstruction parameters were: the lowest interpolation factor of two and an overlap of the analysis block of two to eight pixels. Images reconstructed using the AC had lower noise floor when compared to the SoS. However, when a multichannel coil with low noise correlation between elements is used, the advantage of AC reconstruction decreases.
Purpose
The reconstruction of data acquired by phased-array coils faces a unique challenge when the MR signal is low, such as in sodium imaging. The sum-of-squares (SoS) reconstruction of multi channel data, ideal for high-signal proton MRI, causes an amplification of the noise and brings bias in low-signal conditions. Adaptive combination reconstruction (AC), that combines complex images and uses coil sensitivity profiles, was proposed to improve image quality in low signal data over the simple SoS reconstruction1.
Thus, the purpose of this abstract was to optimize AC reconstruction of sodium data from breast and knee, and to compare the performance between AC and SoS reconstruction.
Methods
This study was approved by the local ethics committee. Two healthy volunteers were measured on 7 T MRI (Siemens Healthcare, Erlangen, Germany). First volunteer (f/24yo) was measured using dual-tuned bilateral phased-array breast coil (2 × 23Na Rx/Tx, 12 × 23Na Rx, 2 × 1H Tx/Rx). Second (f/26yo) was imaged with sodium-only, 15-channel TX/RX knee coil (both, QED; Quality Electrodynamics, Cleveland, Ohio). After transmitter RF power calibration, a density adapted 3D-radial projection reconstruction (DA-3DPR) sequence2 was used ( TR/TE= 65/0.4ms, flip angle=90, 9000/7000 projections, 680/700 μs pulse duration, and acquisition times of 9:45/11:40 min, for breast/knee measurements, respectively). Afterwards, a noise dataset was acquired by setting the voltage of the RF pulses to 0V and decreasing the TR to the minimum. Additionally, proton Dixon images were acquired in the first volunteer, to be used as a reference for glandular tissue localisation in the breast.
Data regridding, SoS and AC reconstruction, and SNR maps calculations were performed offline using in-house scripts written in MATLAB (Mathworks Inc, Natick, MA). Optimization of AC reconstruction was performed by varying the size and overlap of analysis blocks used in the covariance analysis to determine coil weighting factors. The analysis block size is calculated as the sum of the overlap and the interpolation factor in pixels. SNR maps were calculated using the pseudo multiple replica approach using 256 replicas3.
Results
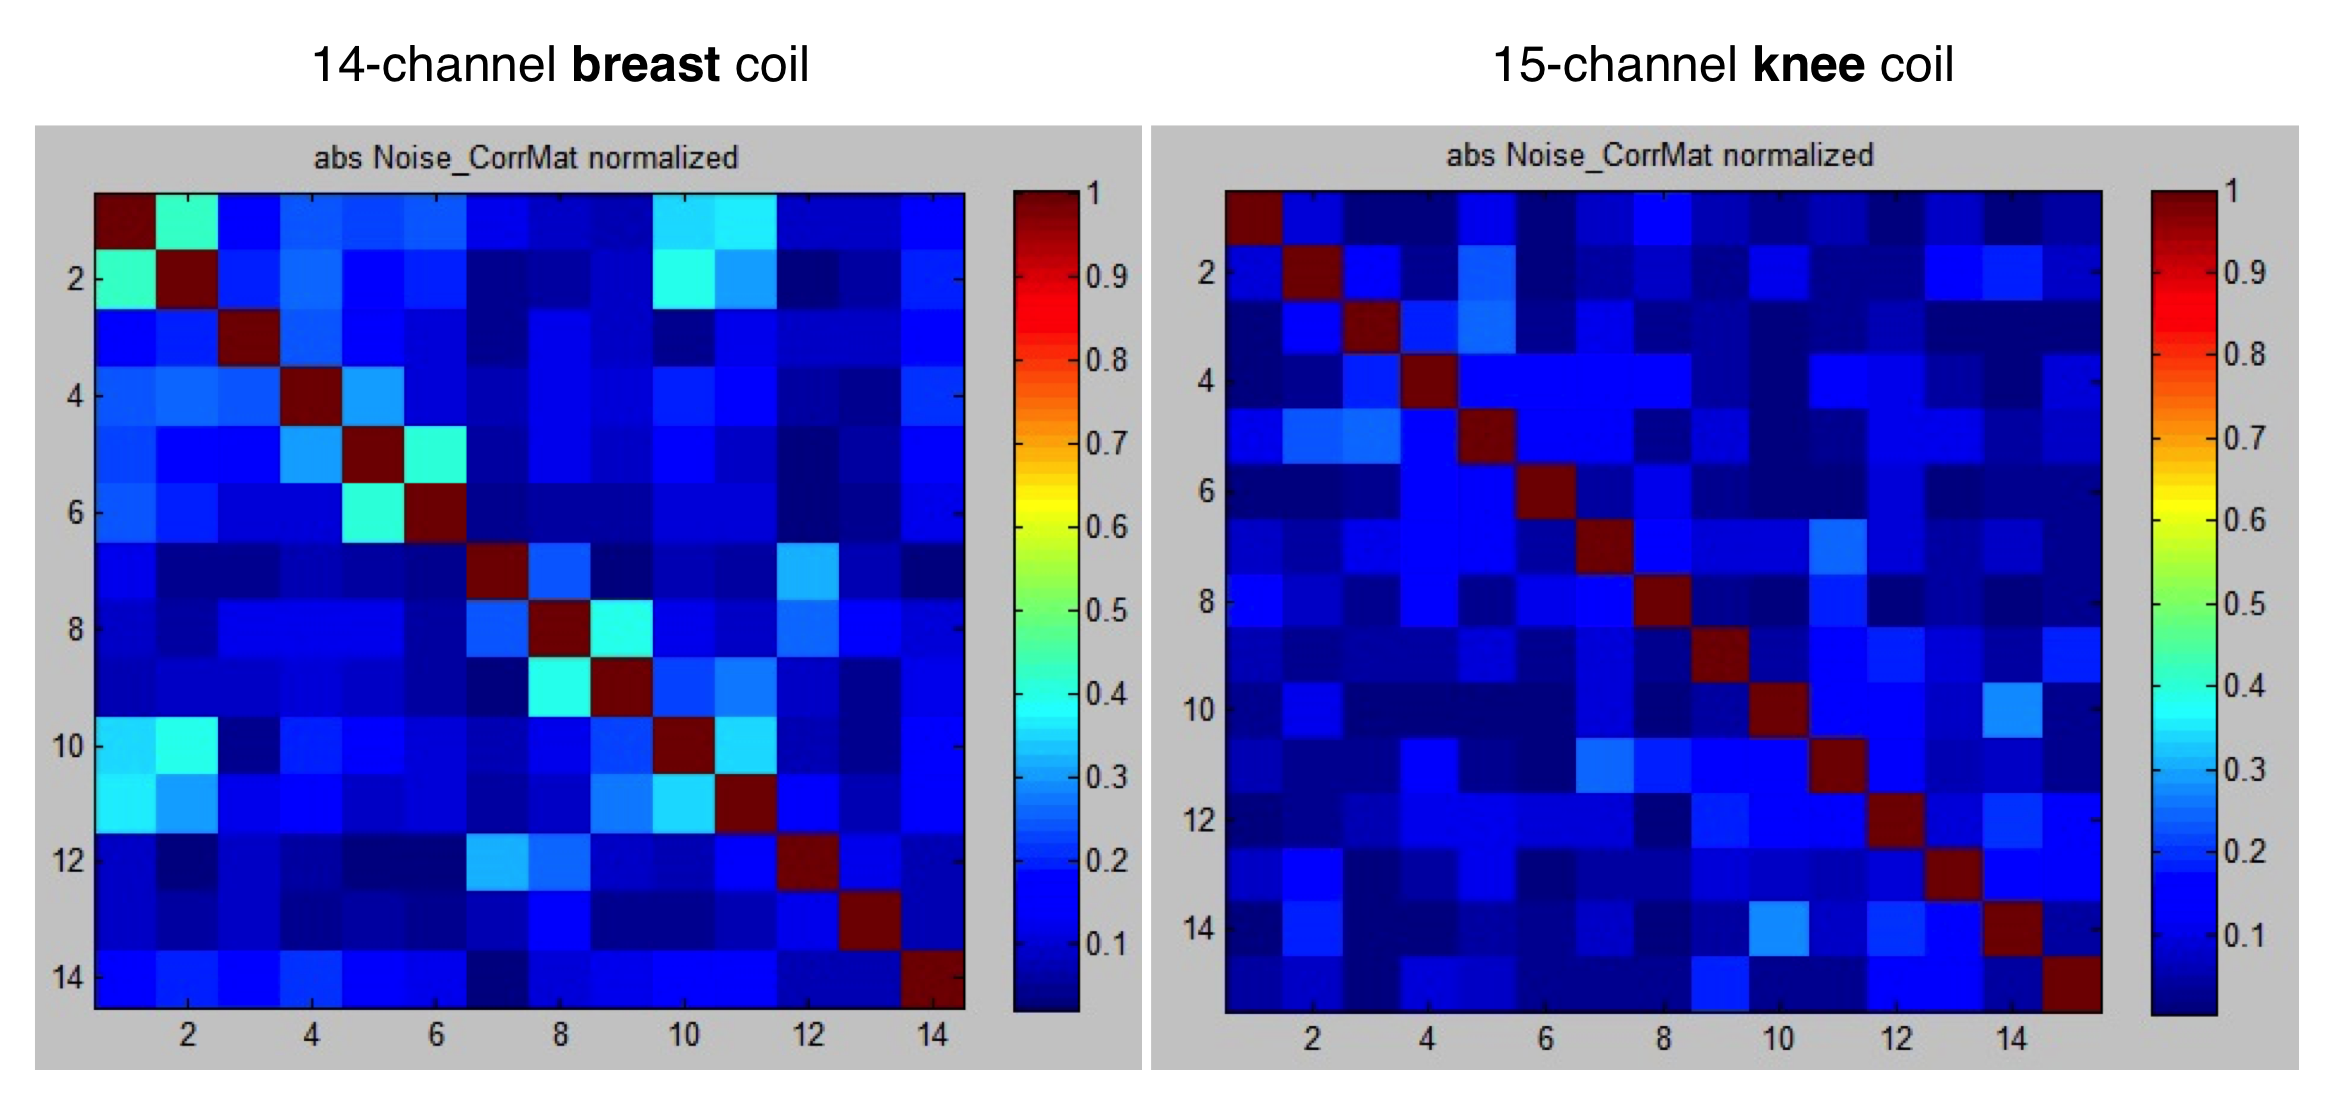
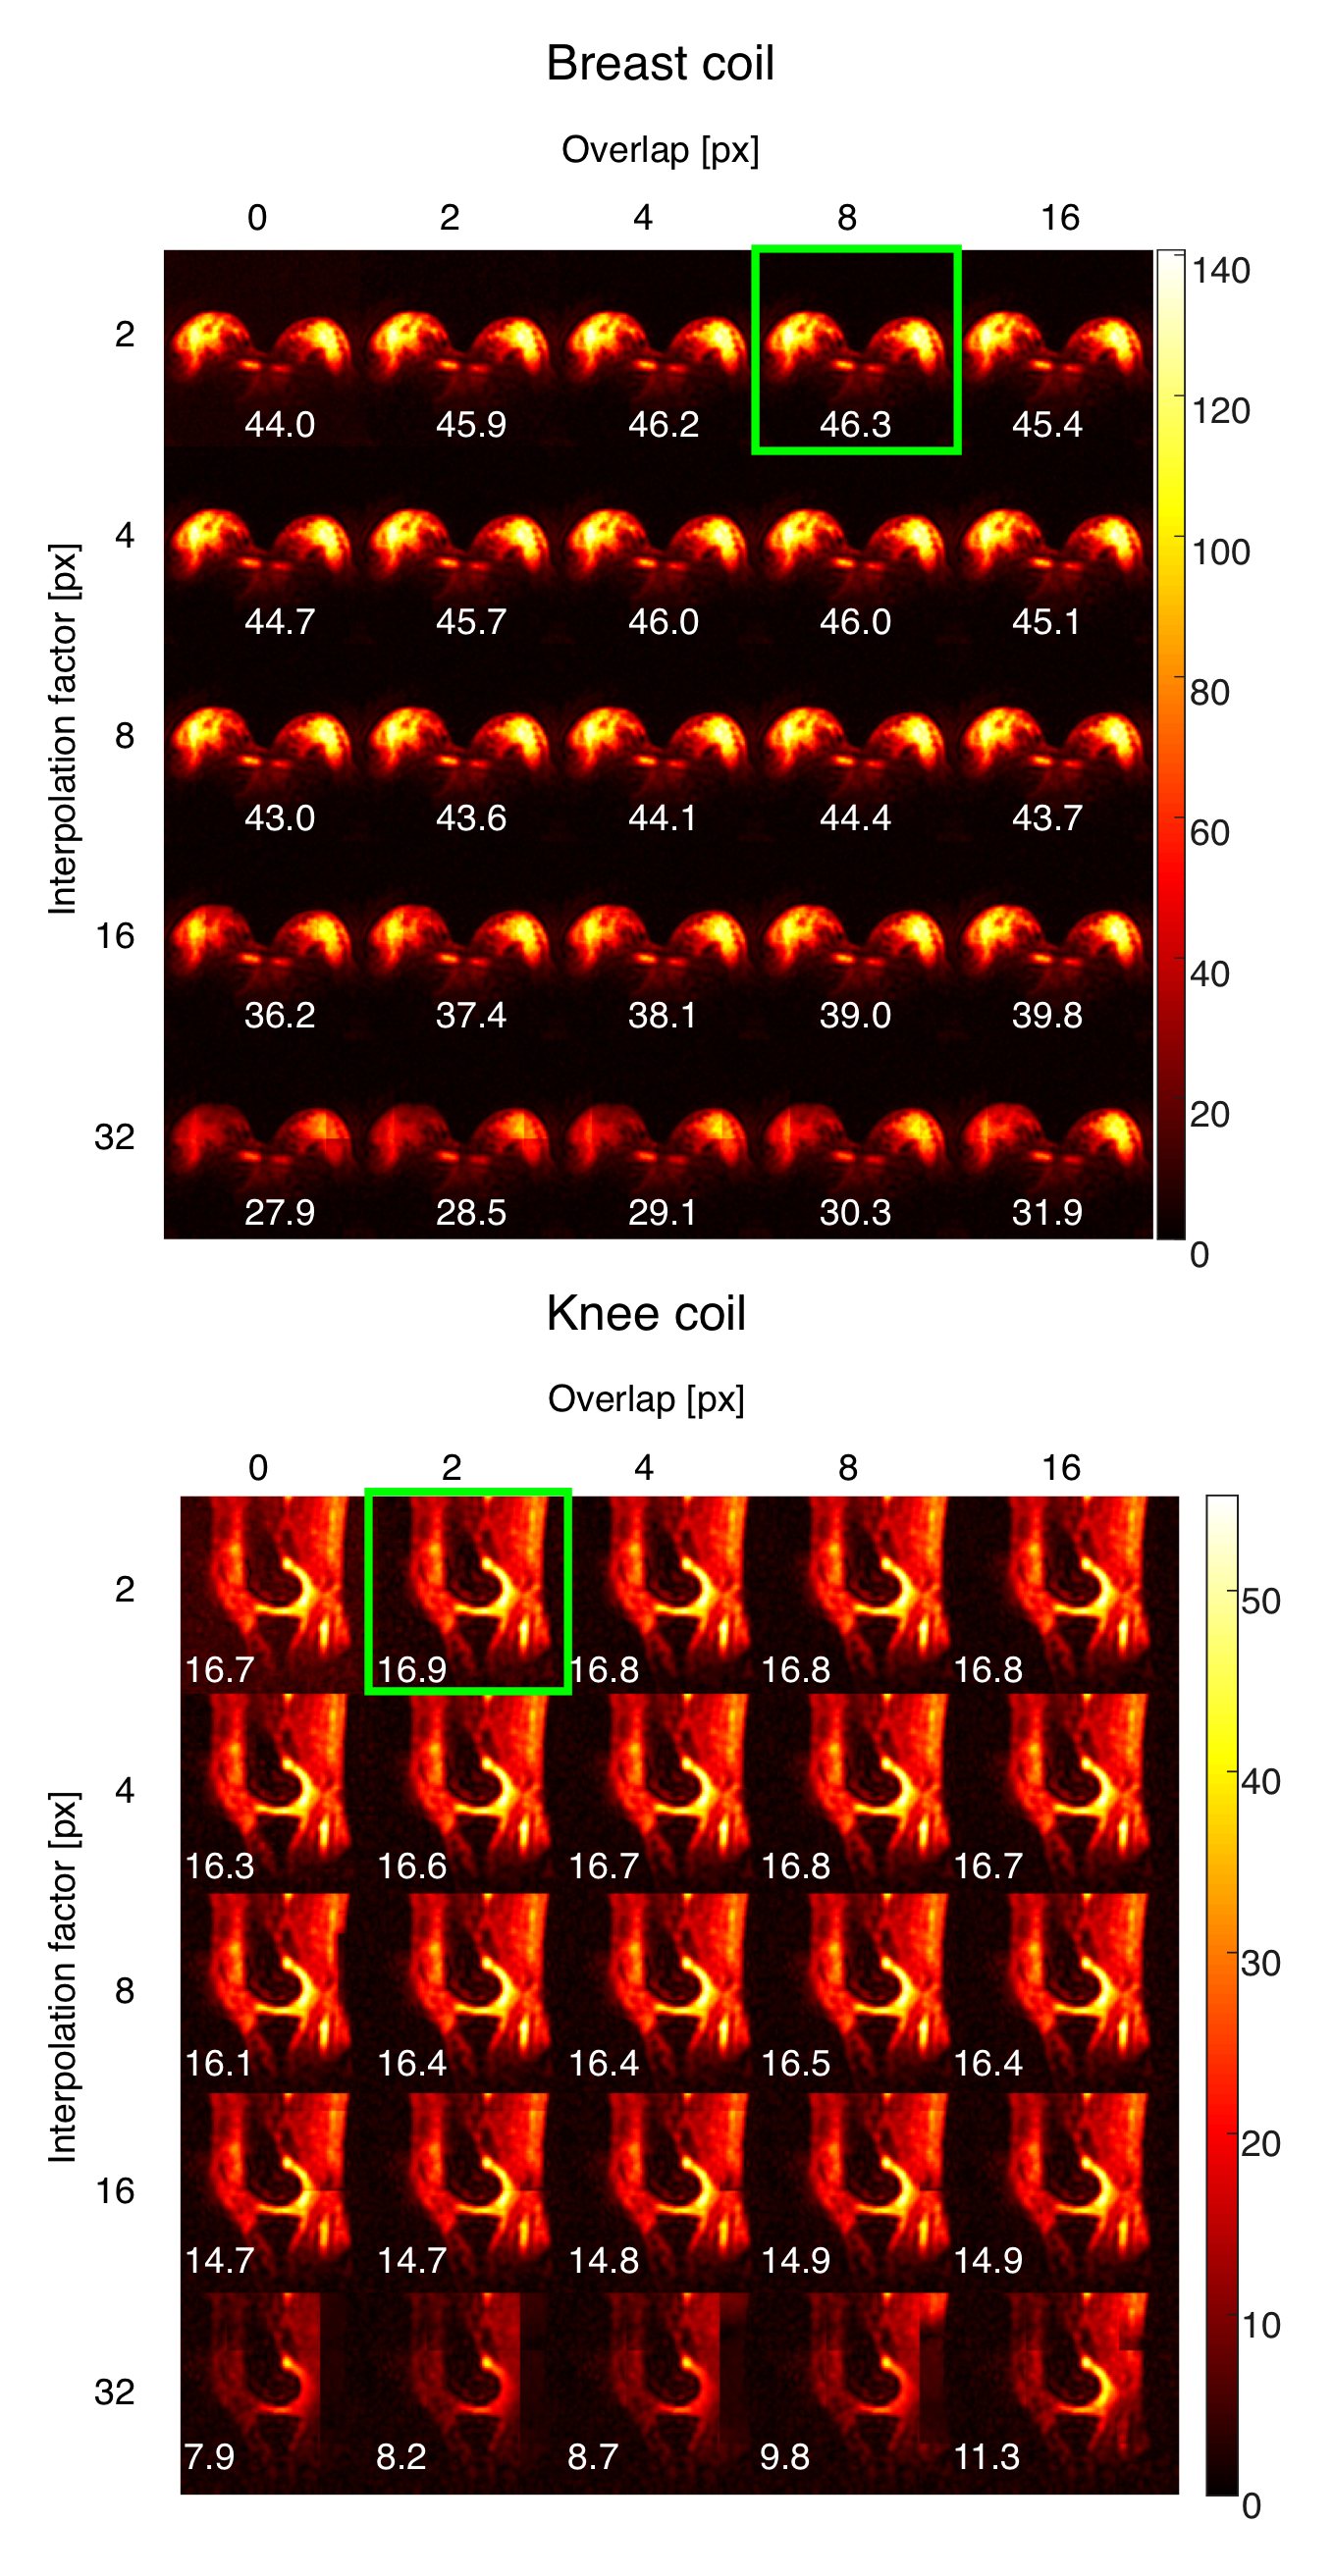
The noise correlation matrices representing the correlation between different elements were measured for both coils (Fig. 1). Highest average SNR values in AC-reconstructed images were obtained with an interpolation factor of two (both, breast and knee) and an overlap of either eight (breast) or two pixels (knee). SNR maps of a selected slice with different interpolation factors and overlaps used for AC reconstruction for both coils are represented on the Fig. 2.
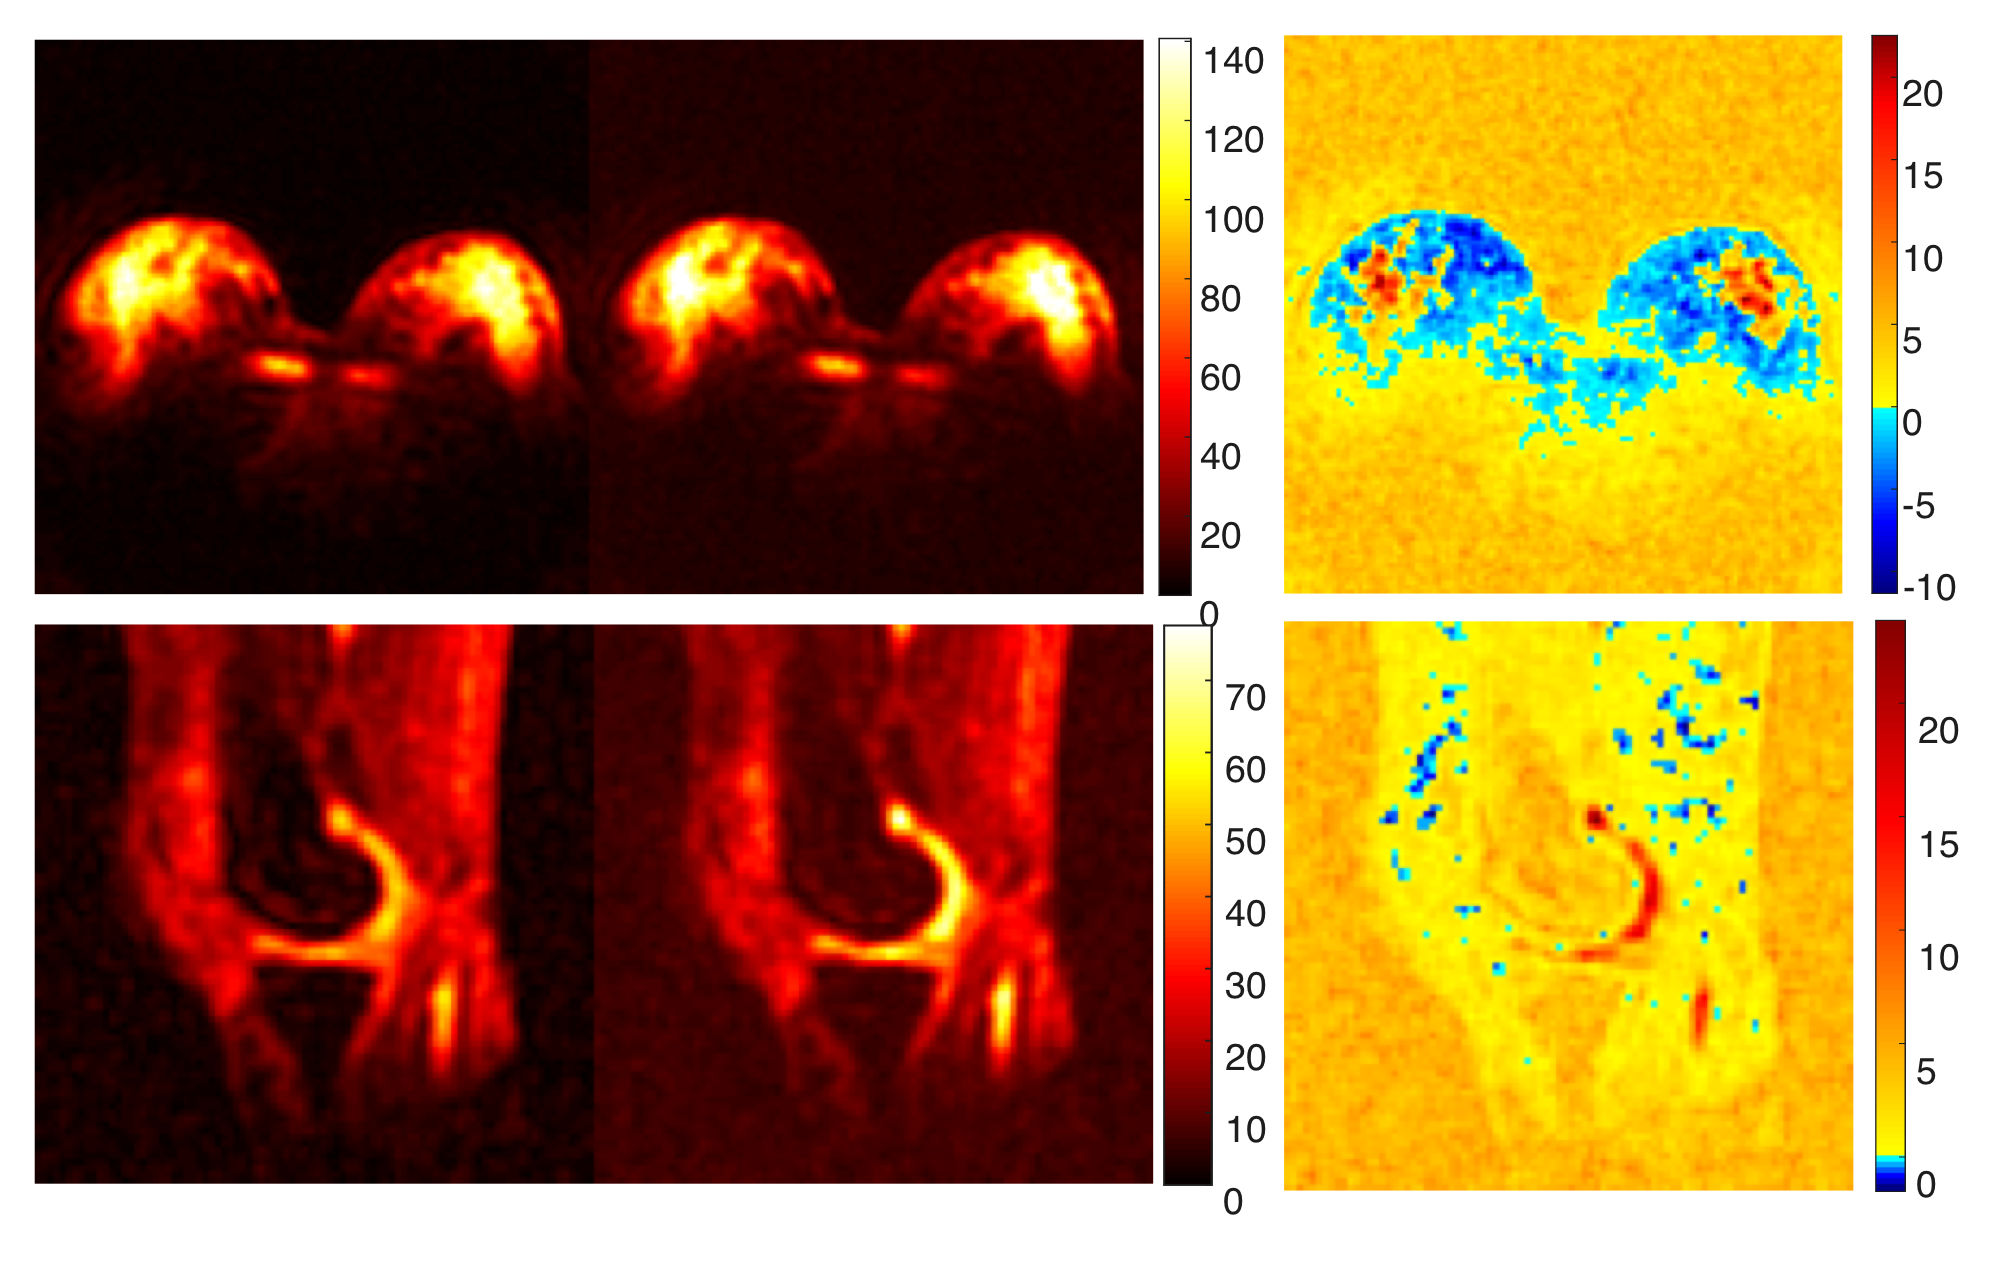
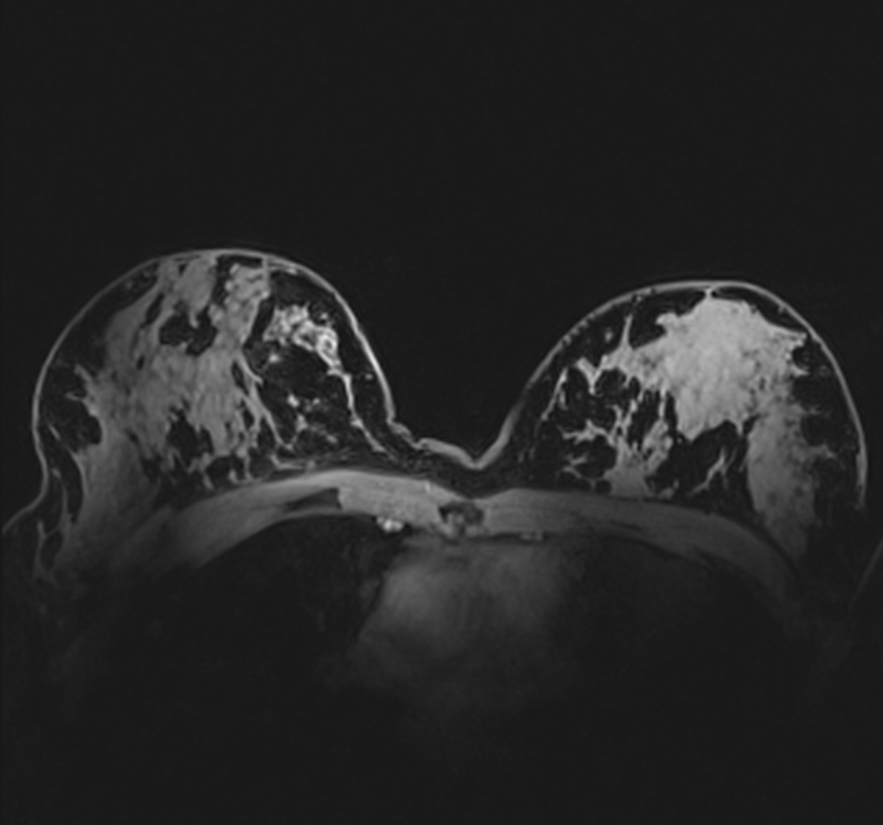
The optimal AC and SoS reconstruction showed only small/negligible differences in the estimated average SNR values. A side to side comparison of SNR maps from both AC and SoS reconstructed data and corresponding difference maps are depicted on the Fig. 3. A decrease in the noise floor is observed in AC reconstructed data (red color on the difference maps on the Fig. 3) and an increase of SNR in the low absolute signal areas of the breast, that is representing mostly fat tissue when compared with the proton water (tissue) image on Fig. 4 . Example sodium images from breast and knee, reconstructed with both AC and SoS, are shown on the Fig. 5. The images here were scaled to 50% of maximal intensity to better depict the noise floor and the areas with low tissue signal.
Discussion
The performance of AC reconstruction in sodium MRI was previously demonstrated by Benkhedah et al. using a 30-channel head coil4. In our study, we optimized AC reconstruction on coils with different number of channels and different designs. The optimal AC reconstruction settings were found to be using the lowest interpolation factor of two with an overlap of two to eight pixels. These settings were similar to the previous study4.
Furthermore, the noise correlation between different coil elements in this study was lower (<0.5) in both breast and knee coils, when compared to the 30-channel head coil. The correlation matrix reported in the previous study showed several values above 0.64. Therefore, the advantage brought by the AC coil combination reconstruction employing the noise correlation matrix, was not that prominent in our data, as it was in the case of a more correlated noise in the previous study. However, because the SoS combines different coil elements using magnitude data only, this results in an increased noise floor and leads to a bias in the estimated SNR maps (an overestimation of the SNR in SoS reconstruction – red areas in the tissue on the Fig. 3).Acknowledgements
We acknowledge financial support by the OeNB (grant #16911) and by the WWTF (grant LS14-096).References
1. Walsh D, Gmitro A, Marcellin M. Adaptive Reconstruction of Phased Array MR Imagery. Magn Reson Med. 2000;43:682–690.
2. Nagel A, Laun F, Weber M, et al. Sodium MRI using a density-adapted 3D radial acquisition technique. Magn Reson Med. 2009;62:1565-1573.
3. Robson P, Grant A,Madhuranthakam A, et al. Comprehensive Quantification of Signal-to-Noise Ratio and g-Factor for Image-Based and k-Space-Based Parallel Imaging Reconstructions. Mag Reson Med. 2008;60:895–907.
4. Benkhedah N, Hoffmann S, Biller A, et al. Evaluation of Adaptive Combination of 30-Channel Head Receive Coil Array Data in 23Na MR Imaging. Magn Reson Med. 2016;75:527–536.
Figures