5221
Robust Bias Correction and Segmentation of 7 Tesla Structural Brain Images with an iterative Bias-Corrected Fuzzy C-means and N4 Bias Correction (iBCFCM+N4)1Radiology and Biomedical Imaging, University of California San Francisco, San Francisco, CA, United States
Synopsis
To introduce and evaluate a novel strategy for iterative combination of bias-corrected fuzzy c-means (BCFCM) and N4 bias correction for robust bias correction and segmentation in 7 Tesla brain imaging studies.
Introduction
One major challenge faced by 7 Tesla imaging is the presence of strong intensity inhomogeneity due to B0 and B1 fields. Common intensity-based segmentation methods misclassify tissues due to the large shift in intensity that often result from residual errors in bias field estimation with N3 or N4 bias correction.
N4 bias correction is an improvement over the popular and robust N3 bias correction method1. Both methods, however, are sensitive to the segmentation mask over which the bias field would be computed. Bias-corrected fuzzy c-means (BCFCM) is a bias correction and segmentation method that produces soft segmentation maps and simultaneously estimates the bias field2.
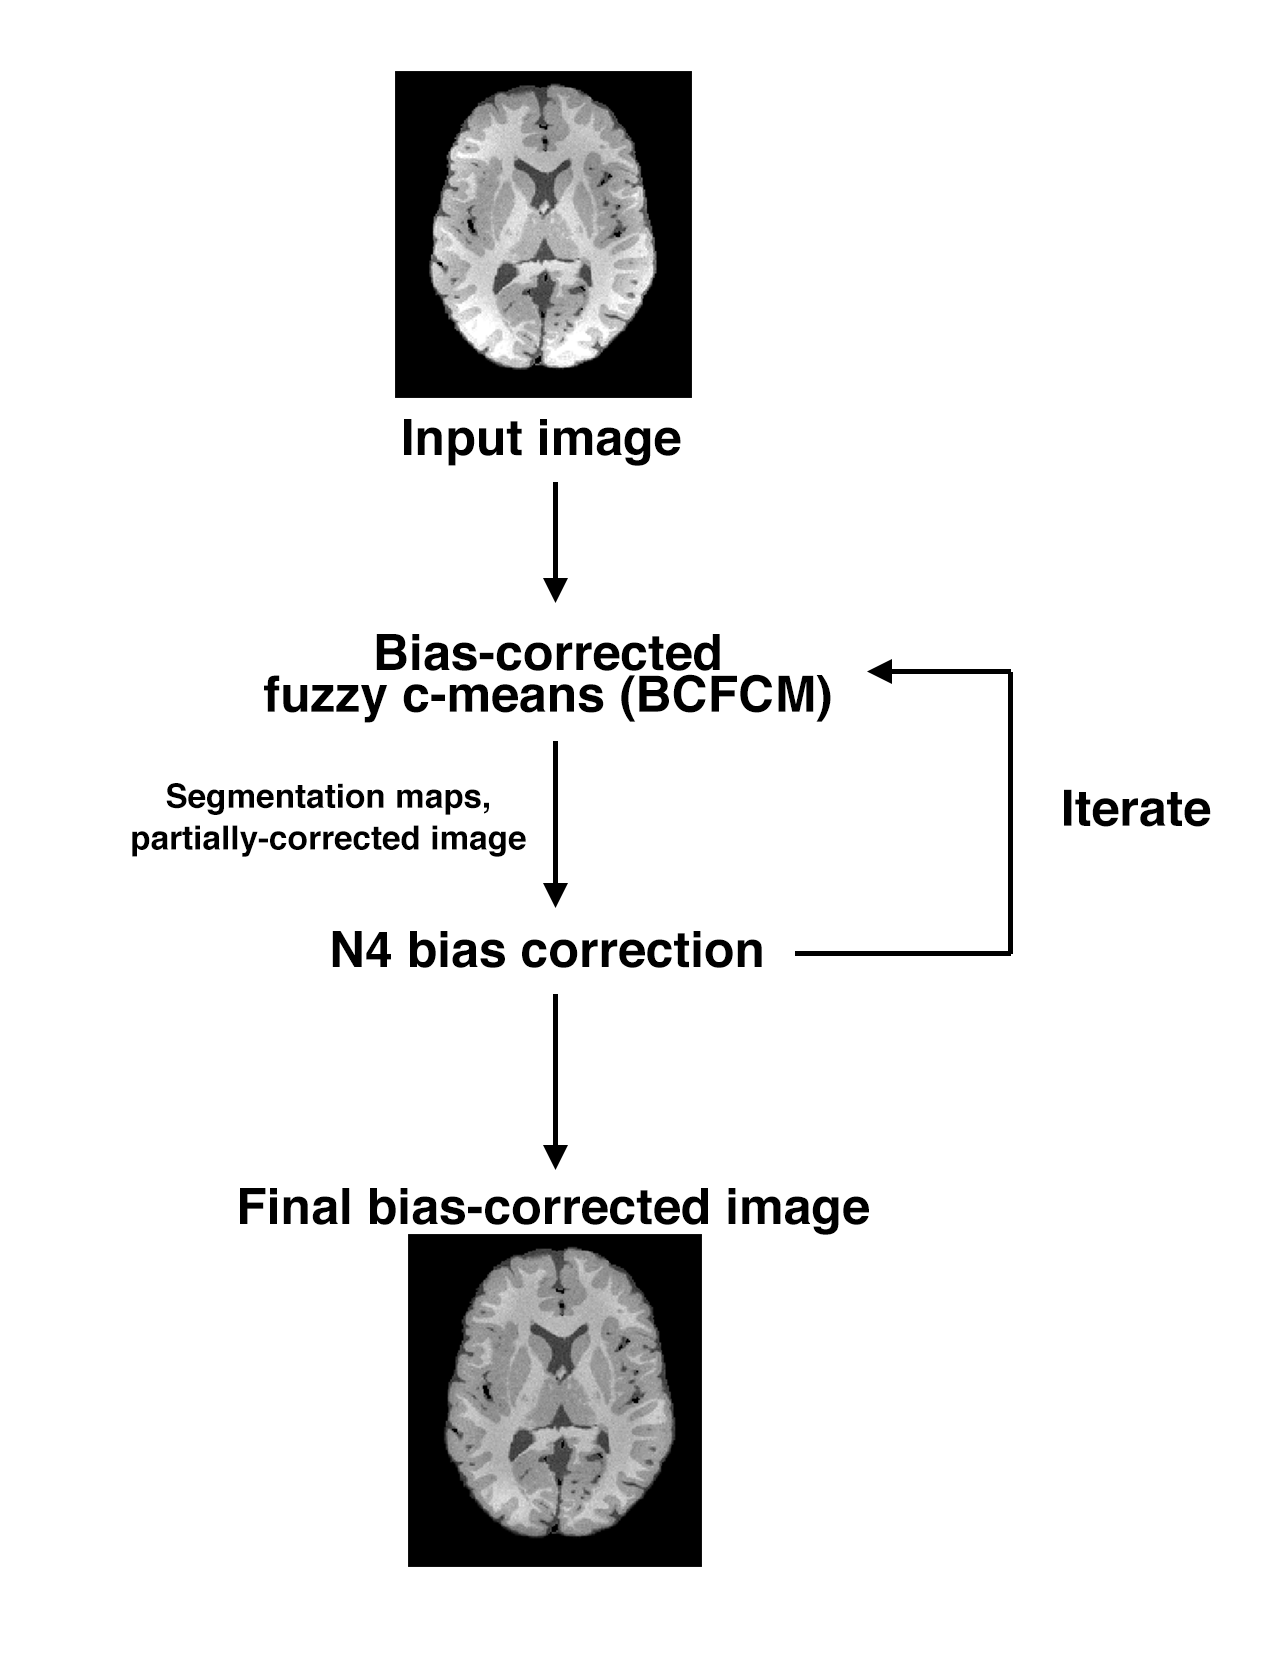
We propose the iterative combination of BCFCM and N4 bias correction (iBCFCM+N4) for improved simultaneous bias correction and segmentation. BCFCM provides a preliminary estimation of the bias field for robust segmentation of tissues to weight the bias correction for robust estimation of the bias field.
Methodology
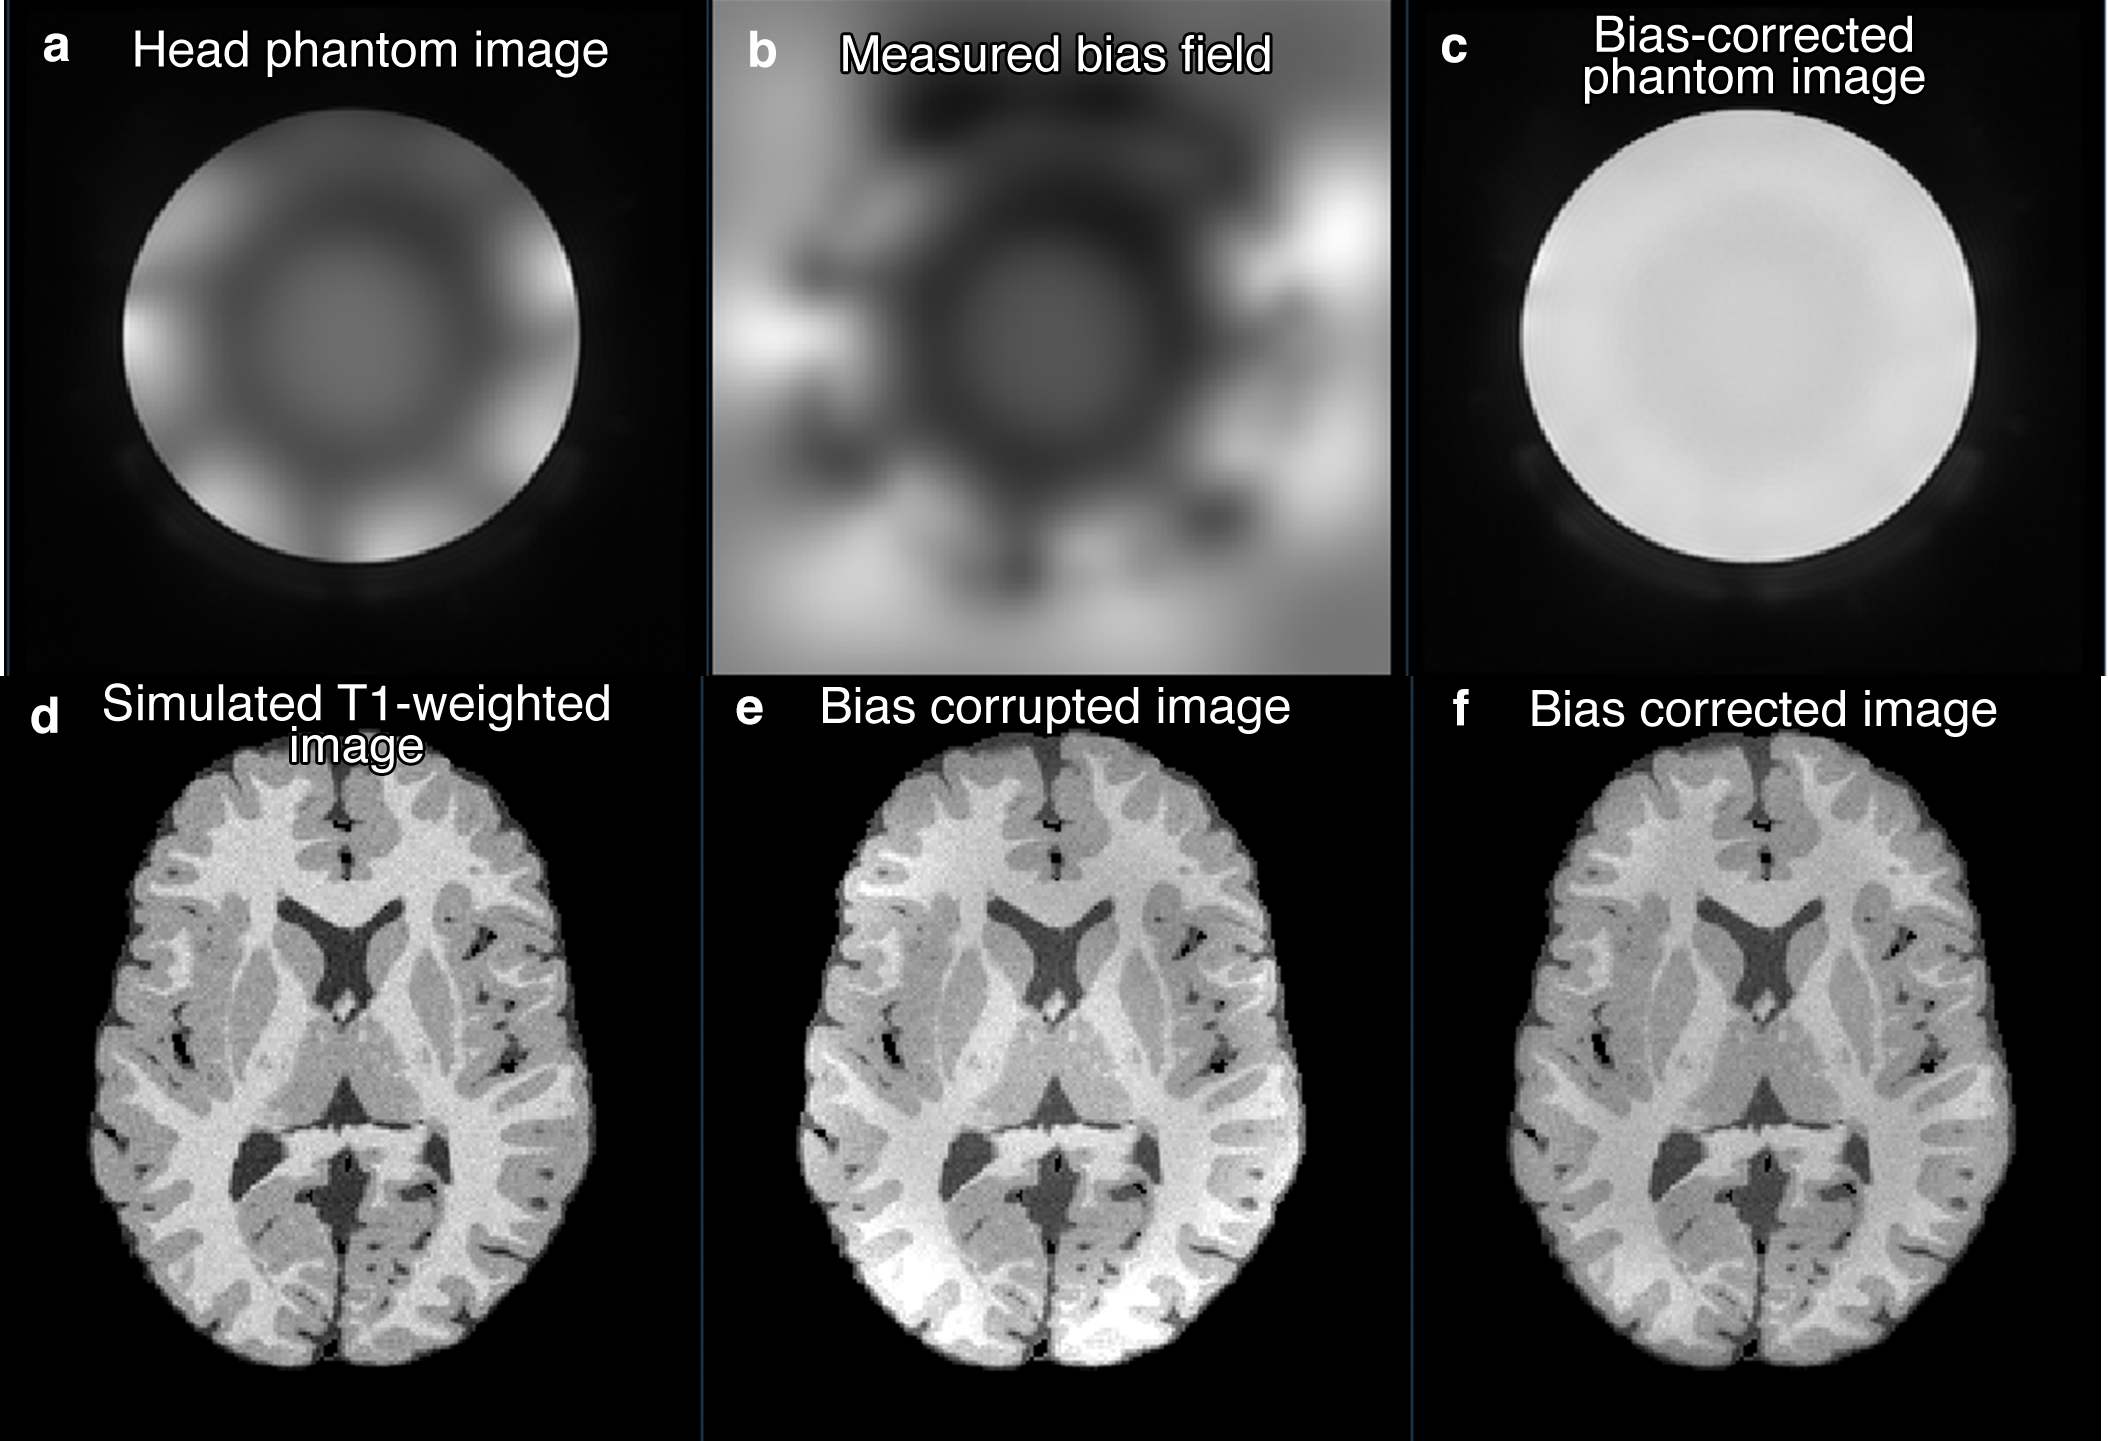
A 7 Tesla bias field was obtained using a head phantom with a 32-channel receive coil (NOVA Medical Inc., Wilmington, MA) and 2-channel transmit with a proton-density weighted zero echo-time (ZTE) pulse sequence (FOV=256mm×256mm×182mm, resolution = 1mm×1mm×1mm, BW=±62.5kHz, FA=2°). This measured bias field was applied to twenty simulated T1-weighted images provided by the BrainWeb database3,4. The synthetic images were processed with the iterative combination of BCFCM and N4 bias correction method as shown in Figure 1, with the same set of parameters applied to all patients. The relative root-mean-square error (RMSE) was measured as
$$RMSE=\sqrt{\frac{1}{N}\sum_N(\frac{x_n-y_n}{y_n})}$$
with the scaled images having a white matter intensity normalized to 1. The original image, bias corrupted image, and bias corrected images were then segmented using k-means clustering. A Jaccard index was measured from resulting segmentation maps. The segmentation results of the bias corrupted image and bias corrected image were compared using a Wilcoxon signed-rank test. The method was then tested on in vivo images in order to qualitatively examine its performance in terms of the effect on brain tissue segmentation with FSL’s automated segmentation tool (FAST)5.
Results
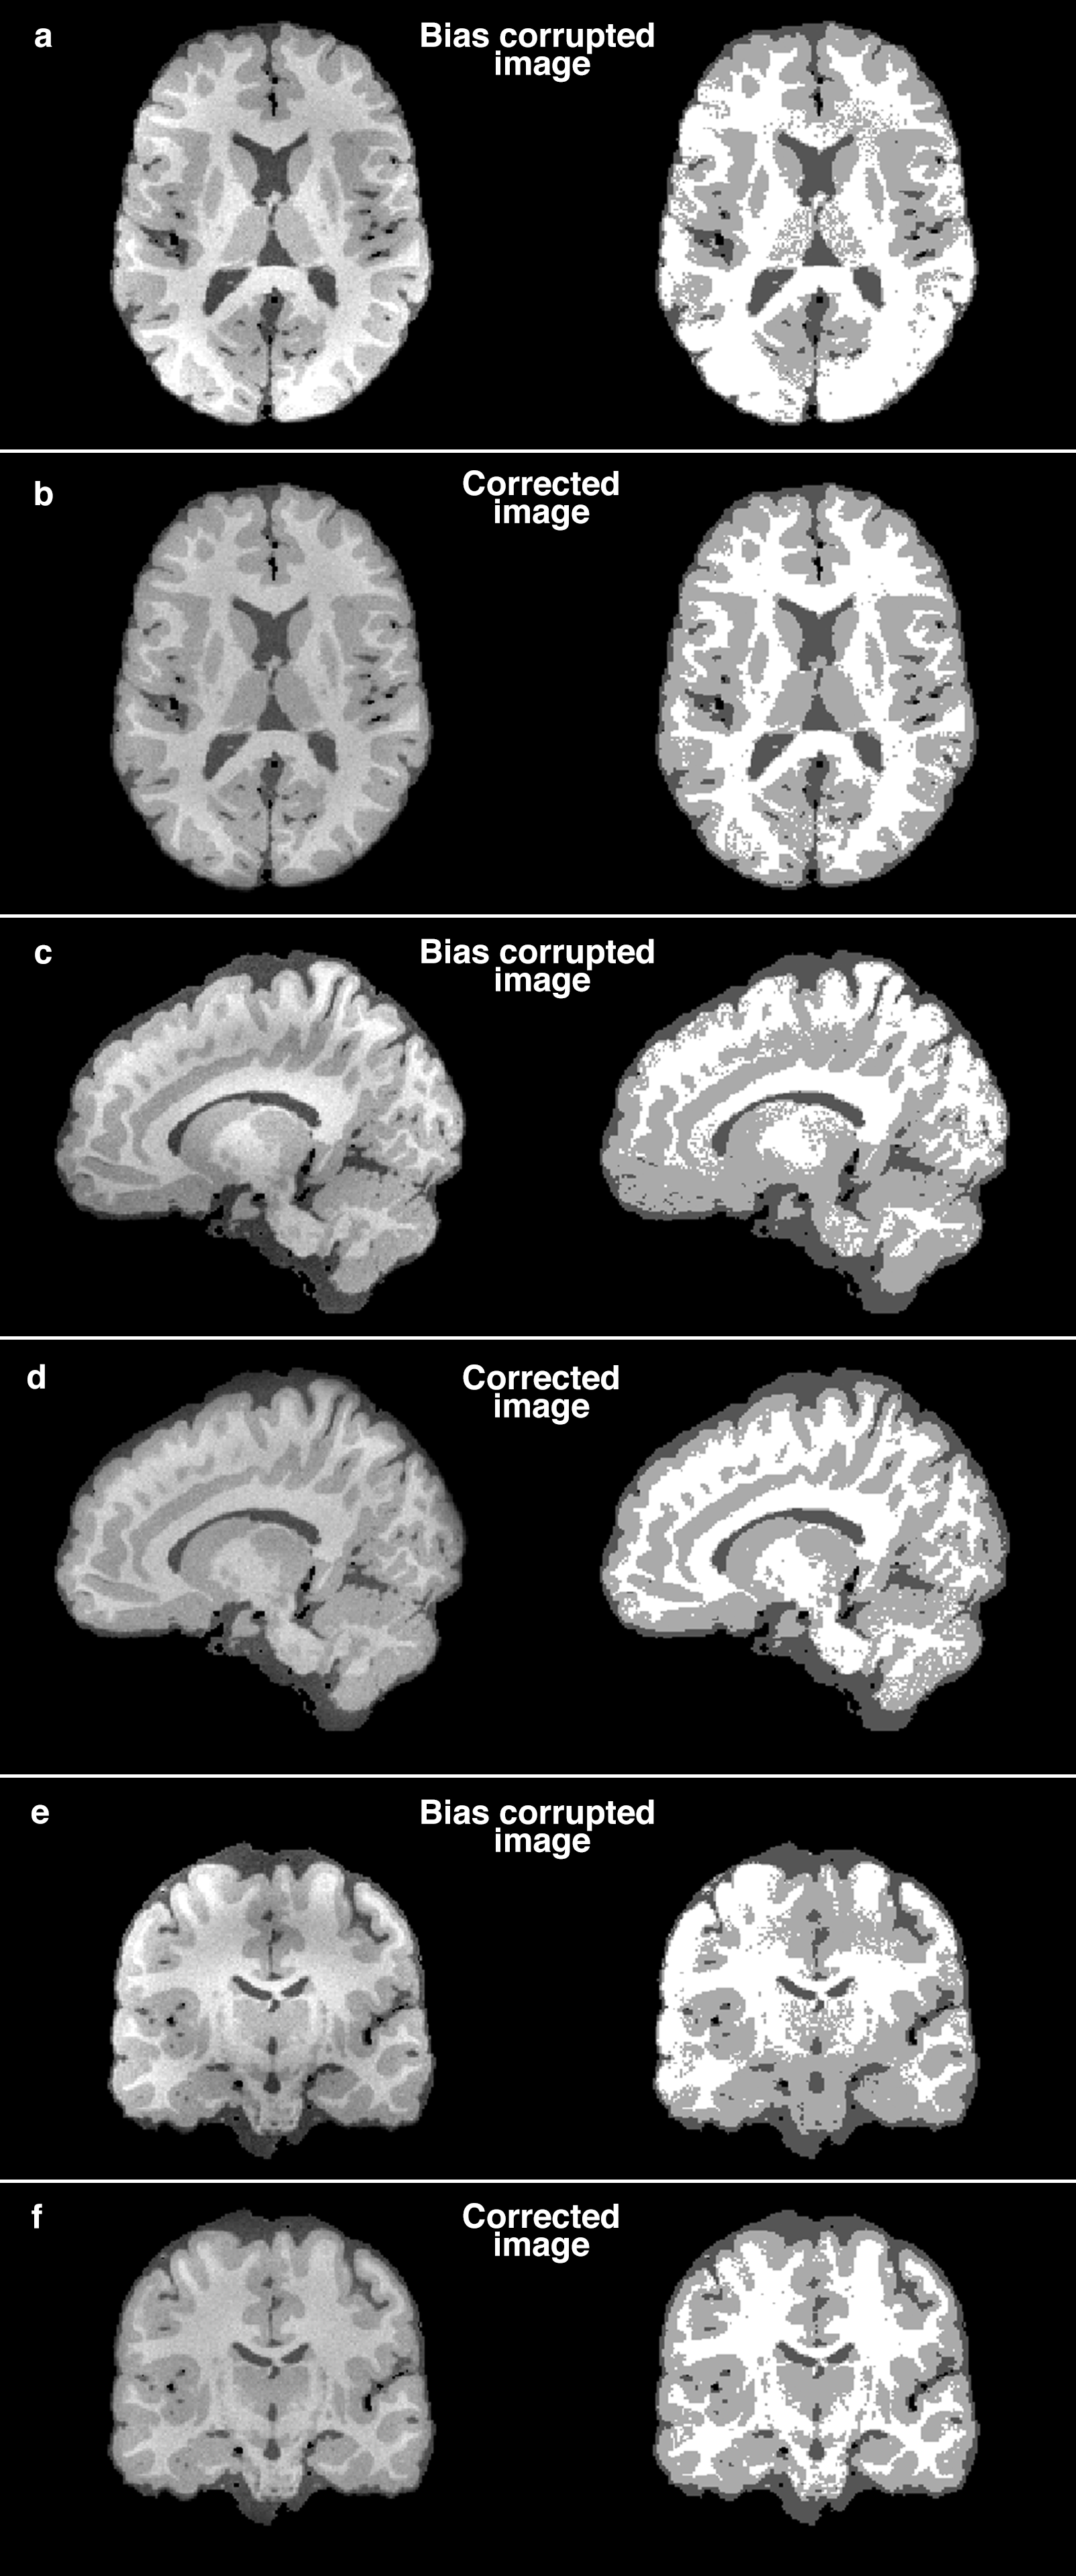
The measured bias field, synthetic images, synthetic images with bias field, and corrected images are shown in Figure 2. The measured bias field has a range of 0.61 to 1.41. The overall relative RMSE is 0.15±0.05, after excluding one outlier having an RMSE of 1.66. The segmentation of the corrected images yields a significantly different (p<0.001) white matter Jaccard index of 0.69±0.04 from 0.56±0.015 and a significantly different (p<0.001) gray matter Jaccard index of 0.67±0.05 from 0.60±0.014 between corrected and uncorrected images. Representative images and segmented maps of grey matter, white matter, and CSF maps are shown in Figure 3.
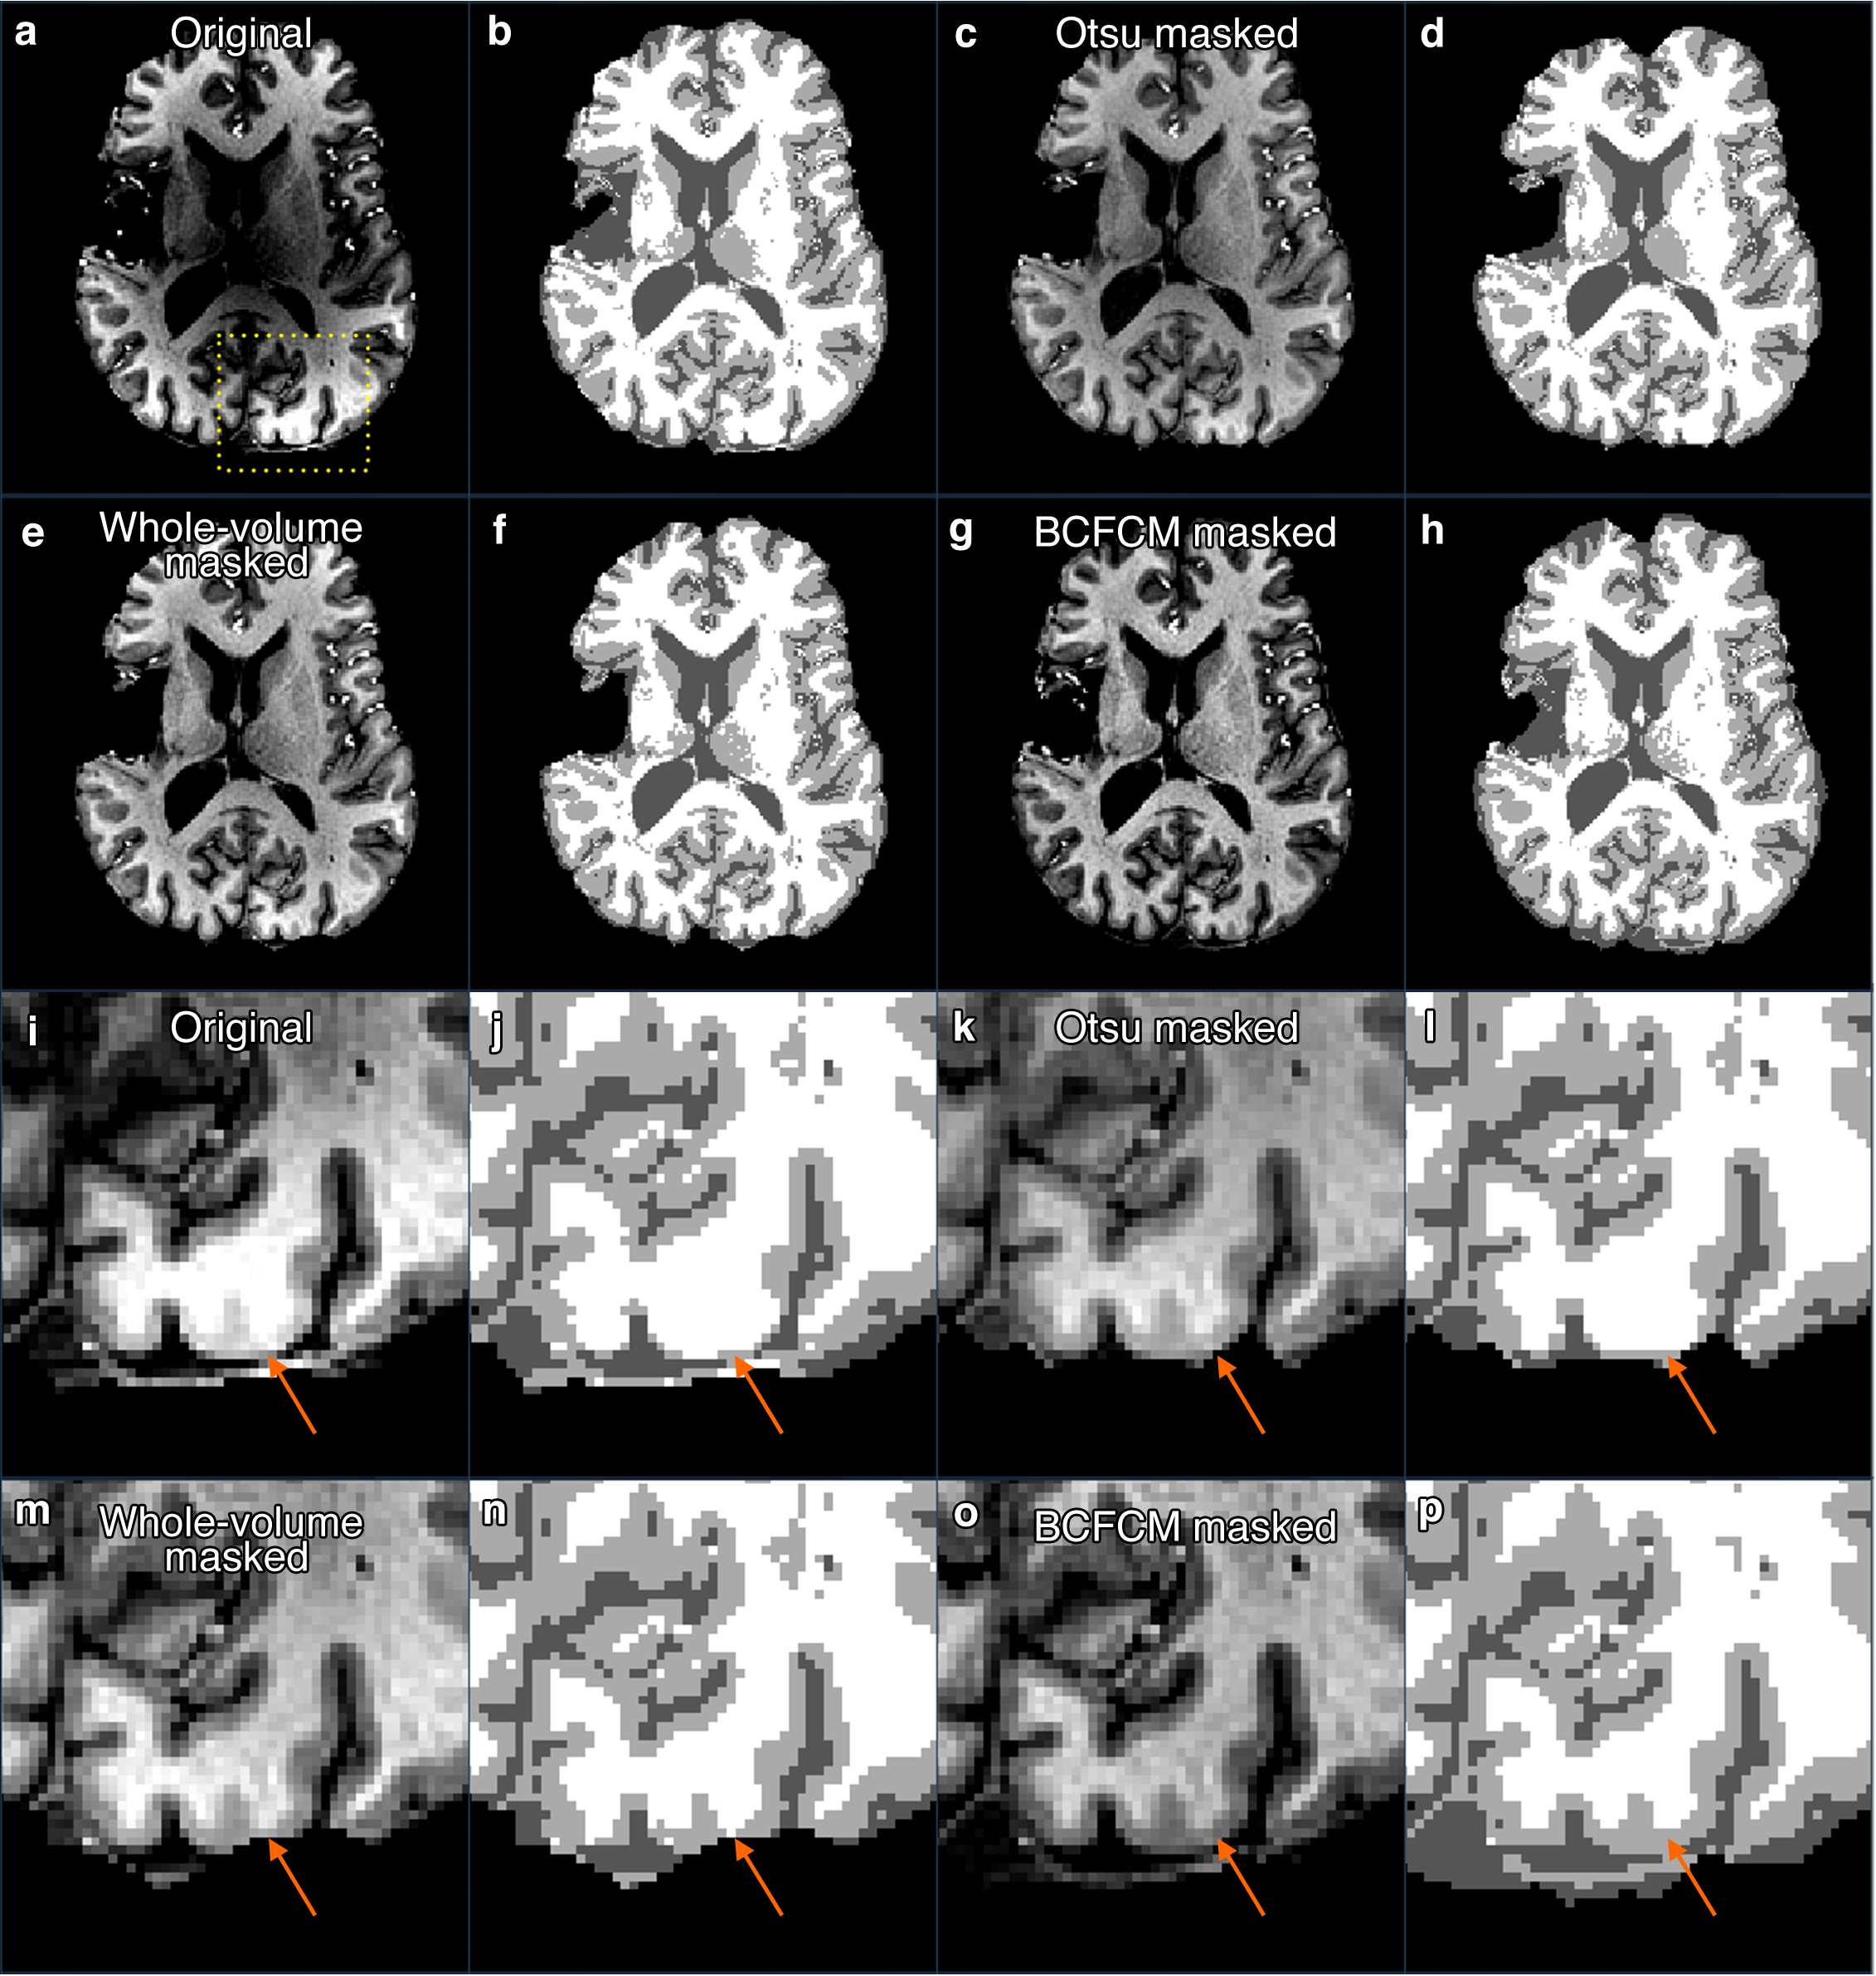
The results of segmentation using FAST are shown in Figure 4. The segmentation using FAST demonstrates that proper bias correction is necessary in order to have accurate cortical segmentation. Comparing with other masking methods (Otsu thresholding, whole-volume mask) for the N4 bias correction, the combination of BCFCM and N4 bias correction yields the most accurate definition of the grey-white matter boundary.
Discussion
The strong intensity inhomogeneity in 7 Tesla imaging can lead to errors in later processing. With the use of the iterative combination of BCFCM and N4 bias correction, this intensity inhomogeneity can be corrected, which improves image-processing results. A major advantage of retrospective bias correction methods is that it is not limited to the type of contrast that is present in the image, making these methods applicable to any image with inhomogenous image intensity.Conclusion
We introduced an iterative combination of BCFCM and N4 bias correction for improved simultaneous bias correction and segmentation. We demonstrated its success with synthetic data applied with a realistic 7 Tesla bias field and showed improved segmentation results for in vivo data using FAST. Since this method is built upon previously evaluated, robust, and freely available tools, it is easily accessible and potentially applicable to a wide range of structural MR imaging sequences.Acknowledgements
This study was supported by R01HD079568 and an investigator initiated grant with GE Healthcare.References
1. Tustison NJ, Avants BB, Cook PA, et al. N4ITK: Improved N3 Bias Correction. IEEE Trans Med Imaging. 2010;29(6):1310-1320. doi:10.1109/TMI.2010.2046908.
2. Ahmed MN, Yamany SM, Mohamed N, Farag AA, Moriarty T. A modified fuzzy c-means algorithm for bias field estimation and segmentation of MRI data. IEEE Trans Med Imaging. 2002;21(3):193-199. doi:10.1109/42.996338.
3. BrainWeb: Simulated Brain Database. http://brainweb.bic.mni.mcgill.ca/brainweb/. Accessed November 9, 2016.
4. Collins DL, Zijdenbos AP, Kollokian V, et al. Design and construction of a realistic digital brain phantom. IEEE Trans Med Imaging. 1998;17(3):463-468. doi:10.1109/42.712135.
5. Zhang Y, Brady M, Smith S. Segmentation of brain MR images through a hidden Markov random field model and the expectation-maximization algorithm. IEEE Trans Med Imaging. 2001;20(1):45-57. doi:10.1109/42.906424.
Figures