5216
Pseudo-SSFP magnetic resonance fingerprinting (MRF) at 9.4T1Department of Biomedical Sciences, Seoul National University, Seoul, Korea, Republic of, 2Department of Radiology, Seoul National University Hospital, Seoul, Korea, Republic of
Synopsis
A balanced steady-state-free-precession (bSSFP) sequence may be preferred in magnetic resonance fingerprinting (MRF) for its high SNR. However, as demonstrated recently at 3.0T, the echo formation in bSSFP is hindered by randomly varying flip-angles in a B0-dependent manner, and yet, the destroyed spin-echo-like signal behavior can be restored by tailoring sequence timings according to varying flip-angles such that the spin ensemble is driven into a pseudo-steady-state. Given more severe B0-inhomogeneity at high-field, we explored the efficacy of the pseudo-steady-state-free-precession (pSSFP) sequence in MRF (pSSFP-MRF) at 9.4T. Our results suggest that pSSFP-MRF has great potential for single-scan multiparameter mapping at high-field.
Purpose
Magnetic resonance fingerprinting (MRF) is a single-scan multi-parametric MRI method1. A balanced steady-state-free-precession (bSSFP) sequence may be preferred in MRF for its high SNR. However, it was demonstrated recently at 3.0T2 that the echo formation in bSSFP is hindered by randomly varying flip angles (FAs) and sequence timings in a B0-dependent manner, and that the destroyed spin-echo-like signal behavior of bSSFP therein can largely be restored by prescribing the MRF sequence timings according to the varying FAs such that the spin ensemble can be driven into a pseudo-steady-state. Given more severe B0-inhomogeneity at high field, the purposes of the study was to explore the efficacy of the pseudo-steady-state-free-precession (pSSFP)2 sequence in MRF (pSSFP-MRF) at 9.4T.Methods
Experimental data were acquired on a 9.4T scanner with a single-channel surface coil (Agilent). Matlab (Mathworks Inc.) and SPSS (IBM) were used for dictionary generation and data post-processing, and for statistical analysis, respectively.
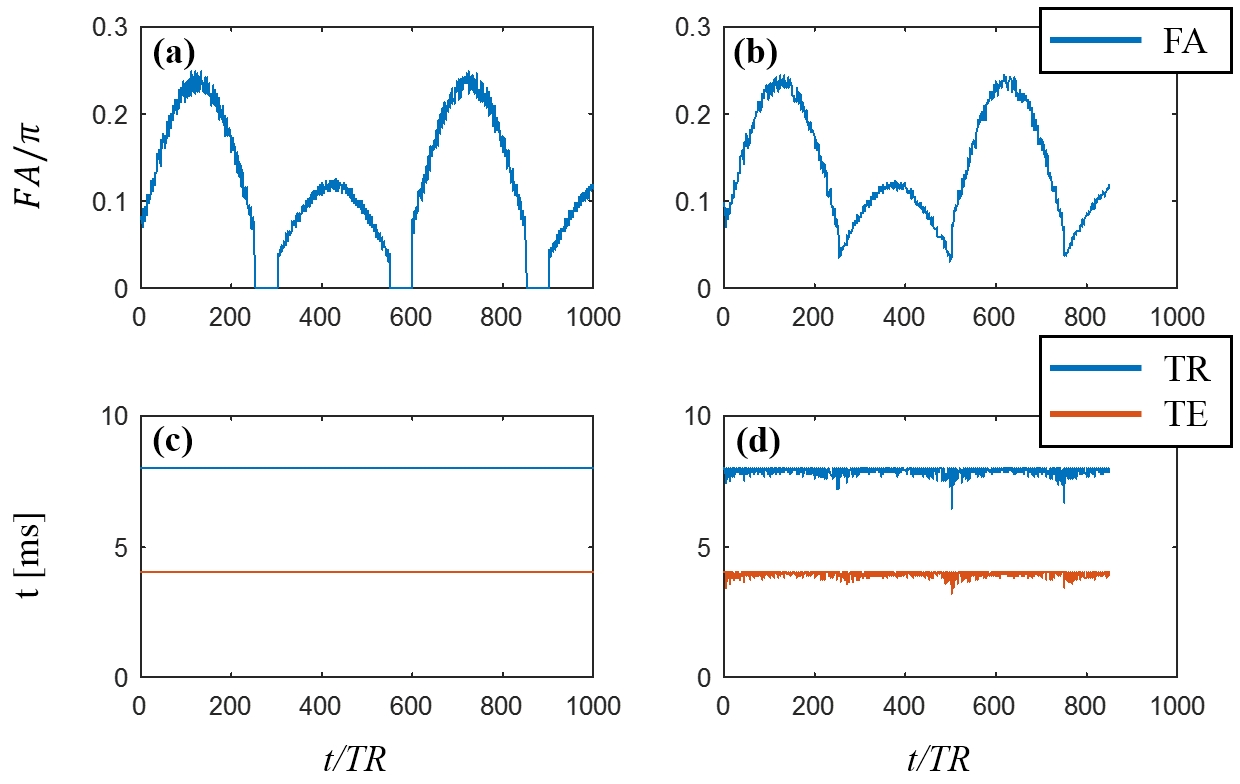
Pulse sequence design: In the design of an inversion-recovery pSSFP-MRF sequence with Cartesian encoding, FAs were set in the range of 10~40° (standard deviation=5°), and then, TRs and TEs for the generation of pSSFP were calculated as previously described2 (Fig.1). For an inversion-recovery bSSFP MRF (SSFP-MRF) sequence with Cartesian encoding that was also designed for comparison, the original FA pattern1 was employed with a 5 s delay1,3 between each phase-encoding loop, and TRs and TEs were fixed in order to better depict the unstable signal behavior resulting from varying FA2 (Fig.1). A hyperbolic secant pulse and a sinc pulse (duration=2 ms for both) were used for inversion and excitation, respectively, for both sequences.
Phantom experiments: Five phantoms (2 cc vials) were made with different MnCl2 concentrations3,4 (Fig.2). The phantoms were scanned 15 times with different positions in the same imaging plane such that the results can be obtained under different degrees of B0-inhomogeneity for each phantom (FOV=40x40 mm2 and matrix size=128x128). A conventional spin-echo sequence was used for the estimation of proton-density, T1 (10 inversion times of 10/20/40/84/172/349/711/1450/2900/6000 ms) and T2 (13 TEs of 6.3/8/10/15/20/25/30/40/60/90/150/200/300 ms) of the phantoms as a reference (one measurement; TR=10 s, FOV=50x50 mm2, and matrix size=128x128).
Dictionary generation and pattern matching: Dictionary was generated by using the extended phase graph approach. The ranges of T1, T2, and B0-offset frequency were 150~2480 ms (step size=10 ms for 150~510 ms, 30 ms for 510~1530 ms, and 50 ms for 1530~2480 ms), 5~242 ms (step size=1 ms for 5~31 ms, 2 ms for 31~49 ms, 5 ms for 52~202 ms, and 10 ms for 202~242 ms), and -70~70 Hz (step size=5 Hz), respectively. A normalized cross correlation, which is a zero-mean inner product of two normalized vectors, was calculated for pattern matching between the simulated and experimental complex fingerprints. Proton-density-, T1-, and T2-maps were obtained for SSFP-MRF and pSSFP-MRF. In addition, B0-maps was obtained for SSFP-MRF2.
Results
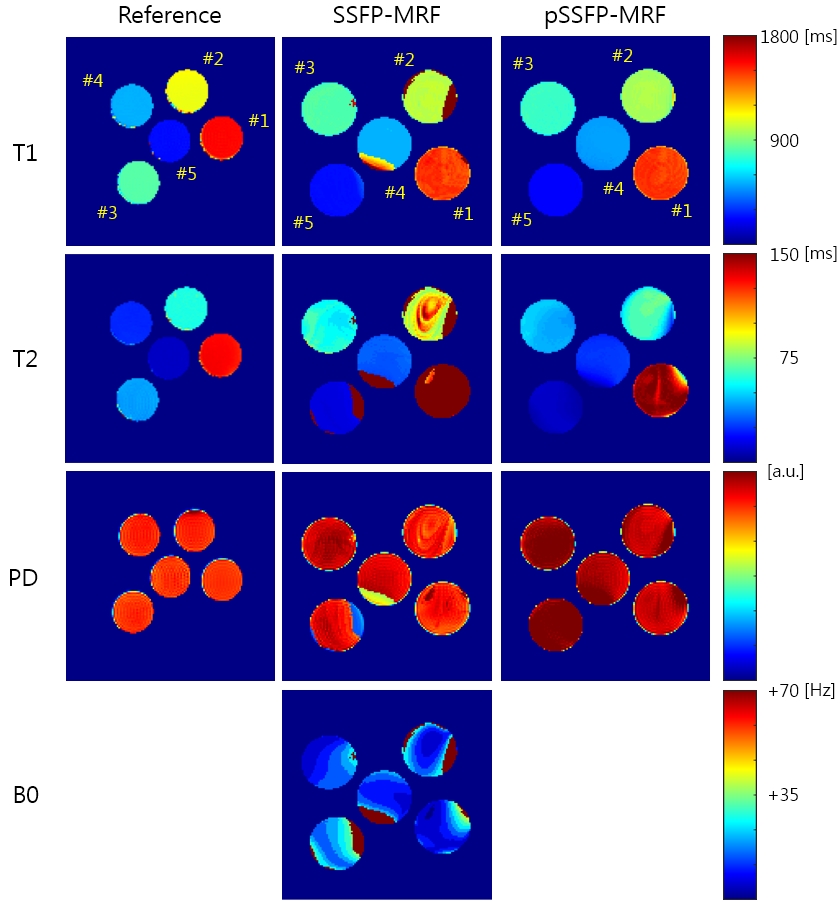
The parameter-maps obtained by SSFP-MRF and pSSFP-MRF are compared in Fig.2. For SSFP-MRF, a B0-map is also available, which demonstrates severe B0-inhomogeneity across the phantoms. Overall, more homogeneous parameter-maps were obtained with pSSFP-MRF, esp., in the T2-maps.
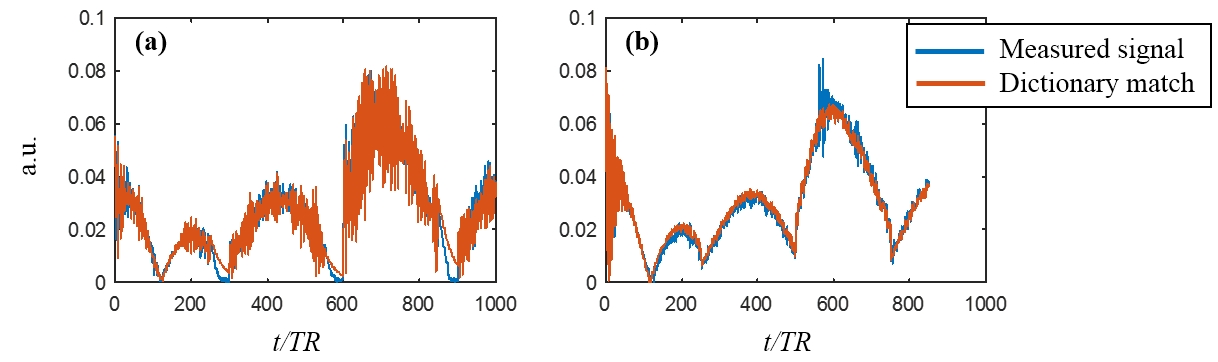
The representative signal evolutions in SSFP-MRF and pSSFP-MRF are compared in Fig.3. The severe signal fluctuation resulting from the varying FAs in SSFP-MRF is substantially reduced in pSSFP-MRF.
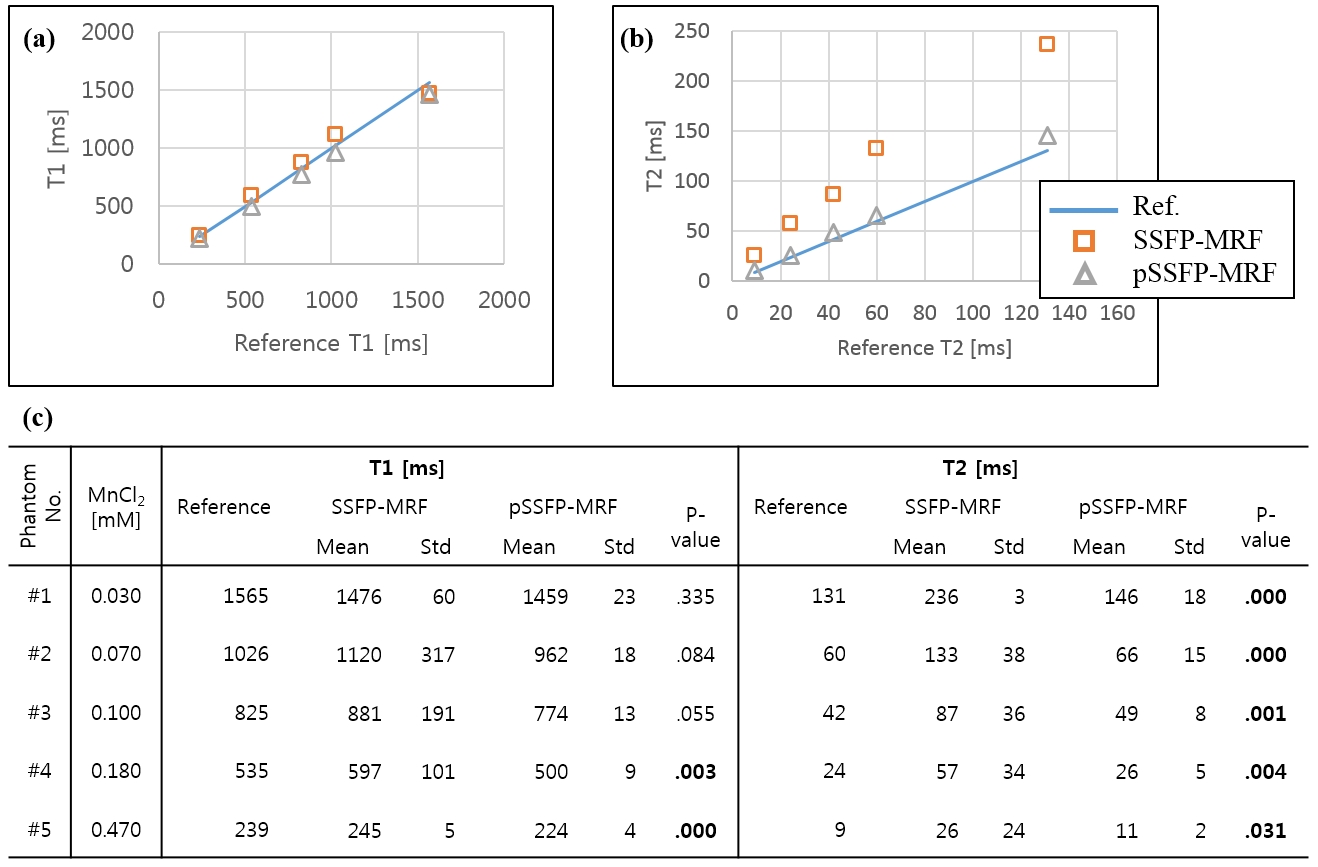
The mean and standard deviation values of T1 and T2 of the phantoms over the 15 measurements with different phantom positions are compared in Fig.4 for SSFP-MRF and pSSFP-MRF. The performance of the two approaches appear comparable in T1 estimation. However, pSSFP-MRF clearly outperforms SSFP-MRF in T2 estimation. Overall, the standard deviations of T1 and T2 are drastically reduced with pSSFP-MRF.
Discussion
A strategy for benefiting from the high SNR of bSSFP in MRF has recently been reported at 3.0T2. Although very preliminary, our phantom study demonstrates the potential efficacy of the pSSFP-MRF at 9.4T as well. The severe signal fluctuation resulting from the varying FAs in combination with B0-inhomogeneity in SSFP-MRF appears effectively reduced in pSSFP-MRF by incorporating TRs and TEs tailored to a given FA pattern into the sequence design for the restoration of the spin-echo-like signal behavior of bSSFP. The parameter-maps and quantitative results are also in support of more robust performance of pSSFP-MRF than SSFP-MRF at this high field, particularly in T2 mapping, which is known to be less accurate than T1 mapping in conventional MRF approaches2,3,5. Further exploration of the efficacy of pSSFP-MRF at this high field is currently underway in vivo with undersampling.Conclusion
The pSSFP-MRF approach has great potential for single-scan multiparameter mapping at high field.Acknowledgements
This research was supported by Basic Science Research Program through the NRF of Korea funded by the Ministry of Education, Science and Technology (2013R1A1A2013516), and by the Bio & Medical Technology Development Program of the NRF funded by the Korean government, MSIP (NRF-2014M3A9B6069340).
References
1. Ma D, Gulani V, Seiberlich N, et al. Magnetic resonance fingerprinting, Nature 2013;495:187-193.
2. Assländer J, Glaser SJ, Hennig J. Pseudo Steady-State Free Precession for MR-Fingerprinting, Magn Reson Med. 2016;doi:10.1002/mrm.26202.
3. Gao Y, Chen Y, Ma D, et al. Preclinical MR fingerprinting (MRF) at 7 T: effective quantitative imaging for rodent disease models, NMR Biomed. 2015;28:384-394.
4. Ben-Eliezer N, Sodickson DK, Block KT. Rapid and Accurate T2 Mapping from Multi-Spin-Echo Data Using Bloch-Simulation-Based Reconstruction, Magn Reson Med. 2015;73:809-817.
5. Buonincontri G, Sawiak SJ. MR fingerprinting with
simultaneous B1 estimation. Magn Reson Med. 2016;76:1127-1135.
Figures