5214
Fluid and white matter suppression (FLAWS) with MP2RAGE sequence at 7T.1Siemens Healthcare K.K., Tokyo, Japan, 2Advanced Clinical Imaging Technology, Siemens Healthcare AG, Lausanne, Switzerland, 3Department of Radiology, University Hospital (CHUV), Lausanne, Switzerland, 4LTS5, École Polytechnique Fédérale de Lausanne (EPFL), Lausanne, Switzerland, 5Siemens Medical Solutions, Inc., United States, 6Kyoto University, Kyoto, Japan
Synopsis
Fluid and white matter suppression (FLAWS) is a technique to suppress cerebrospinal fluid (CSF) and white matter (WM) using the MP2RAGE sequence, which has been introduced for 3T. In this study, FLAWS was applied at 7T and compared to a SPACE double inversion recovery (DIR). Inversion times of the sequences were optimized for volunteer brain images at 7T. FLAWS showed better suppression of CSF and WM, more homogeneous gray matter (GM) delineation, as well as better GM/WM contrast compared with DIR.
PURPOSE
Cerebrospinal fluid (CSF) and white matter (WM) signal suppression techniques are known to increase WM lesion conspicuity. Their application at ultra high field (UHF) MRI is attractive because of increased SNR and thus higher possible spatial resolutions, which can be crucial for imaging small structures. Double inversion recovery (DIR) has previously been applied to multiple sclerosis at 7T [1]. Another technique of fluid and white matter suppression based on the magnetization-prepared with two rapid gradient echoes (MP2RAGE) sequence dubbed “FLAWS” has been proposed for 3T [2]. In this study, FLAWS was introduced to 7T MRI and compared with a DIR acquisition.METHODS
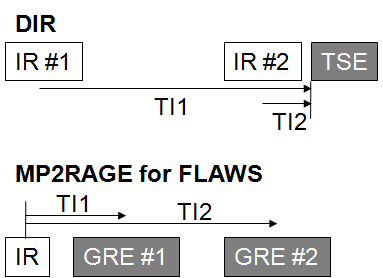
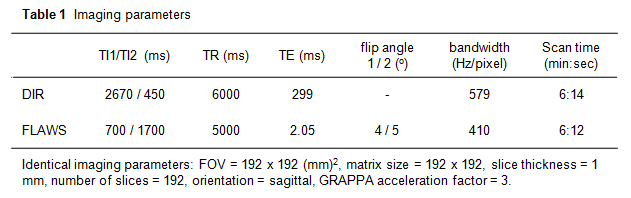
Eleven healthy volunteers were examined using a 7T whole-body scanner (Siemens, Erlangen, Germany) and a 32-channel head coil (Nova Medical, USA). The study was approved by the local ethics committee. Both DIR and FLAWS images were obtained using prototype pulse sequences. The two inversion times (TI1/TI2) of the DIR sequence were defined as delays between the two inversion pulses to the excitation pulse of the 3D TSE-SPACE readout (Fig. 1, top). The corresponding inversion times of the MP2RAGE sequence for FLAWS were defined as the delays between the initial inversion pulse and the two gradient echo (GRE) readouts (Fig. 1, bottom). FLAWS images were generated by taking the minimum pixel value from the two GRE images. Isotropic spatial resolution and scan time of DIR and FLAWS images were adjusted to 1 mm and approximately 6 minutes; other imaging parameters are listed in Table 1. The inversion times of both sequences were empirically optimized. Local specific absorption rates (SARs) in the head were recorded after termination of the scans. In addition, classical T1-weighted MPRAGE images were obtained for brain segmentation.
Image analysis was carried out using SPM12 on MATLAB (MathWorks, USA). DIR and FLAWS images were co-registered onto the corresponding T1-weighted MPRAGE image for each subject, which was in turn normalized to MNI standard brain space. Gray matter (GM) and WM were segmented on the normalized MPRAGE image. The GM and WM label masks were applied to the normalized DIR and FLAWS images to obtain GM/WM contrast ratios by taking the medians of GM and WM signals in each subject and subsequent averaging over all subjects. Signal defect regions were defined as voxels where the signal intensity was lower than 20 % of the corresponding median in the segmented region. Signal defect ratios were calculated as the signal defect volume divided by the corresponding segmented volume in each subject, and then averaged over all subjects.
RESULTS
The optimal TI1 and TI2 of the DIR sequence at TR=6s were found to be 2670 and 450 msec. The respective TI1/TI2 of the MP2RAGE-FLAWS with TR=5s was determined as 700 and 1700 msec. The local SAR in the head occurring during a DIR scan was on average 2.4 times higher than that of FLAWS scan.
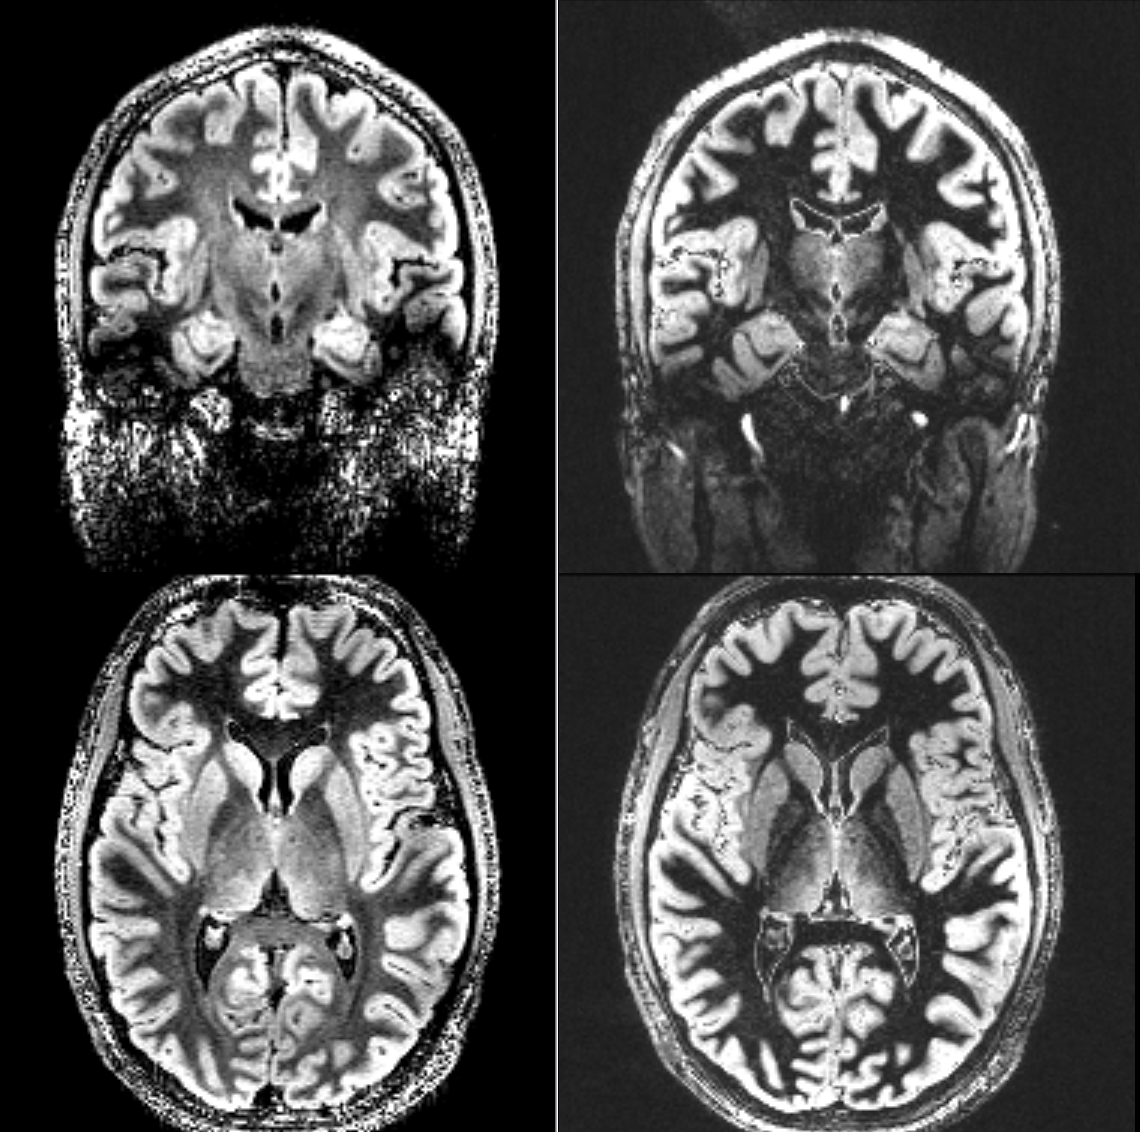
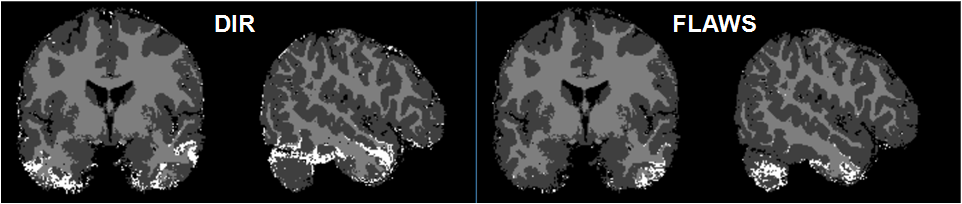
Fig. 2 shows DIR (left) and FLAWS (right) images of an exemplary subject. CSF was well suppressed in both of DIR and FLAWS images. However, WM suppression was not uniform in DIR. Averaged contrast ratios of GM/WM in DIR and FLAWS images were 1.57 ± 0.21 and 3.90 ± 0.38 (mean ± SD). Fig. 3 shows signal defect pixels (white) in DIR (left) and FLAWS (right) images, which were mainly distributed around skull base. Signal defect ratios of GM in DIR and FLAWS images were 7.0 ± 1.7 % and 2.4 ± 0.7 %, respectively.
DISCUSSION
Obtaining high quality images in UHF MR for pulse sequences requiring large flip angle RF pulses is challenging. Especially inversion pulses with a large bandwidth (to compensate the more severe B0 effects at UHF) and good inversion efficiency across the brain are difficult to design. In this respect, MP2RAGE-FLAWS with a single inversion pulse and two rather robust small flip-angle GRE readouts is advantageous compared to DIR having two inversion pulses and a TSE-SPACE readout with refocus pulses. As a result, DIR images exhibited non-uniformity of both WM suppression and GM delineation. This was aggravated by the use of a local transmit coil, causing a B1 gradient along the Z-axis, which affected the image quality of the lower part of the DIR volumes (well-visible in coronal view, see Fig. 2, upper-left).
Further studies should evaluate conspicuity of tissue abnormalities in T1-weighted MP2RAGE-FLAWS compared to the T2-weighted DIR in patients at UHF.
CONCLUSION
MP2RAGE-FLAWS showed better suppression of both CSF and WM, GM/WM contrast, and uniform GM delineation compared with the DIR sequence in volunteer brain images acquired at 7T.Acknowledgements
This work is supported by METI/JETRO Subsidy Program for Global Innovation Centers.References
1. de Graaf WL et al. Lesion detection at seven Tesla in multiple sclerosis using magnetisation prepared 3D-FLAIR and 3D-DIR. Eur Radiol 2012;22:221-231.
2. Tanner M et al. Fluid and white matter suppression with the MP2RAGE sequence. J Magn Reson Imaging 2012;35:1063-1070.
Figures