5213
An SNR analysis of DENSE at 7T vs 3T for the measurement of whole brain tissue pulsatility1Department of Radiology, University Medical Center Utrecht, Utrecht, Netherlands
Synopsis
Cardiac induced brain tissue pulsatility holds potential as a means to study the viscoelastic properties of the aging brain. In this study we measured the brain tissue motion in 8 healthy volunteers with DENSE at both 7T and 3T, and assessed the gain in SNR between field strengths. 4D SNR maps for both field strengths were made and examined with a robust histogram analysis. The mean SNR for all volunteers at 7T and 3T was 21.2 ± 6.3 and 7.1 ± 2.5 respectively. The higher SNR at 7T will likely yield greater accuracy in quantifying brain tissue pulsatility.
Purpose
Non-invasive assessment of the cardiac induced brain tissue pulsatility provides a window on both the viscoelastic properties of the brain and on one of the factors driving the waste clearance system in the brain1-3. As brain stiffness4 and clearance by cerebrospinal fluid production change with ageing5, brain tissue pulsatility holds potential as a means to study the aging brain.
Displacement encoding with stimulated echoes (DENSE) is capable of measuring brain motion6, although it yields long measurement times and low SNR. The purpose of this work was to implement DENSE at 7T and to assess the gain in SNR compared to 3T.
Method
Measurement
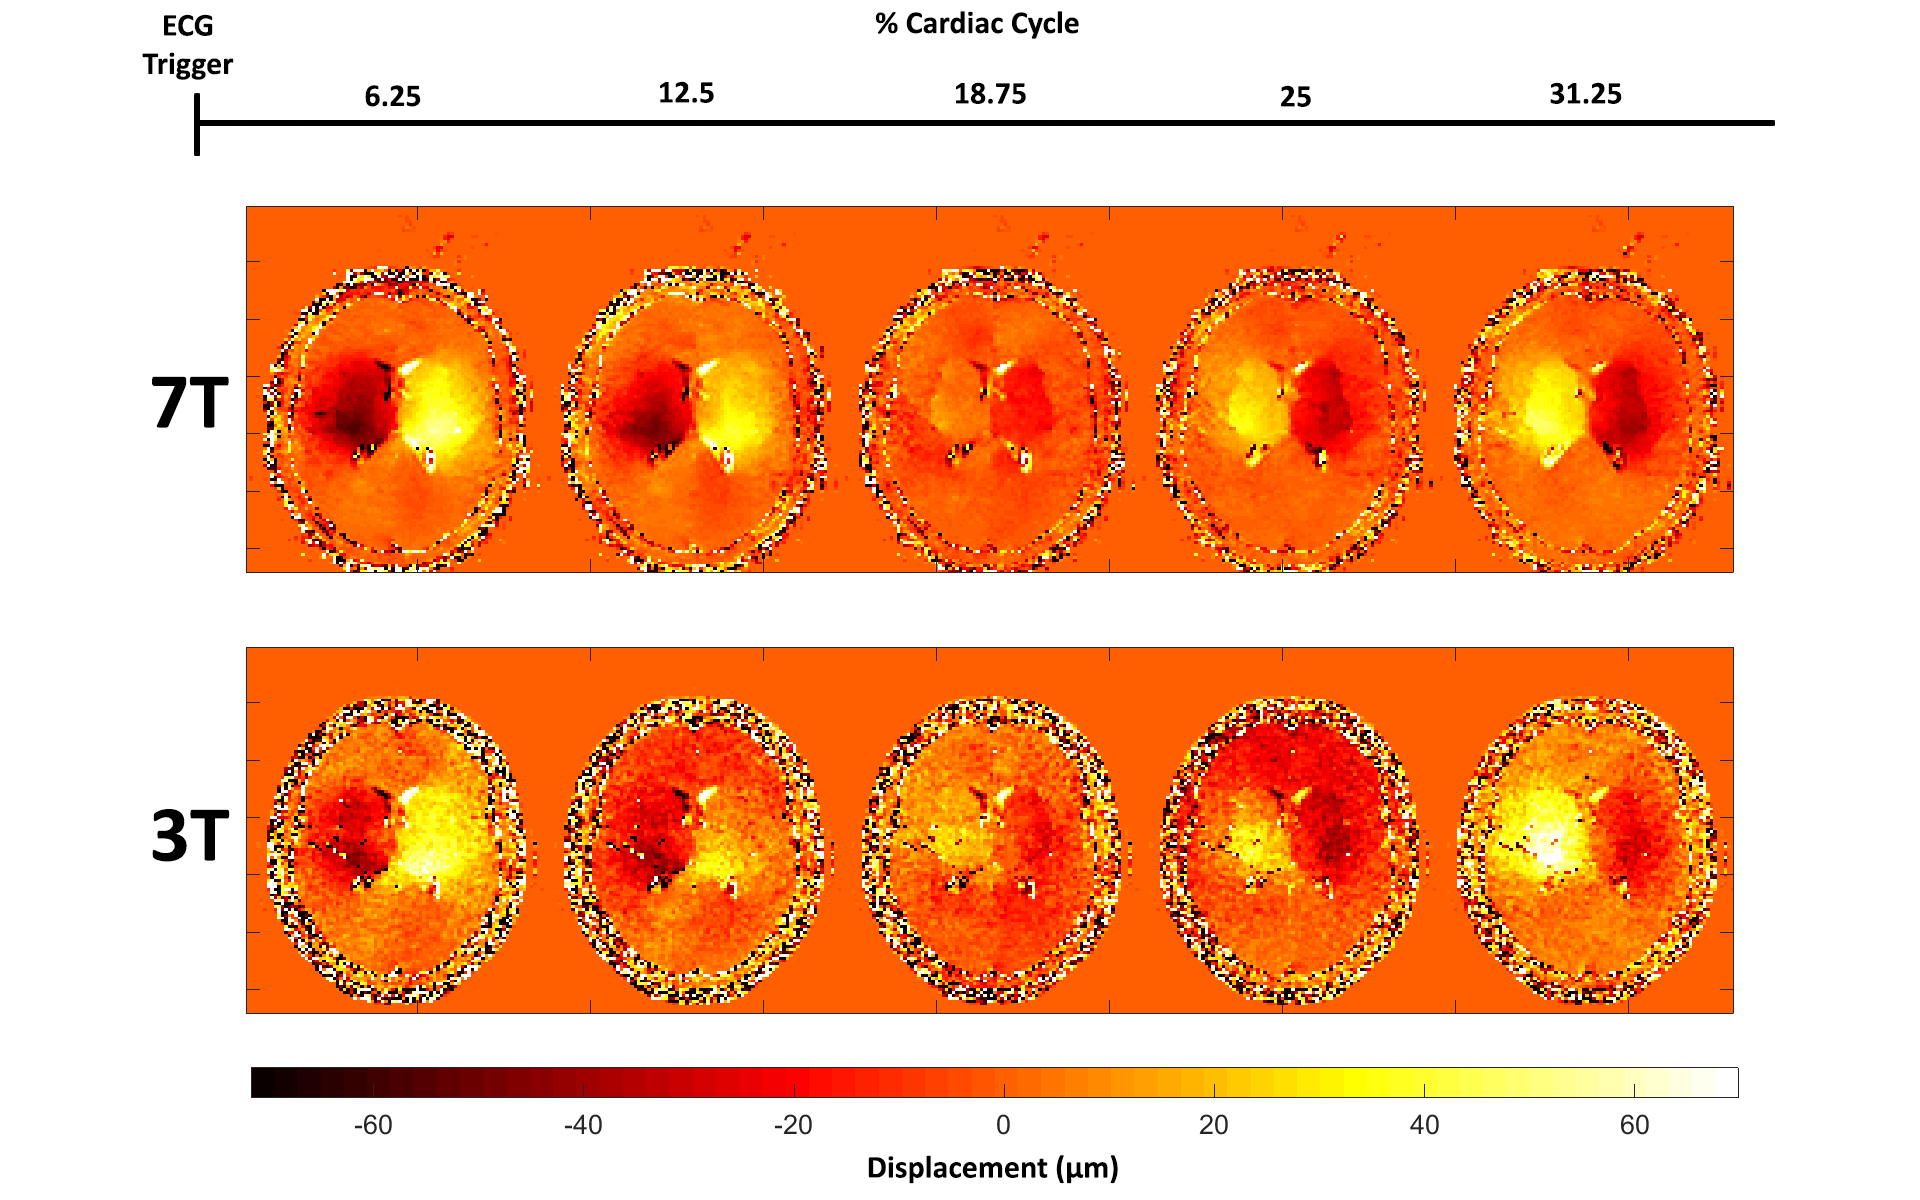
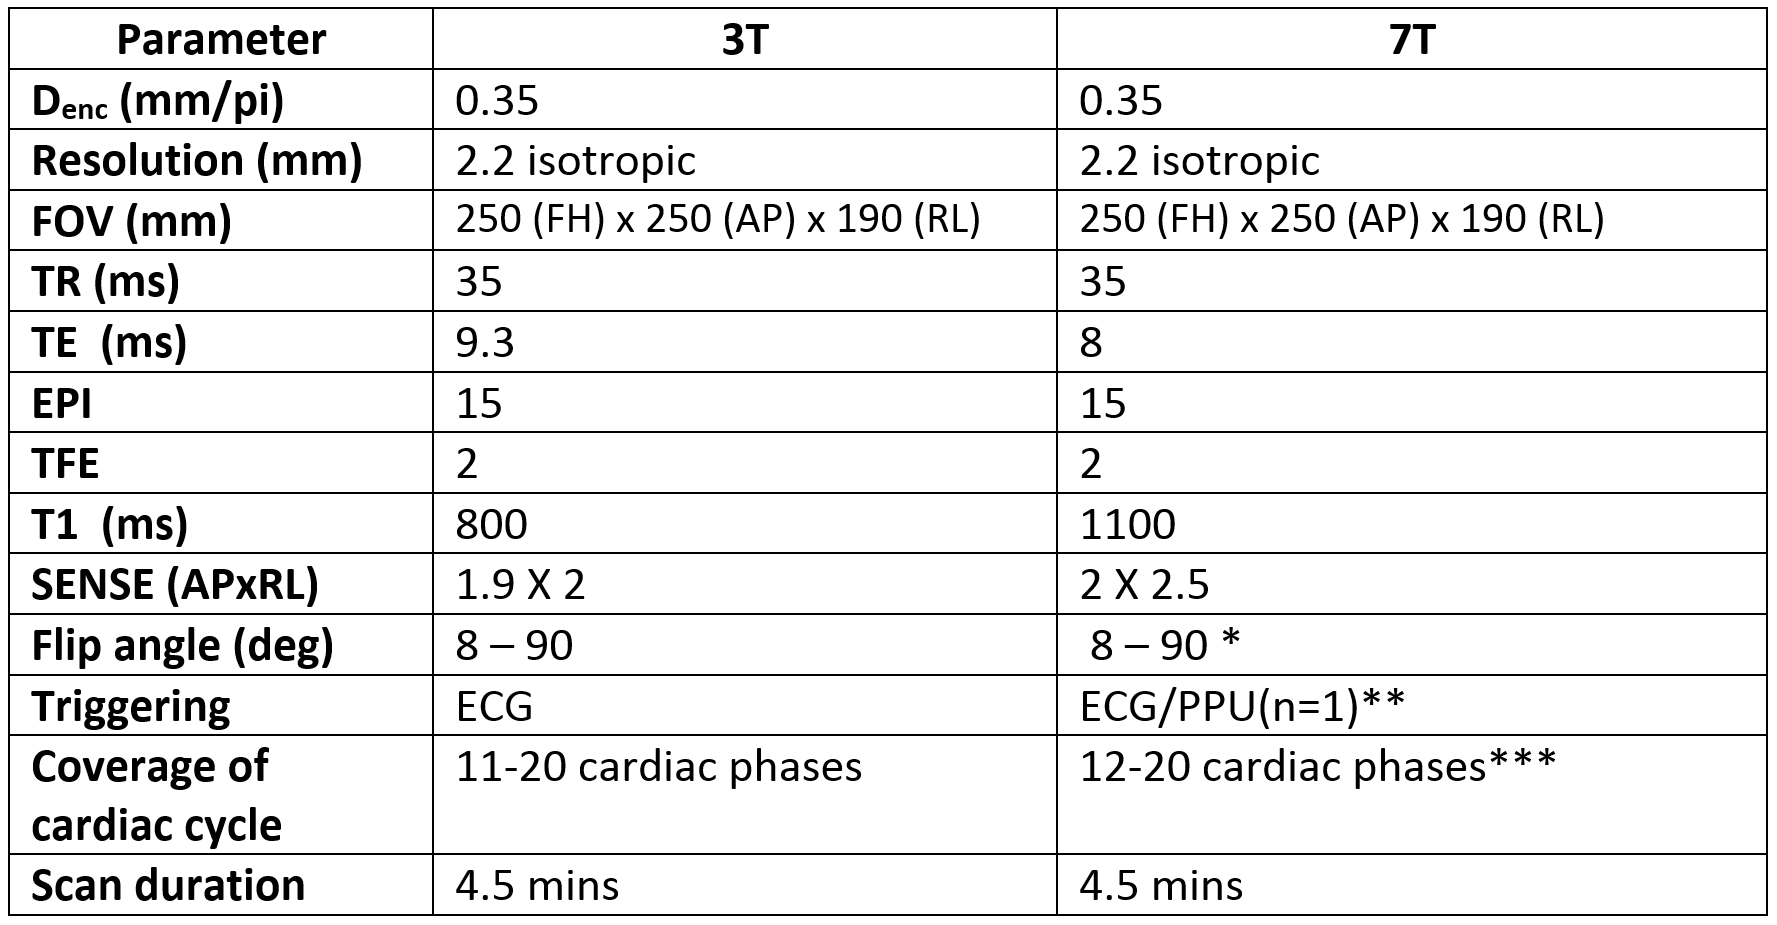
Eight healthy subjects (5 females, age 24±5 years) were scanned on both a 7T and 3T scanner (Philips Healthcare) using a 32 channel head coil (Nova Medical, 7T) and a 16 channel head coil (Philips Healthcare, 3T), within a 2 hour period per subject. Whole brain right-left displacement maps were acquired using DENSE (displacement encoding (Denc) value: 0.35mm, i.e. motion sensitivity 0.35 mm/pi). Acquisitions were performed using two dynamics with opposing encoding gradients for phase error correction. ECG triggered acquisition was done every other heart cycle to allow the signal to recover through T1 regrowth, see Table 1 for the protocol parameters. For SNR analysis, noise images were acquired by repeating the entire data acquisition without RFs and gradients present.
To achieve stable signal intensity over the heart cycle, the flip angle was varied over time as described elsewhere7. Preliminary results showed increased signal instability near the end of the cardiac cycle, so four extra cardiac phases were included in the flip angle calculation to shift this instability outside of the acquired range.
Analysis
Complex image pairs were generated from the phase images of the two dynamics with opposing gradients and the corresponding mean magnitude image. Through complex division, which yields phase subtraction, the motion-sensitive phase information was derived and thus corrected for background phase errors. All phase images were unwrapped over time. Displacement was subsequently calculated from the unwrapped phase images using $$$\Delta x = \frac{D_{enc}}{2\pi } \times \Delta \varphi$$$ .
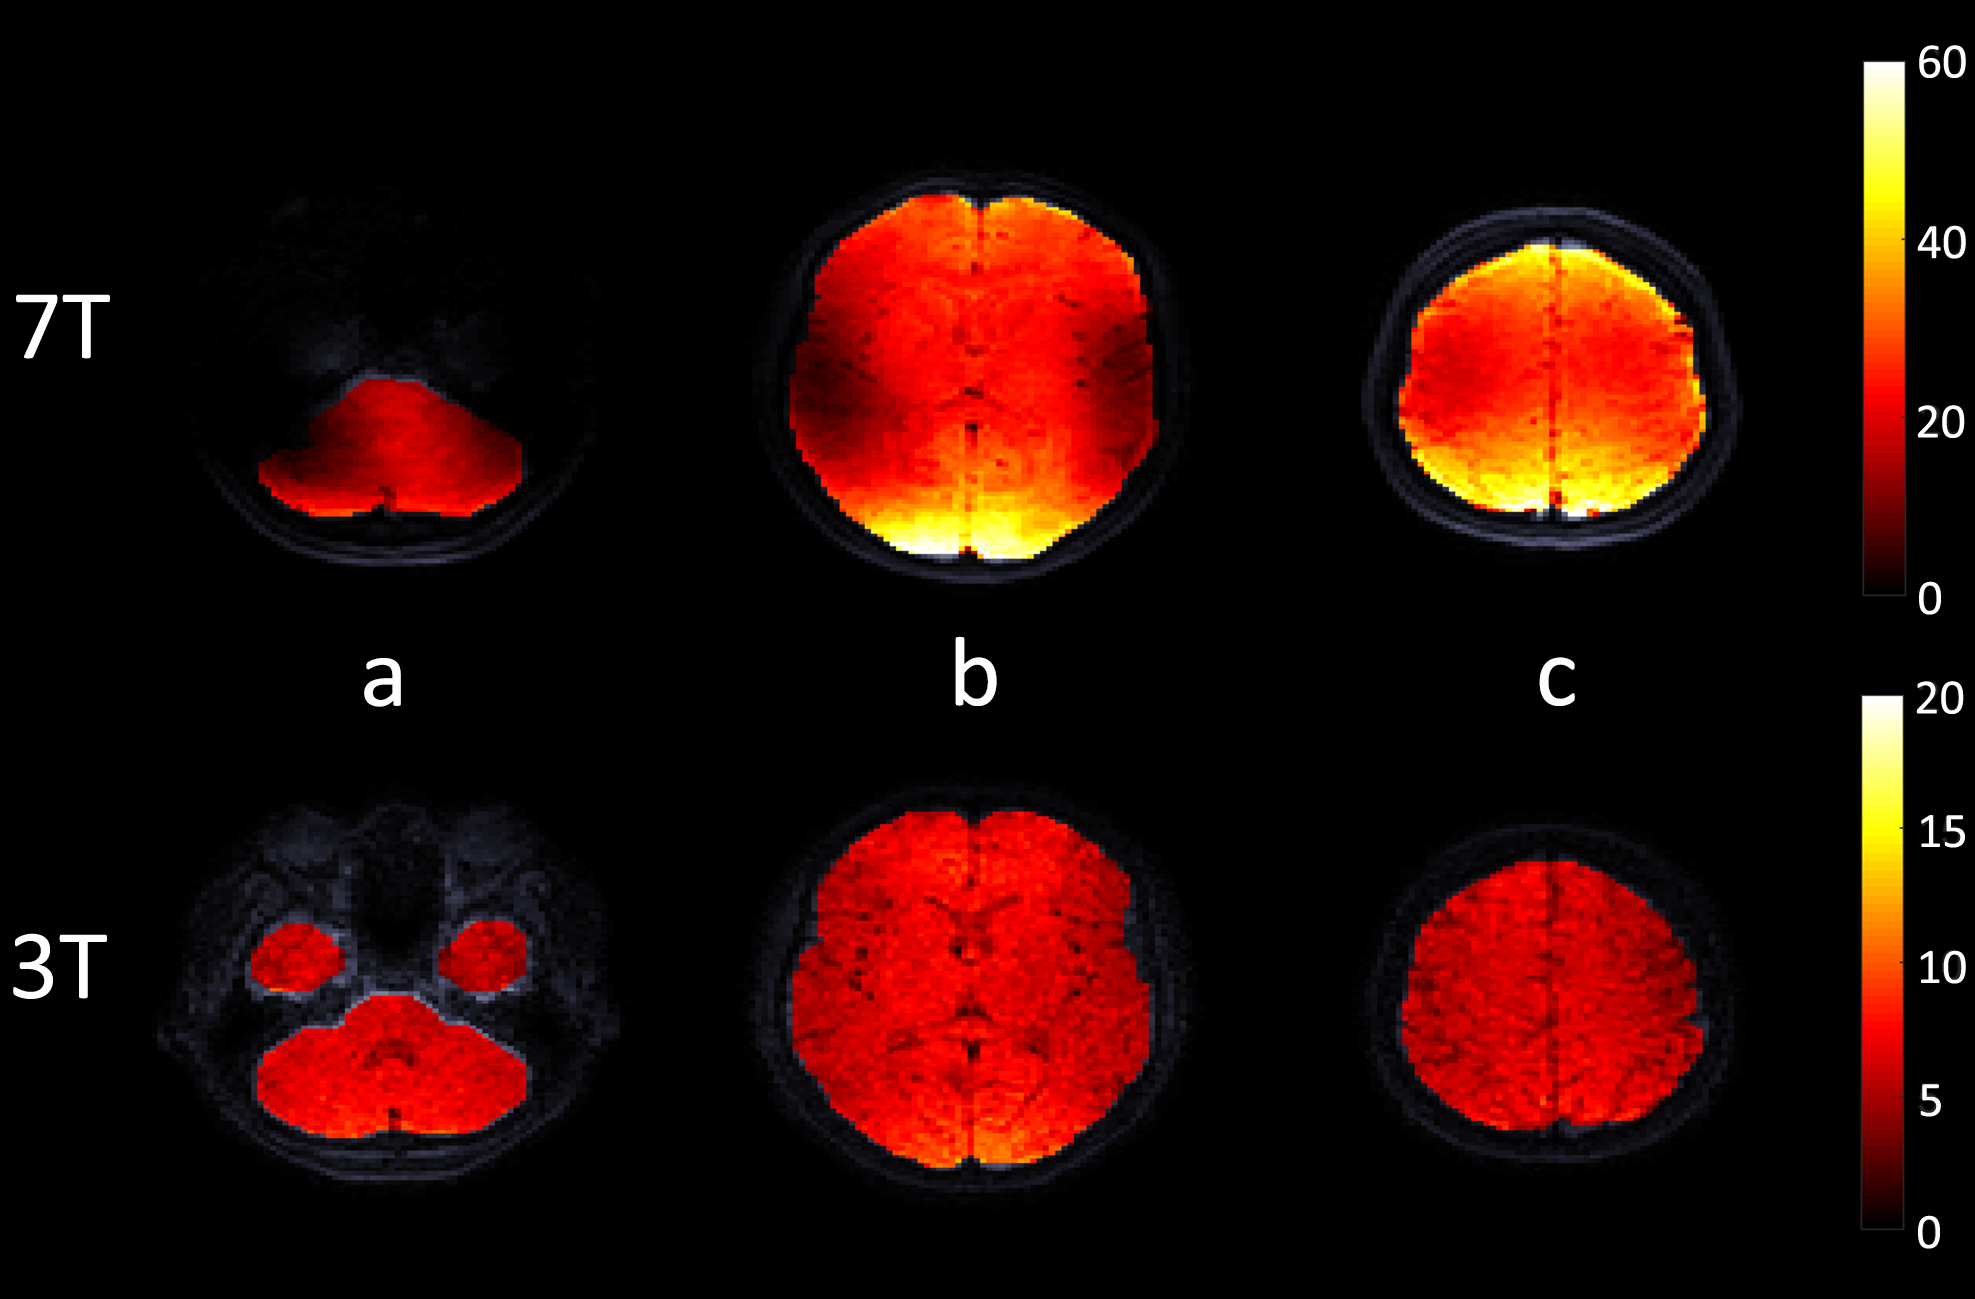
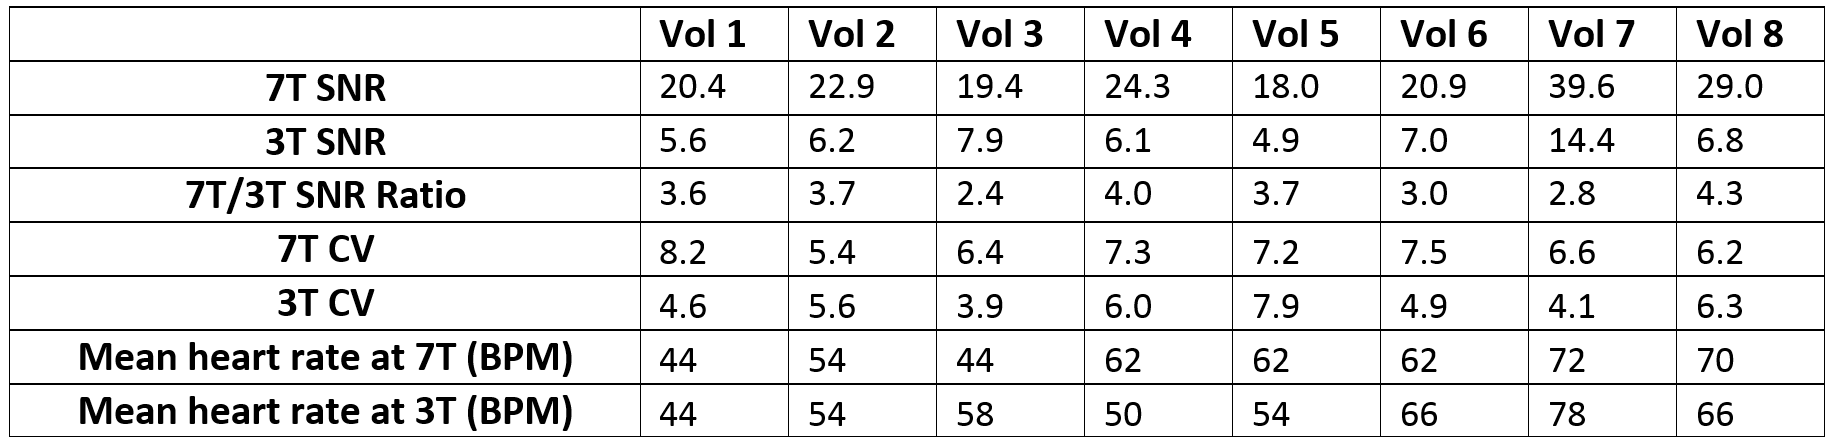
4D SNR maps were created for each volunteer by dividing the magnitude image by the standard deviation of the noise, which was obtained by applying a moving standard deviation filter (14x14x14 pixels) to the real and imaginary noise images, and then taking the root mean square of the real and imaginary standard deviation. 3D tissue masks were created based on the variance in the displacement images over time. The SNR for each measured volunteer was assessed through histogram analysis of the masked 4D SNR map. The histogram was smoothed before determining the histogram peak SNR value for each phase of the cardiac cycle. The SNR of the first heart phase was used to calculate the 7T to 3T SNR ratio. The SNR coefficient of variation (CV) over the cardiac phases was used to assess the effectiveness of the variable flip angle approach.
Results
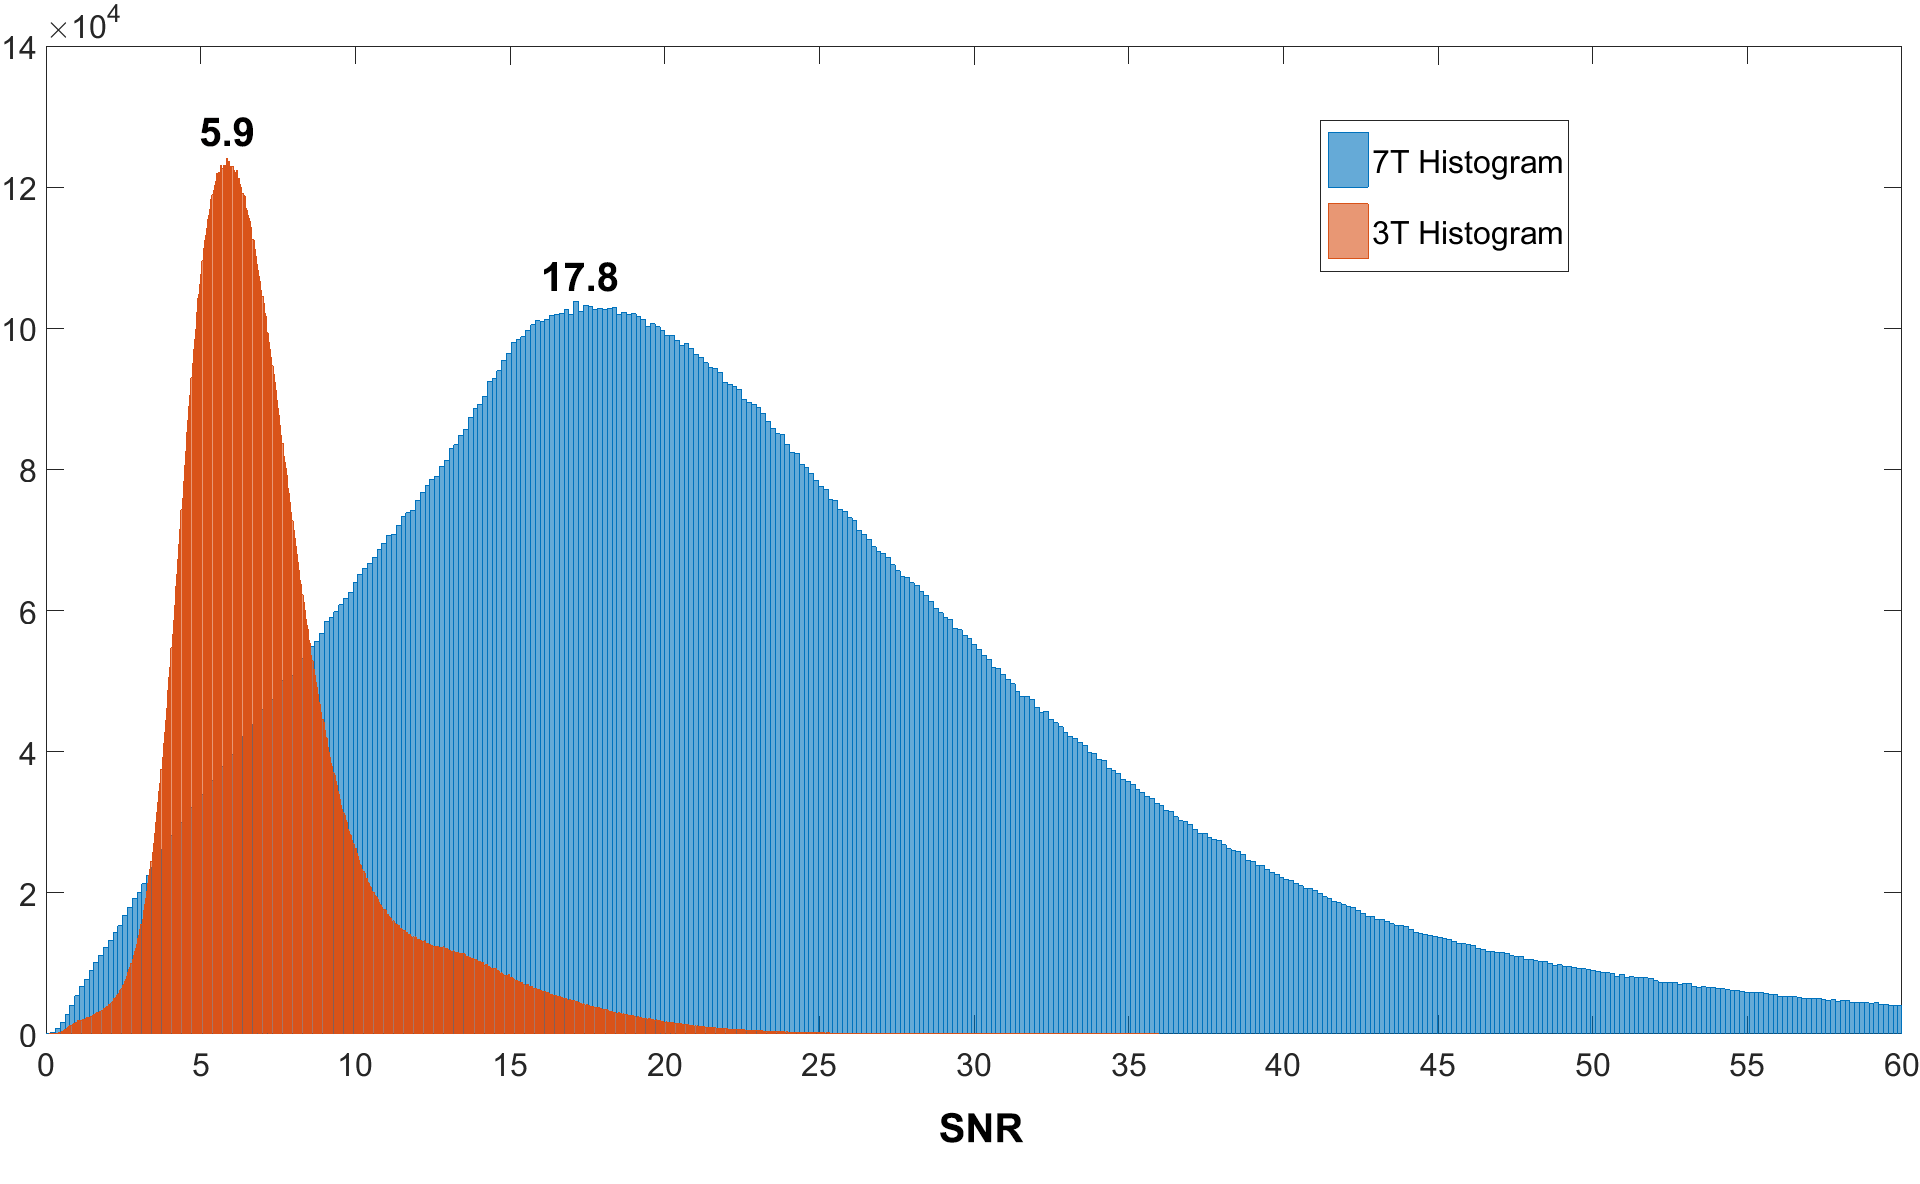
The acquisitions were successfully completed in all volunteers. Figure 1 shows example displacement images. The mean SNR histogram peak for all volunteers at 7T and 3T was 21.2 ± 6.3 (peak of combined histogram: 17.8) and 7.1 ± 2.5 (peak of combined histogram: 5.9), respectively (see figure 3). The mean 7T to 3T SNR ratio was 3.1 ± 0.6. The CV was well below 10% for all volunteers (see Table 2). The SNR at both field strengths was found to be higher at the edges of the brain closest to the receive coil (figure 2).Discussion
The SNR histogram analysis used was insensitive to the spatial variation of the SNR (resulting from B1 inhomogeneity), and therefore yielded representative SNR values to study the field strength dependence. Although the SNR appears to double in value by waiting two heart cycles between triggering at 3T (Volunteer 7, Table 2), this introduces an unacceptable acquisition duration for subjects with low heart rates, and still results in a lower SNR than the SNR at 7T with normal triggering. The low CV values for all volunteers indicates that the variable flip angle approach produces good signal stability over the cardiac cycle. The observed SNR differences may be partly affected by the differing gradient limitations and coils used on both MR systems.Conclusion
Measuring cardiac induced brain tissue motion at 7T is feasible. The higher SNR at 7T will likely yield greater accuracy in volumetric strain computations, which is potentially a good measure for pulsatility in disease1.Acknowledgements
This work was supported by the European Research Council, ERC grant agreement n°337333.References
[1] S. Hirsch, D. Klatt, F. Freimann, M. Scheel, J. Braun, and I. Sack, “In vivo measurement of volumetric strain in the human brain induced by arterial pulsation and harmonic waves,” Magn. Reson. Med., vol. 70, no. 3, pp. 671–682, 2013.
[2] J. J. Iliff, M. Wang, D. M. Zeppenfeld, A. Venkataraman, B. A. Plog, Y. Liao, R. Deane, and M. Nedergaard, “Cerebral Arterial Pulsation Drives Paravascular CSF-Interstitial Fluid Exchange in the Murine Brain,” J. Neurosci., vol. 33, no. 46, pp. 18190–18199, 2013.
[3] J. B. Weaver, A. J. Pattison, M. D. McGarry, I. M. Perreard, J. G. Swienckowski, C. J. Eskey, S. S. Lollis, and K. D. Paulsen, “Brain mechanical property measurement using MRE with intrinsic activation,” Phys. Med. Biol., vol. 57, no. 22, pp. 7275–7287, Nov. 2012.
[4] I. Sack, B. Beierbach, J. Wuerfel, D. Klatt, U. Hamhaber, S. Papazoglou, P. Martus, and J. Braun, “The impact of aging and gender on brain viscoelasticity,” Neuroimage, vol. 46, no. 3, pp. 652–657, 2009.
[5] C. May, J. a Kaye, J. R. Atack, M. B. Schapiro, R. P. Friedland, and S. I. Rapoport, “Cerebrospinal fluid production is reduced in healthy aging.,” Neurology, vol. 40, no. 3 Pt 1, pp. 500–3, 1990.
[6] M. Soellinger, A. K. Rutz, S. Kozerke, and P. Boesiger, “3D cine displacement-encoded MRI of pulsatile brain motion,” Magn. Reson. Med., vol. 61, no. 1, pp. 153–162, 2009.
[7] S. E. Fischer, G. C. McKinnon, S. E. Maier, and P. Boesiger, “Improved myocardial tagging contrast.,” Magn. Reson. Med., vol. 30, no. 2, pp. 191–200, 1993.
Figures