5211
Gradient Moment Dependent T2 Accuracy in FISP Magnetic Resonance Fingerprinting (MRF) at 7T1Biomedical Engineering, Case Western Reserve University, Cleveland, OH, United States, 2Radiology, University Hospitals Cleveland Medical Center, Cleveland, OH, United States, 3Physiology and Biophysics, Case Western Reserve University, Cleveland, OH, United States, 4Pediatrics, University Hospitals Cleveland Medical Center, Cleveland, OH, United States
Synopsis
Magnetic Resonance Fingerprinting allows for rapid, simultaneous multi-parametric quantification. The use of a FISP imaging kernel is necessary due to field inhomogeneity in human body and preclinical imaging. We have observed that increases in the applied gradient moment lead to gradient moment size dependent changes in T2 accuracy. By examining different applied gradient moments we illustrate this loss of T2 accuracy while T1 measurement accuracy is maintained. This has implications for FISP MRF design and the implementation of unbalanced gradient moments for quantification.
Purpose
Magnetic Resonance Fingerprinting has demonstrated a powerful ability to perform simultaneous multi-parametric quantification in vivo on high field, preclinical MRI scanners (≥7T)1,2. Similar to human applications in the body3,4, use of MRF at high field strengths requires a FISP imaging kernel with an unbalanced gradient moment to eliminate banding artifacts seen in TrueFISP. We have observed that the magnitude of the dephasing gradients in the FISP MRF technique has the potential to introduce quantification errors, particularly to T2 estimation. Understanding the importance of the applied gradient moment in quantification accuracy is a key feature in developing accurate preclinical MRF methodologies and robust methods. In this work, we investigate the impact of altered dephasing gradient moment magnitude on the accuracy of MRF-based T1 and T2 measurements on a 7T high field preclinical MRI system.Methods
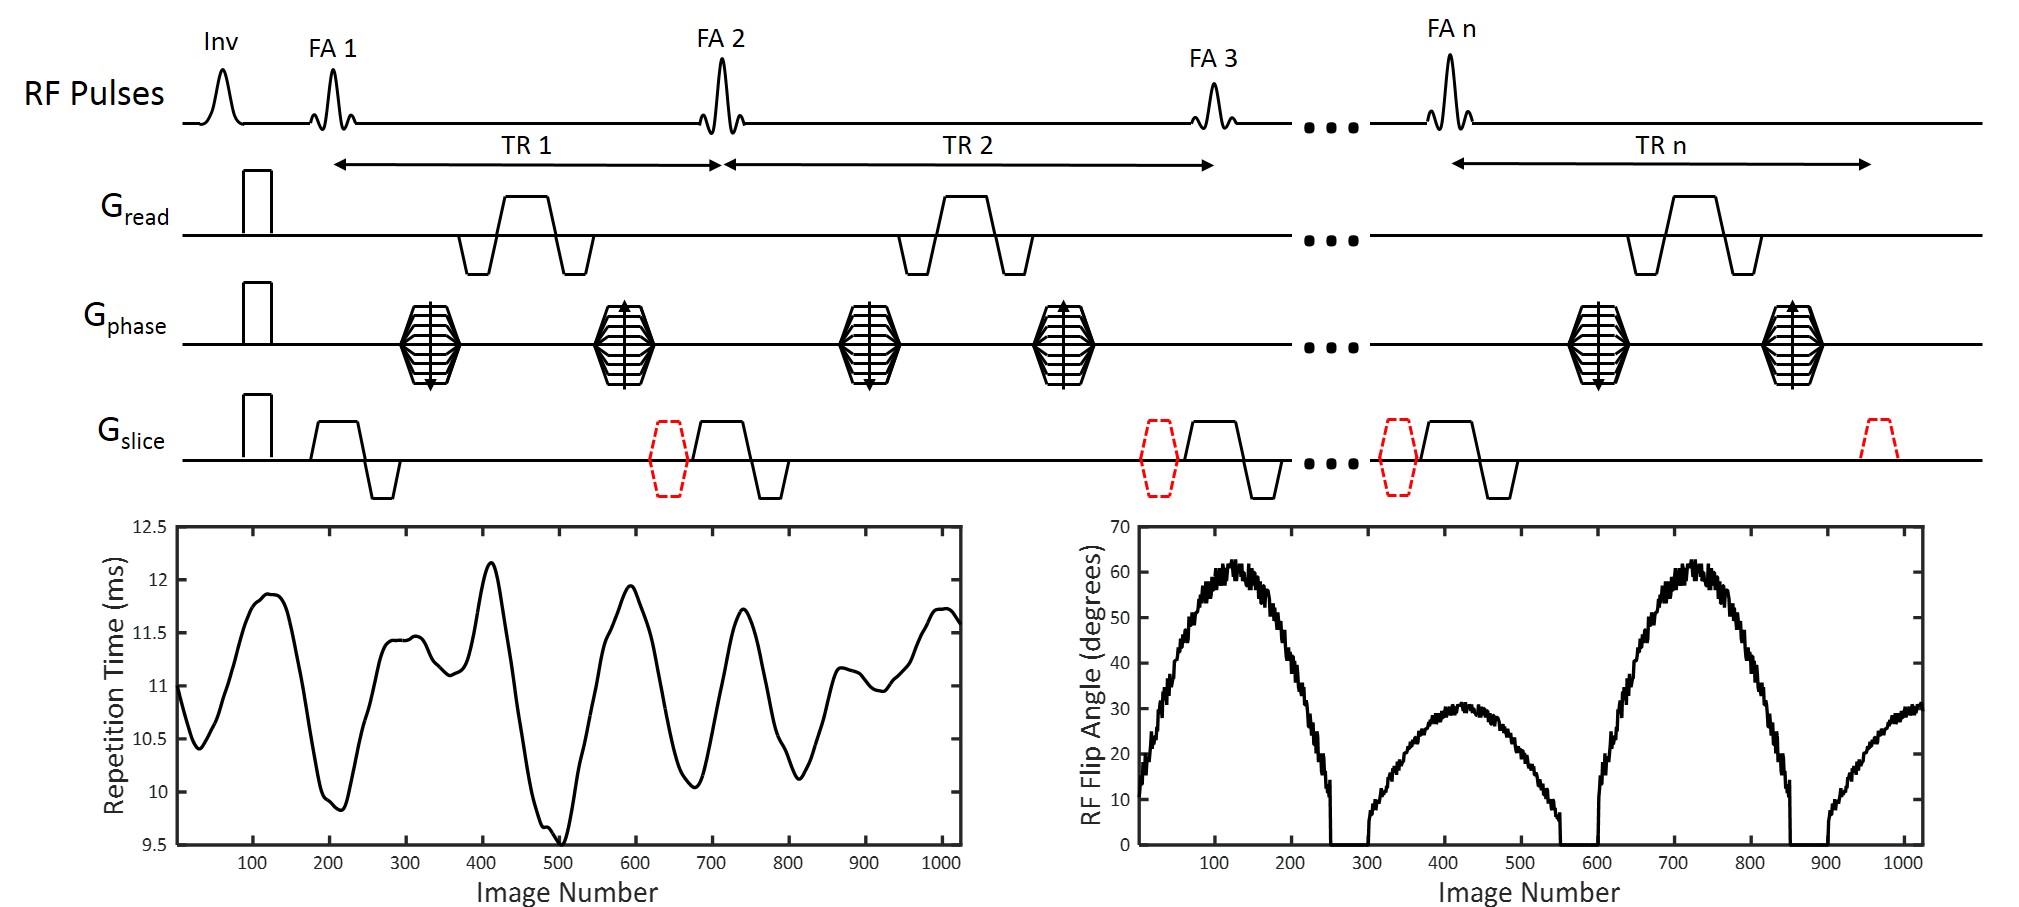
Data for this work was acquired on a Bruker 7T preclinical system with temperature controlled at 27 ºC ±1.5 ºC for in vitro data. A FISP imaging kernel served as the basis for the MRF acquisitions with repetition time (9.5-12 ms) and flip angle (0-70 degrees) patterns similar to previous implementations1,5,6. The FISP imaging kernel was adapted by changing the unbalanced gradient moment for each experiment (red gradient lobe in Figure 1). To test different imaging conditions, 6 gradient moments were applied in separate in vitro MRF experiments: 0 mT·ms/m (TrueFISP), 31 mT·ms/m, 62 mT·ms/m, 93 mT·ms/m, 124 mT·ms/m, and 248 mT·ms/m. MRF-based T1 and T2 relaxation time maps were obtained by matching acquired data on a pixel by pixel basis to a simulated dictionary of possible profiles using template matching to identify the best match. The same MRF dictionary, assuming a constant multiple of 2π dephasing within a voxel per TR, was used for each FISP MRF experiments. A separate TrueFISP MRF dictionary was simulated for the 0 mT·ms/m gradient moment as this experiment exhibits different spin dynamics, does not have a constant dephasing moment per TR, and is sensitive to off resonance. The resulting in vitro T1 and T2 maps were compared across all of the gradient moments. In vivo mouse kidney experiments were also performed (TrueFISP MRF vs 2 x FISP MRF acquisitions) to evaluate the impact of the FISP MRF gradient dephasing moment.Results
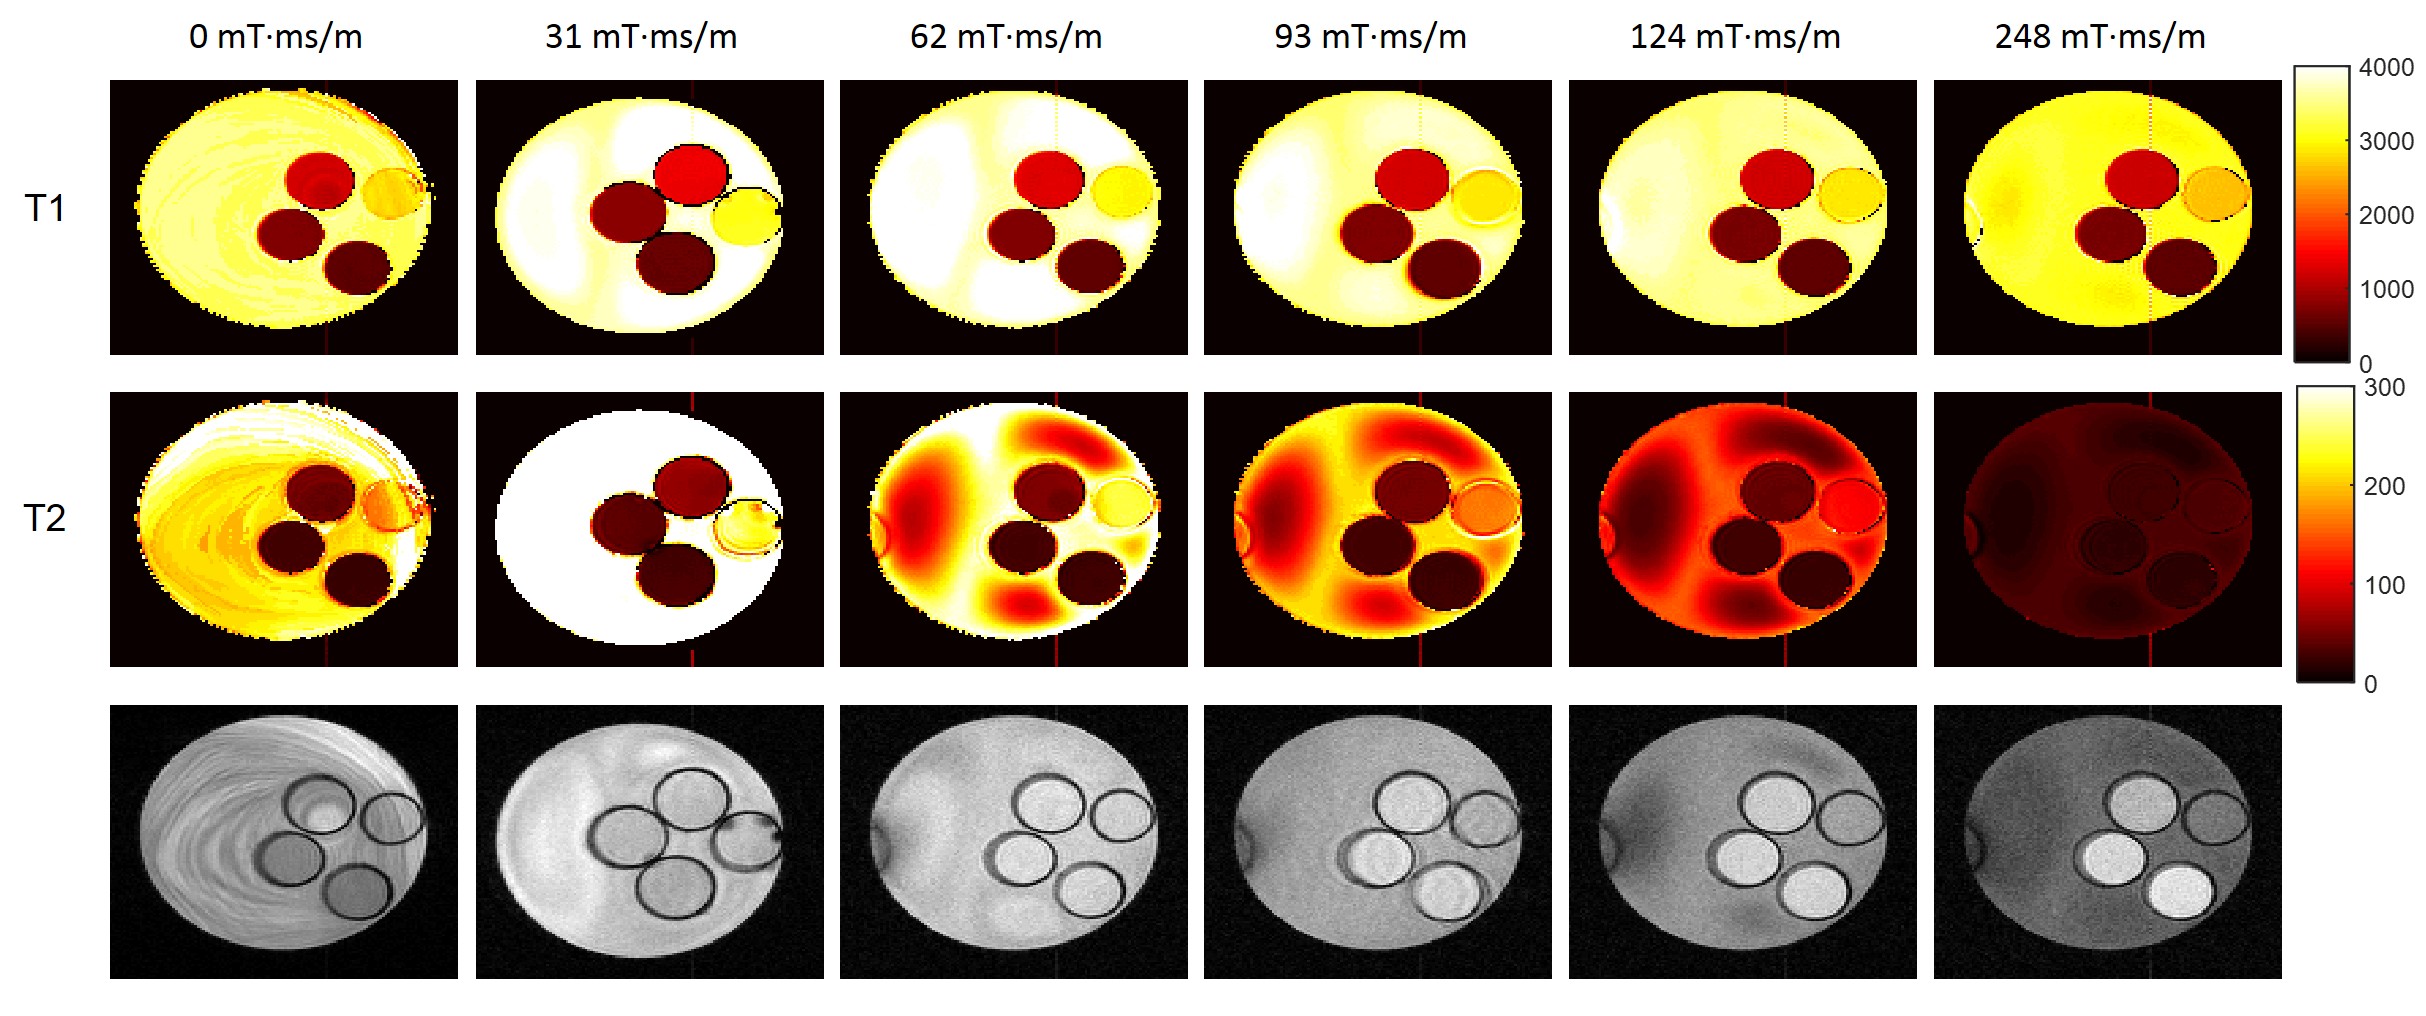
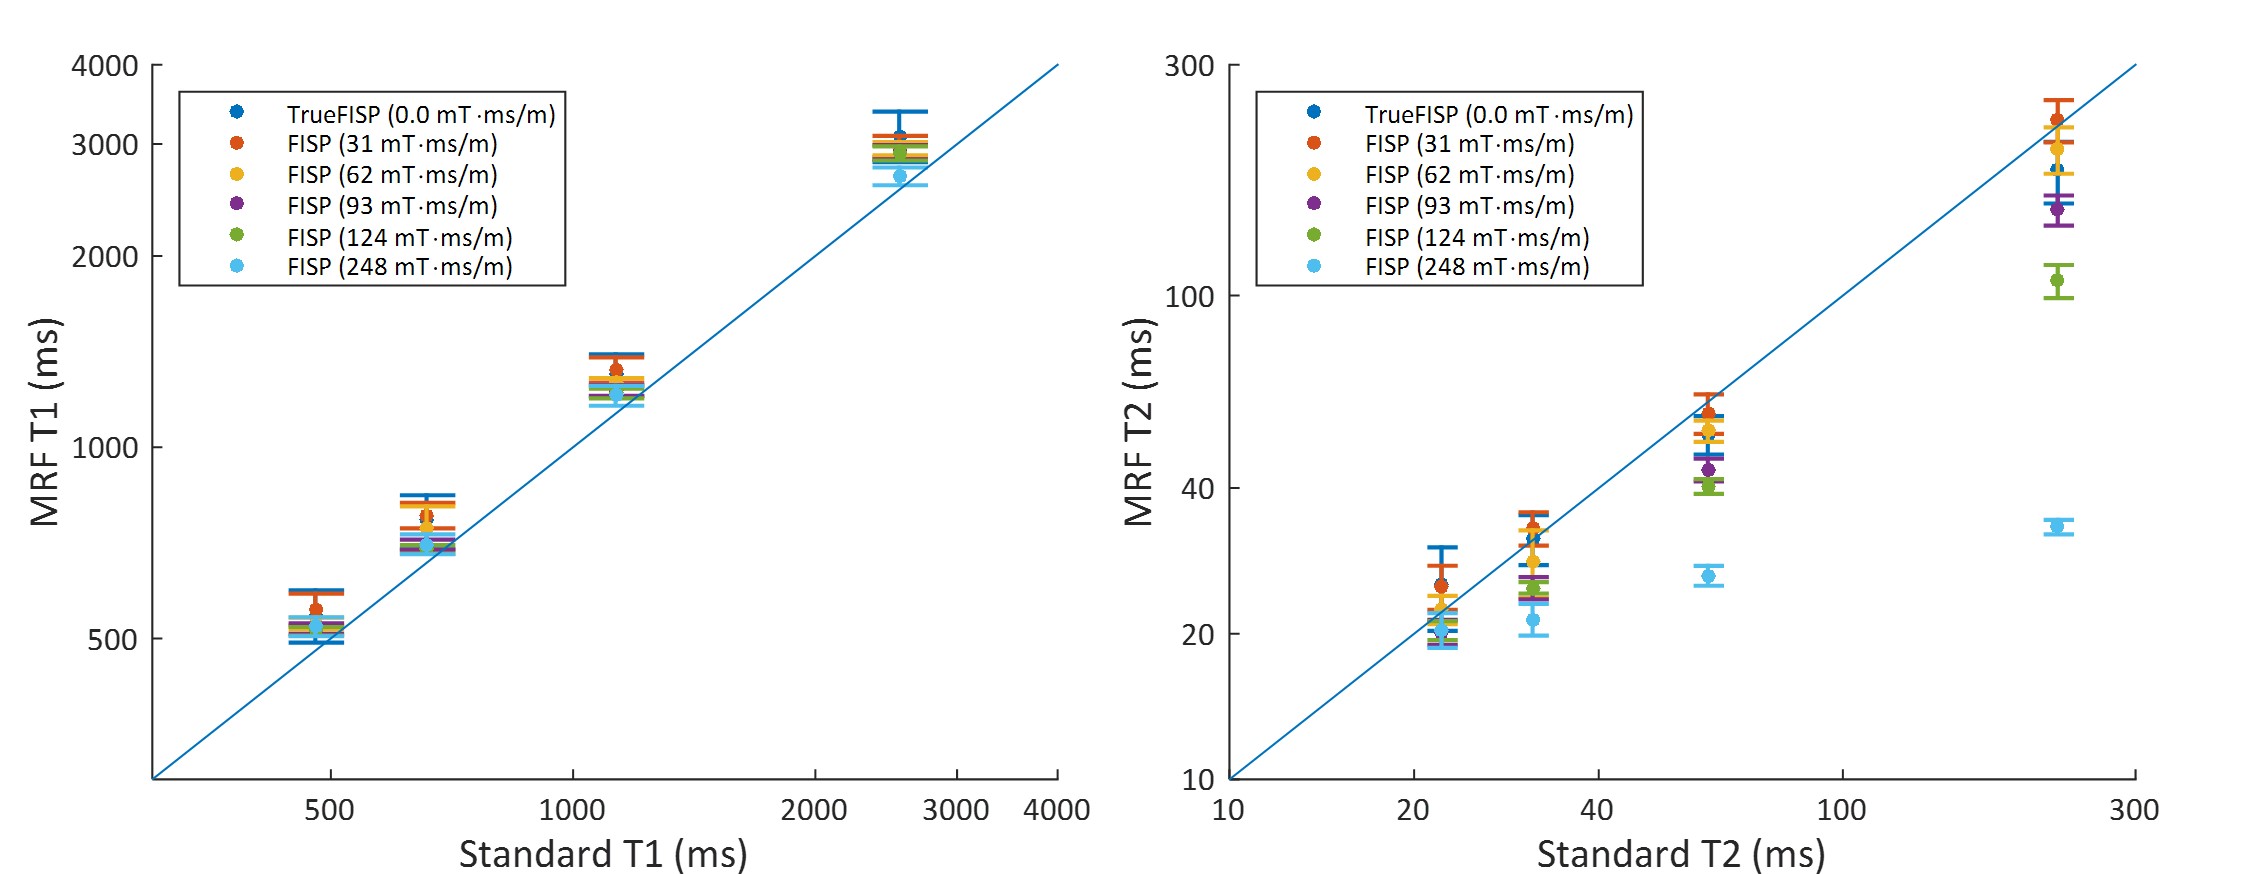
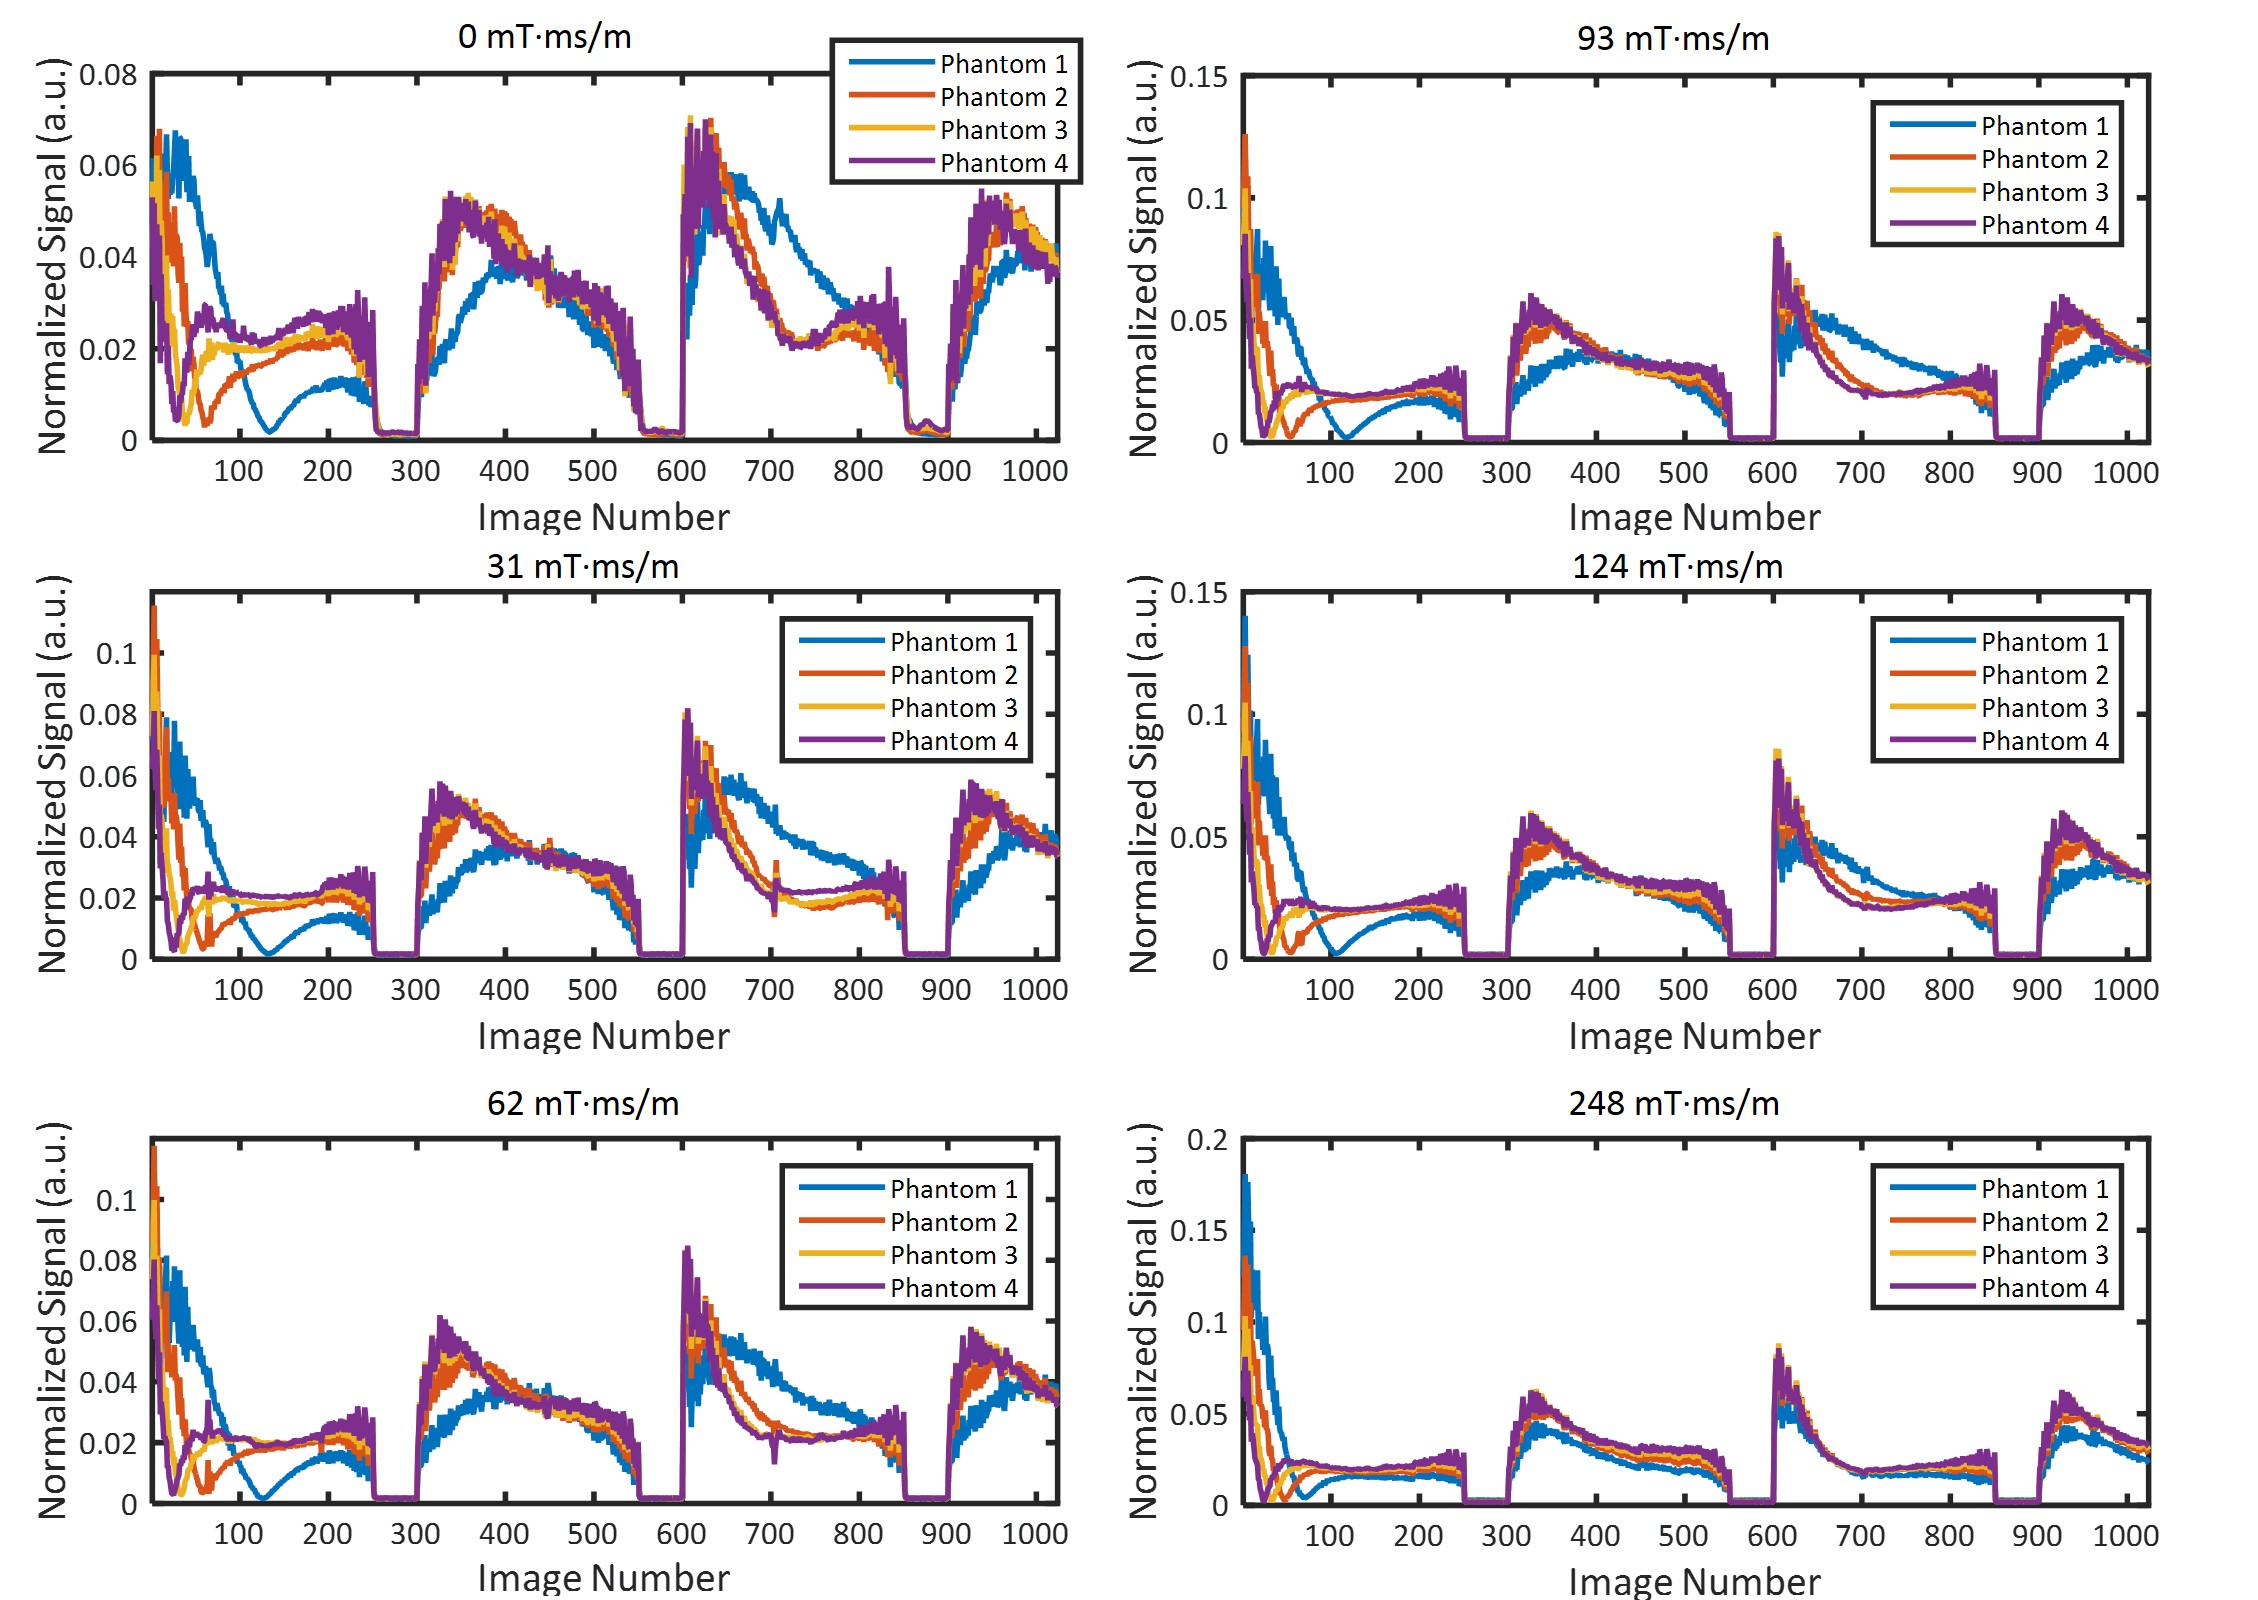
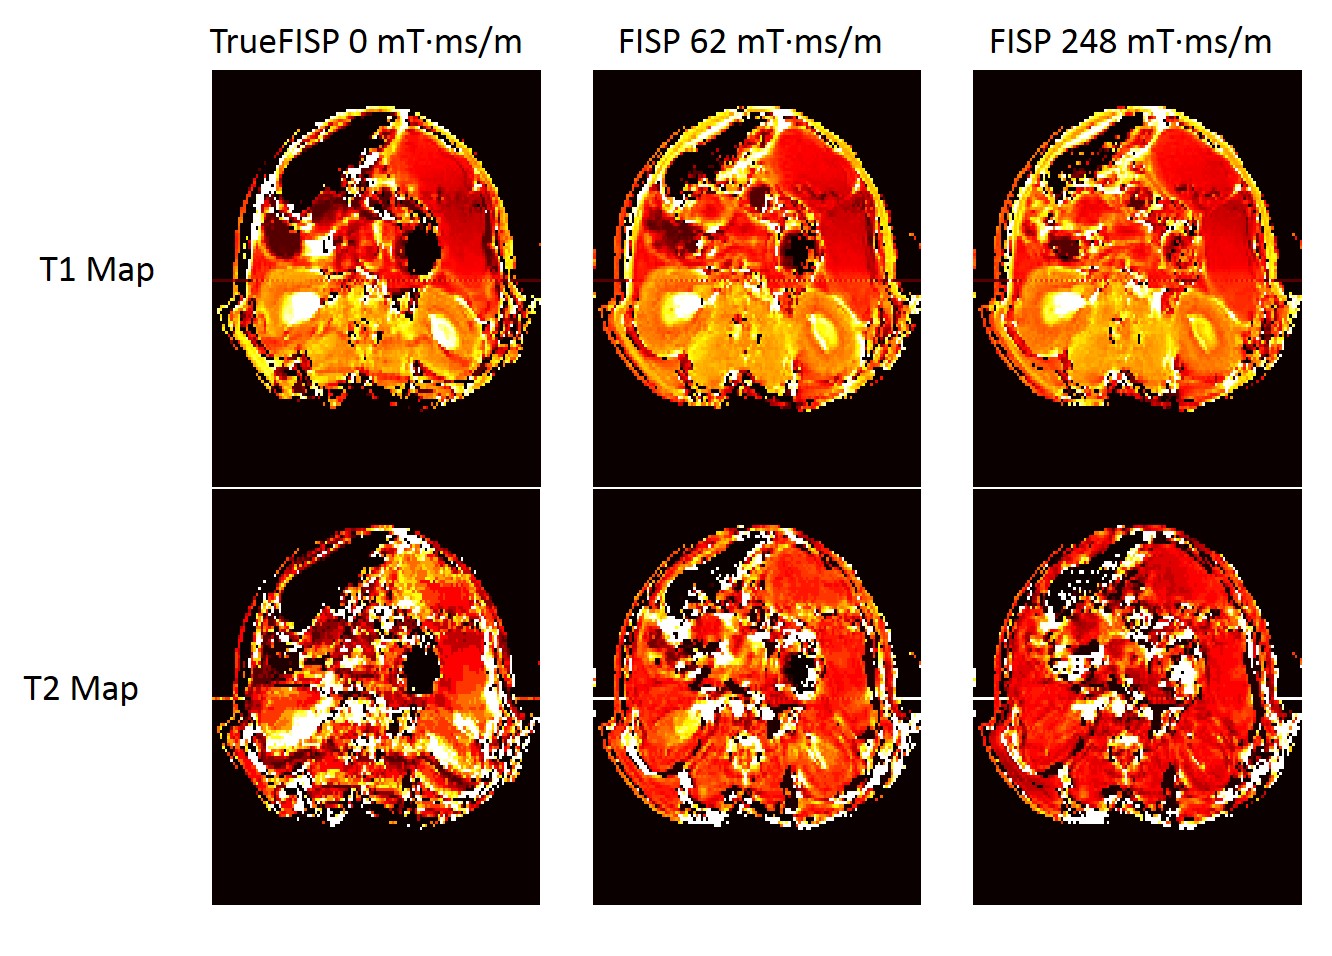
In vitro MRF-based T1 and T2 maps for 4 MnCl-doped saline phantoms are shown in Figure 2. Mean values for each phantom from each MRF acquisition were plotted against gold-standard spin echo results in Figure 3. Representative profiles from each phantom for each gradient moment are plotted in Figure 4. MRF-based mean T1 values showed good agreement with gold-standard spin echo results across all gradient moments. Mean T2 values measured with MRF exhibited gradient moment size dependent deviations from corresponding spin echo results. This same effect was observed qualitatively in the in vivo kidney MRI results (Figure 5). The FISP MRF results with the higher gradient dephasing moment (248 mT·ms/m) exhibited a narrowed dynamic range in T2 measurements in comparison to the lower gradient moment (62 mT·ms/m) as evidence by a loss of T2 contrast between the renal cortex and medulla. TrueFISP in vivo maps suffered from banding artifacts that were eliminated in the FISP MRF maps.Discussion
In this study, we have demonstrated the gradient moment dependence of the T2 relaxation time maps for the FISP MRF technique on high field preclinical MRI scanners. These initial in vitro and in vivo MRI results show that FISP MRF-based T2 relaxation time estimates are significantly reduced in comparison to gold-standard spin echo MRI assessments for larger gradient dephasing moments. Therefore, the amount of dephasing moment applied for a FISP MRF acquisition should be implemented carefully to ensure the accuracy for both in vitro and in vivo studies. These results suggest that there is a progressive reduction in the MRF signal coherence as the dephasing gradient moment is increased resulting in significant under-estimation of the T2 values.Conclusion
We have identified a potential error source in T2 relaxation time estimates for FISP MRF implementations on high field preclinical MRI scanners. The sensitivity of these T2 estimates to the magnitude of the dephasing gradient moment demonstrates the need to carefully design FISP based MRF acquisitions. This study can help advise future MRF experiments in order to maintain T2 accuracy with a properly designed MRF imaging kernels.Acknowledgements
NIH T32EB007509, NIH TL1TR000441, NHLBI R21 HL130839, Cystic Fibrosis FoundationReferences
1. Gao Y, Chen Y, Ma D, et al. Preclinical MR fingerprinting (MRF) at 7T: effective quantitative imaging for rodent disease models. NMR Biomed. 2015; 28: 384-394.
2. Buonincontri G, Sawiak S J. MR Fingerprinting with simultaneous B1 estimation. Mag Res Med. 2015. 76(4): 1127-1135.
3. Chen Y, Jiang Y, Pahwa S, et al. MR Fingerprinting for rapid quantitative abdominal imaging. Radiology. 2016. 279(1): 278-286.
4. Hamilton J, Jiang Y, Chen Y, et al. MR Fingerprinting for rapid quantification of myocardial T1, T2, and proton spin density. Mag Res Med. 2016 Early View.
5. Jiang Y, Ma D, Seiberlich N, et al. MR Fingerprinting using fast imaging with steady state precession (FISP) with spiral readout. Mag Res Med. 2015. 74(6): 1621-1631.
6. Ma D, Gulani V, Seiberlich N, et al. Magnetic resonance fingerprinting. 2013. Nature. 495: 187-192.
Figures