5209
An in vivo analysis of cerebral cortex organization using a new partial volume method applied to 7T MP2RAGEGuillaume Bonnier1, Kieran O'Brien2,3, Pascal Sati4, Mario Joao Fartaria5, Jon R Polimeni1, Alexis Roche5,6, Daniel S Reich4, Gunnar Krueger7, and Cristina Granziera1,8
1MGH/MIT/HMS Athinoula A. Martinos Center for Biomedical Imaging, Massachusetts General Hospital, Harvard Medical School, Charlestown, MA, United States, 2Center for Advanced Imaging, University of Queensland, Brisbane, Australia, 3Siemens Healthcare Pty Ltd, Brisbane, Australia, 4Translational Neuroradiology Unit, National Institute of Neurological Disorders and Stroke, National Institutes of Health, Bethesda, MD, United States, 5Advanced Clinical Imaging Technology, Siemens Healthcare AG, Lausanne, Switzerland, 6Department of Radiology, University Hospital (CHUV), Lausanne, Switzerland, 7Siemens Medical Solutions USA, Inc., Malvern, MA, United States, 8Neuroimmunology Unit, Neurology, Department of Clinical Neurosciences, Centre Hospitalier Universitaire Vaudois (CHUV) and University of Lausanne (UNIL), Lausanne, Switzerland
Synopsis
We performed an analysis of the cortex organization of 10 healthy subjects using partial volume information. Tissue concentration were estimated using a novel algorithm applied to 7T MP2RAGE high resolution images (0.75mm), and ultra high resolution (0.35mm). We identified 3 distinct layers characterized by presence of WM-like signal (inner layer), only GM (central layer) and GM/CSF partial volume (outer layer).
Introduction
MR imaging of the cortical structure in vivo is challenging, due to its complex microstructure and its heterogeneity across the brain1. Hardware and software advances in MRI have enabled unprecedented spatial resolution in vivo, thereby providing a valuable window into cortical grey matter microstructure2,3. Magnetization-prepared two inversion-contrast rapid gradient echoes sequence (MP2RAGE) provides both a uniform T1w contrast and a T1 map corrected for the proton density, T2* contrast, and B1 inhomogeneities4 at ultra-high field5,6. In this study, we propose a novel approach to analyze the organization of the cerebral cortex using a partial volume estimation applied to MP2RAGE uniform maps acquired at 7T.Method
We acquired MP2RAGE images on a whole body 7T MRI research scanner (Siemens Healthcare, Erlangen, Germany) in 10 healthy subjects (8 women/2 men; age=33.9±9.5years) at high spatial resolution (0.75x0.75x0.9mm3). One subject underwent an additional 7T MP2RAGE at ultra-high spatial resolution acquisition (0.35mm3 isotropic). We used FreeSurfer to perform cortical segmentation on MP2RAGE uniform images in each subject7 and then – to each cortical region – we applied a novel algorithm to estimate tissue concentration in each voxel. The algorithm operates using a model that describes the intensity of each voxel as the sum of GM, WM and CSF characteristic intensities, weighted by their respective local concentrations8. We initialized tissues characteristic intensities based on average tissue intensities. Our analysis focused on 3 brain regions known to exhibit high histological diversity in its constituents (peri-calcarine, pre-central and post-central).Results
The algorithm identified 3 “tissue combinations” that exhibited a similar spatial distribution over all cortical areas: (i) an outer layer constituted by GM/CSF-like partial volume intensities, (ii) a central layer constituted by GM only, (iii) and an inner layer with voxels that show a mix of GM and WM-like intensities (Figure 1). Different spatial extents of those 3 layers were observed when the peri-calcarine region was compared to the pre-/post-central regions (Figures 1, 2). In fact, the proportion of voxels belonging to the outer layer slightly changed across the 3 regions (25% in the peri-calcarine; 25% in the pre-/post-central areas; 15% in the whole brain, Figure 1). In addition, the inner layer, which is just 2-3 voxels thick in the peri-calcarne area, doubled in size in a specific area of the pre-central region (Figure 2.B). The central layer (voxels with GM concentration>80%) appeared as a thin line of 1-2 voxels in part of the pre-central and peri-calcarine regions (Figure 2.A,B), or as a larger band of 3-4 voxels in other areas of the pre-central and peri-calcarine regions (Figure 2.A,B,C). The analysis of ultra-high resolution MP2RAGEs showed the 3 layers with the same patterns observed at 0.75mm, but also revealed a very particular pattern in the peri-calcarine, with a high concentration of WM-like signal inside the central layer (Figure 2.C).Discussion and conclusion
We have applied a new partial volume estimation algorithm to sub-millimeter MP2RAGE images, which identified 3 layers (outer, central, inner) in a cohort of healthy subjects. The properties of the outer layer (i.e. T1 signal that is higher than GM and lower than CSF) are compatible with the loose structure (i.e. sparseness of neuronal component) of the layers 1 to 3 in the brain cortex (supragranular layers9). The middle layer is constituted by T1 signal that are typical of a compact GM structure, such as the one characterizing layers 4 to 5 in the cerebral cortex. Interestingly, at 0.35 mm3 resolution, we have also identified a band resembling to the inner layer (mix of GM and WM-like intensities) that is located where the Stria of Gennar has been histologically described10. Future work will focus on exploiting the current approach to study the impact of neuro-inflammatory and neurodegenerative pathologies on the 3 layers microstructure.Acknowledgements
No acknowledgement found.References
1. Nieuwenhuys 2013; 2. Renvall V., et al. Automatic cortical surface reconstruction of high-resolution T1 echo planar imaging data. NeuroImage 2016; 3. Strotmann B et al. Mapping of the internal structure of human habenula with ex vivo MRI at 7T. Front Hum Neurosci. 2013; 4. Marques JP1 et al. MP2RAGE, a self bias-field corrected sequence for improved segmentation and T1-mapping at high field. NeuroImage 2010; 5. O'Brien KR et al. Robust T1-weighted structural brain imaging and morphometry at 7T using MP2RAGE. PlosOne 2014; 6. Fartaria M. et al. An Ultra-High Field Study of Cerebellar Pathology in Early Relapsing-Remitting Multiple Sclerosis Using MP2RAGE. Investigative Radiology.; 7. Fischl et al., Automatically Parcellating the Human Cerebral Cortex. Cerebral Cortex 2004. 8. Roche et al. Partial Volume Estimation in Brain MRI Revisited. Med Image Comput Comput Assist Interv. 2014.; 9. Matthew E Larkum The yin and yang of cortical layer 1. Nature Neuroscience 2013; 10. Glickstein M., Rizzolatti G. Francesco Gennari and the structure of the cerebral cortex Trends in Neurosciences, Volume 7, Issue 12, 464-467, 1 December 1984Figures
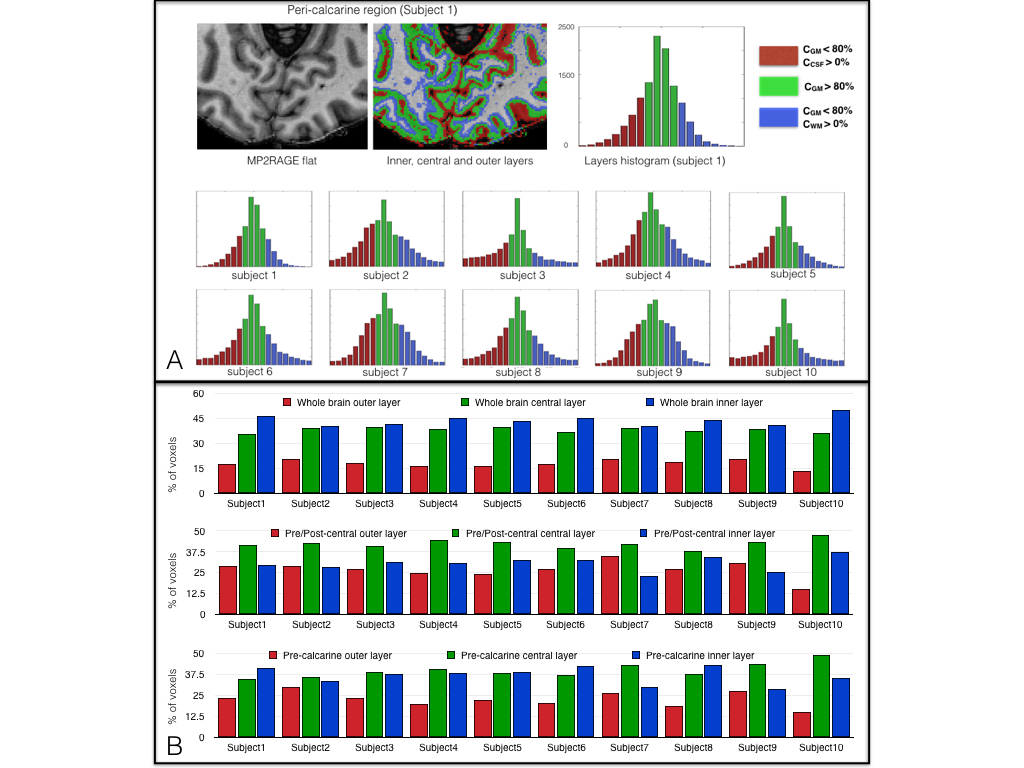
(A) Histogram of the 3 subdivisions in the peri-calcarine for the 10 healthy subjects at high resolution (0.75 mm isotropic). We observe a similar distribution in all subjects for the 3 cortical layers defined according to the amount of partial volume between GM and CSF (outer layer), WM and GM (inner layer) and GM concentration (central layer). (B) Proportion of each subdivision over the region of interest in the whole brain (top), pre/post-central (middle), peri-calcarine (bottom).
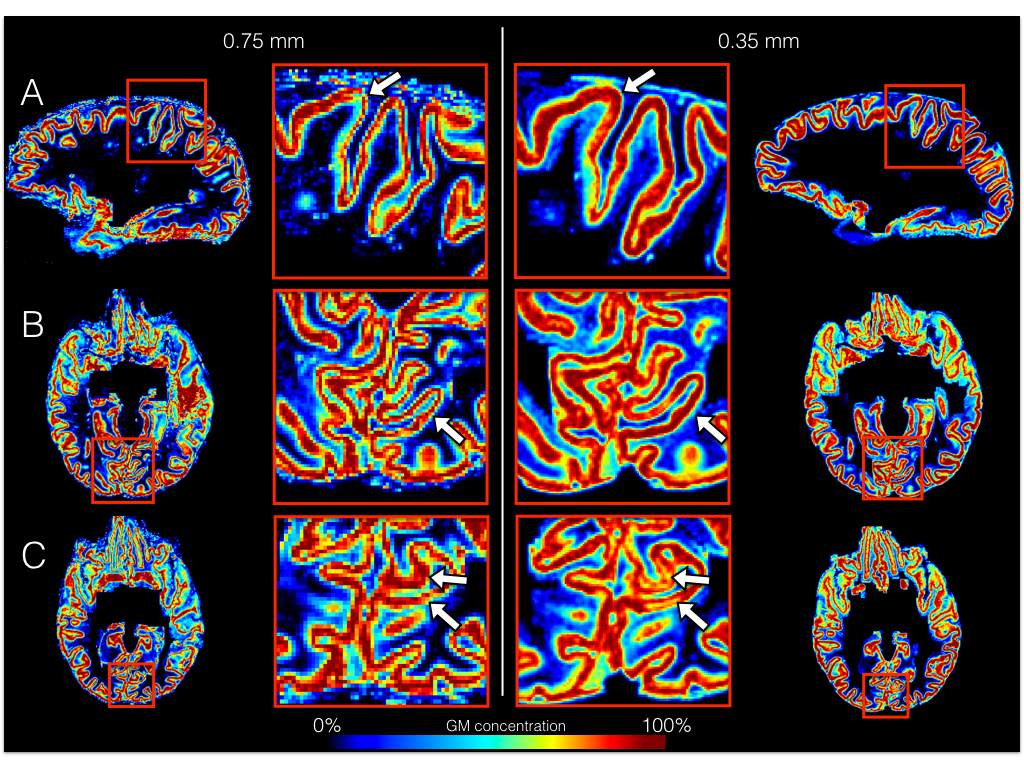
GM concentration map estimated from MP2RAGE image at high resolution (left), and ultra high resolution (right). Blue corresponds to low GM concentration, while red corresponds to high GM concentration. (A) Focus on pre/post-central regions where we observe the CSF/GM partial volume characterizing the outer part of the cortex (arrows). The WM/GM partial volume characterizing the inner part appears larger in some areas. (B) Focus on the peri-calcarine region where the inner part is thin with a larger central part (arrows). (C) The peri-calcarine region also revealed a particular pattern with presence of WM-like signal inside the cortex (arrows).