5207
T1 Mapping of NIST Phantom at 7T1Athinoula A. Martinos Center for Biomedical Imaging, Massachusetts General Hospital, Charlestown, MA, United States, 2Physical Measurement Laboratory, National Institute of Standards and Technology (NIST), Boulder, CO, United States, 3Harvard-MIT Division of Health Sciences and Technology, Massachusetts Institute of Technology, Cambridge, MA, United States, 4Department of Radiology, Harvard Medical School, Boston, MA, United States
Synopsis
We are reporting quantitative T1 values of the NIST T1 phantom at 7T for the first time by using IR-SE method. We also compared the accuracy of T1 mapping by using MP2RAGE and variable flip angle (VFA) methods against the IR-SE T1s at 7T and found MP2RAGE gave more accurate T1 measure than VFA, for T1 of 300 ms to 2000ms (the range of brain T1). Although the accuracy of MP2RAGE at 7T was not as good as that at 3T (also shown), MP2RAGE is a promising technique for accurate brain T1 mapping at 7T within a clinically acceptable scan time.
PURPOSE
Quantitative T1 maps are important in several applications, such as deriving quantitative CBF from ASL data and Ktrans from DCE data, as well as cortical parcellating for precise morphometry. The current gold standard for T1 mapping is inversion recovery with spin-echo (IR-SE) acquisition. IR-SE is less sensitive to B0 and B1 inhomogeneity but the total acquisition is long and hence, impractical for clinical applications. There are many rapid techniques developed for efficient T1 mapping purposes. The most popular one is variable flip angles (VFA) technique, which employs a 3D GRE sequence repeatedly with different flip angles (FAs). Total scan time is clinically acceptable. However, the VFA technique is very sensitive to B1 inhomogeneity and B1+ inhomogeneity becomes worse at high fields (7T) because the wavelength approaches the size of the adult human head. IR-based T1 mapping techniques utilizing a non-selective adiabatic inversion pulse, such as MP2RAGE [1], are less sensitive to B1. MP2RAGE has shown promise in producing high-resolution, quantitative T1 maps within reasonable scan time at 3T. In this study, we first measured T1 of the NIST T1 phantom at 7T by using the IR-SE method. We then assessed the accuracy of MP2RAGE and VFA T1 mapping at 7T against the IR-SE T1 measurements.METHODS
NIST T1 phantom consists of 14 19-mm spheres, filled with NiCl2 solution of various concentrations and spaced 4 mm apart. The phantom was immersed in fomblin (perfluorinated polyether) for susceptibility matching and placed inside a custom 32-ch head coil in a 7T scanner. B0 shimming was performed by using a high-order local shim sequence. B1 transmit voltage was calibrated by using Actual Flip-angle Imaging technique, yielding maps of estimated voltage for a 180° reference pulse. The estimated voltage has a spatial variation approximately ±15%. The mean voltage was then entered manually as the reference voltage for the remaining acquisitions.
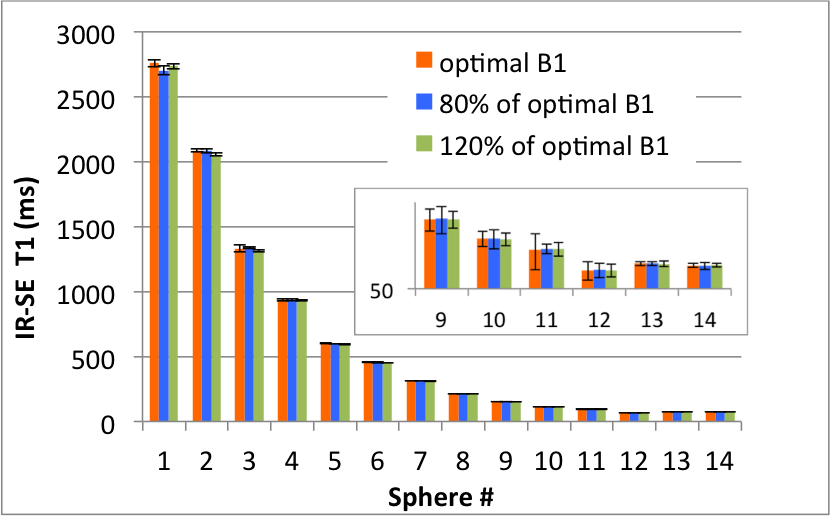
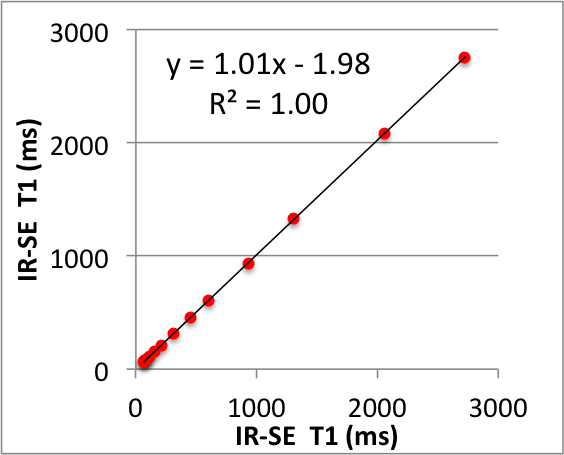
The T1 values of the NIST phantom was first measured by IR-SE with the following parameters: TR/TE/FA = 12.5s/6.4ms/180°, 1.6mmX1.6mm, a single 6mm slice, and TI of 24ms, 50ms, 75ms, 100ms, 125ms, 150ms, 250ms, 500ms, 750ms, 1000ms, 2000ms, and 3000ms. The whole series took 70 min. The IR-SE measurements were repeated in two different days for test and re-test reproducibility assessment. In addition, the B1 reference voltage was offset manually by ±20% to validate the sensitivity of IR-SE to B1.
T1 mapping was also performed at 7T by using MP2RAGE and VFA for comparisons. The imaging parameters for MP2RAGE are TR/TE = 5s/3.24ms, 1mm isotropic resolution, TI/FA = 900ms/4° and 3200ms/5°, and 6-min scan time. The imaging parameters for VFA are TR/TE = 8ms/3.63ms, 1.6mmX1.6mm, 16 5-mm slices, 3 averages, and nominal FAs of 2°, 5°, 10°, 15°, 20°, 25°, and 30°, for a total 7-min scan time. Temperature of the fomblin was recorded before and after the entire scanning session.
RESULTS
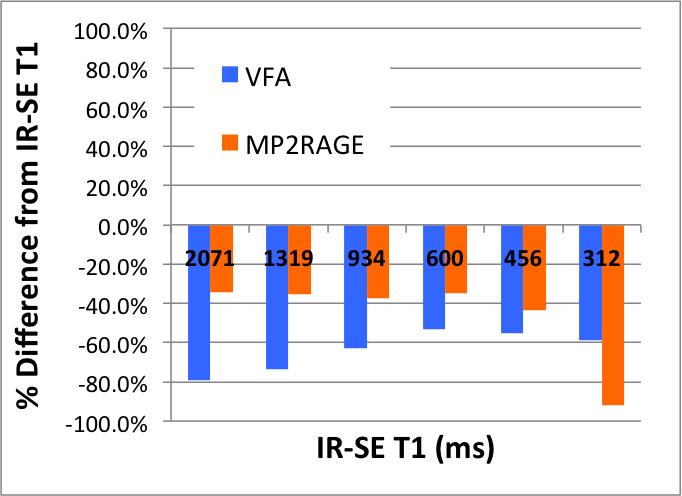
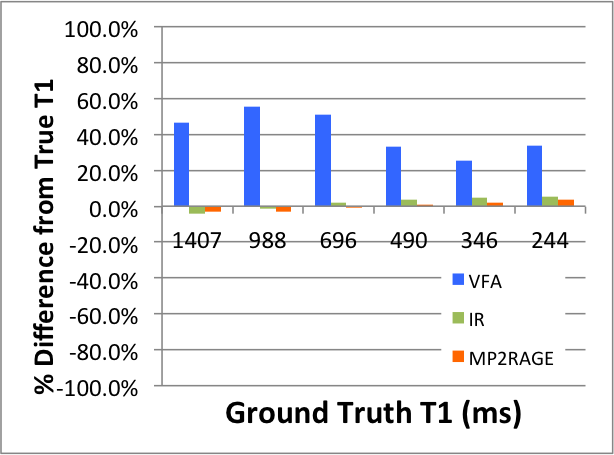
The IR-SE T1 values of the NIST phantom at 7T are listed in Figure 1. The 7T T1 values were higher than those published for 3T [2], as expected. With ±20% offset in B1 reference voltage, the IR-SE T1 values are consistent within errors (Fig. 2). At the optimal B1 reference voltage, the test and re-test IR-SE T1 values differed by less than 1.7%. (Fig. 3). The average of the test and re-test IR-SE T1s was used for sequence comparisons. T1 mapping using MP2RAGE yielded more accurate results than VFA within the brain T1 range at 7T (Fig. 4). As an additional validation, the phantom T1 was also measured at 3T using IR-SE and compared with ground truth T1 from NIST. The accuracy of IR-SE T1s was better than 5% within the brain T1 range at 3T, whereas the accuracy of MP2RAGE was comparable if not better than IR-SE (Fig. 5).DISCUSSION AND CONCLUSION
The T1 values of the NIST phantom were measured at 7T, for the first time, by using IR-SE. The IR-SE T1 measurement of NIST phantom was reproduced well and insensitive to B1 offset at 7T. Sequence comparisons, at 7T and 3T, showed that MP2RAGE performed better than VFA for T1 mapping within the range of brain T1, as expected. From the excellent MP2RAGE result at 3T, we anticipated a better MP2RAGE result at 7T than what was obtained so far. More work will be done to improve the MP2RAGE T1 mapping accuracy at 7T. Nevertheless, MP2RAGE is a promising technique for brain T1 mapping at 7T within a clinically acceptable scan time.Acknowledgements
This study was supported by NIH P41-EB015896, R01-EB019437, R21AG046657, R01HD071664, R01HD085813 and by the Athinoula A. Martinos Center for Biomedical Imaging. The experiment was made possible by NIH NCRR Shared Instrumentation Grants S10-RR023401 and S10-RR020948.References
1. Marques, J. P., Kober, T., Krueger, G., van der Zwaag, W., Van de Moortele, P.-F., Gruetter, R. MP2RAGE, a self bias-field corrected sequence for improved segmentation and T1-mapping at high field. NeuroImage 2010;49(2): 1271–81.
2. Keenan KE, Stupic KF, Boss MA, et al. Multi-site, multi-vendor comparison of T1 measurement using ISMRM/NIST system phantom. Proceedings of the 24th meeting of the ISMRM, Singapore, 2016. #3290.
Figures
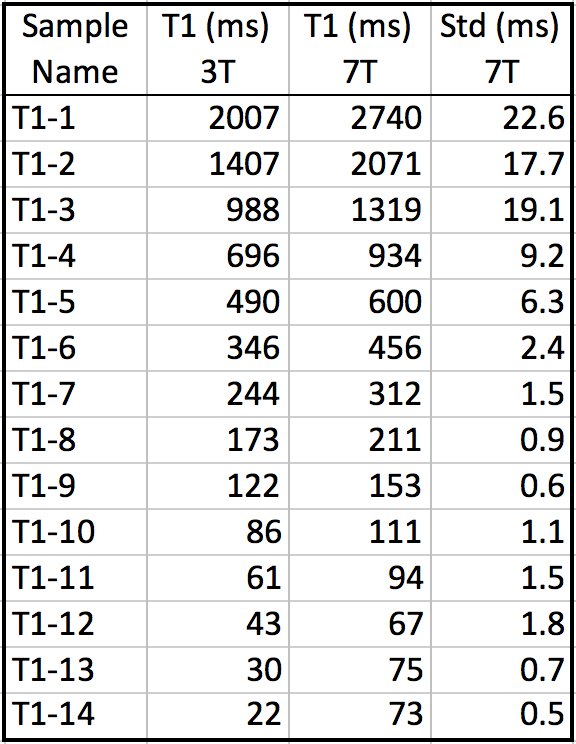
NIST T1 phantom T1 values: ground truth T1 [2] at 3T (second column from the left), IR-SE T1 (third column) and standard deviation (fourth column) at 7T.