5206
Quantitative measurements of perivascular spaces at 7T, using a semi-automatic tracking method1Department of Radiology, University Medical Center Utrecht, Utrecht, Netherlands, 2Image Sciences Institute, University Medical Center Utrecht, Utrecht, Netherlands, 3Brain Center Rudolf Magnus, Department of Neurology, University Medical Center Utrecht, Utrecht, Netherlands, 4Julius Center for Health Sciences and Primary Care, University Medical Center Utrecht, Utrecht, Netherlands
Synopsis
Currently, perivascular spaces (PVS) are mostly investigated with qualitative measures. In this work, PVS in the centrum semiovale were tracked using a semi-automatic method, and PVS length and tortuosity were determined. Univariate and multivariate linear regression was performed for age, number of tracked PVS, PVS length, and PVS tortuosity. The results show that quantitative assessment of PVS beyond counting is feasible, and a significant positive association between PVS length and the number of tracked PVS was found. These quantitative measurements may be more suitable than qualitative methods to investigate PVS.
Purpose
Perivascular spaces (PVS) are associated with age1,2 and various diseases, including small vessel disease (SVD)3. PVS are also believed to be involved in the clearance of waste products from the brain. A non-invasive, quantitative method to assess PVS in the brain would allow better understanding of PVS as marker of disease.
Currently, only qualitative measures are available, based on the number of PVS in the basal ganglia and/or centrum semiovale4. More quantitative markers, such as PVS length and tortuosity, could carry more precise information.
In this proof-of-principle study, a semi-automatic method to track and quantify PVS was developed. Therefore, the aim was to investigate the feasibility of this method to track PVS and obtain quantitative information about length and tortuosity.
Methods
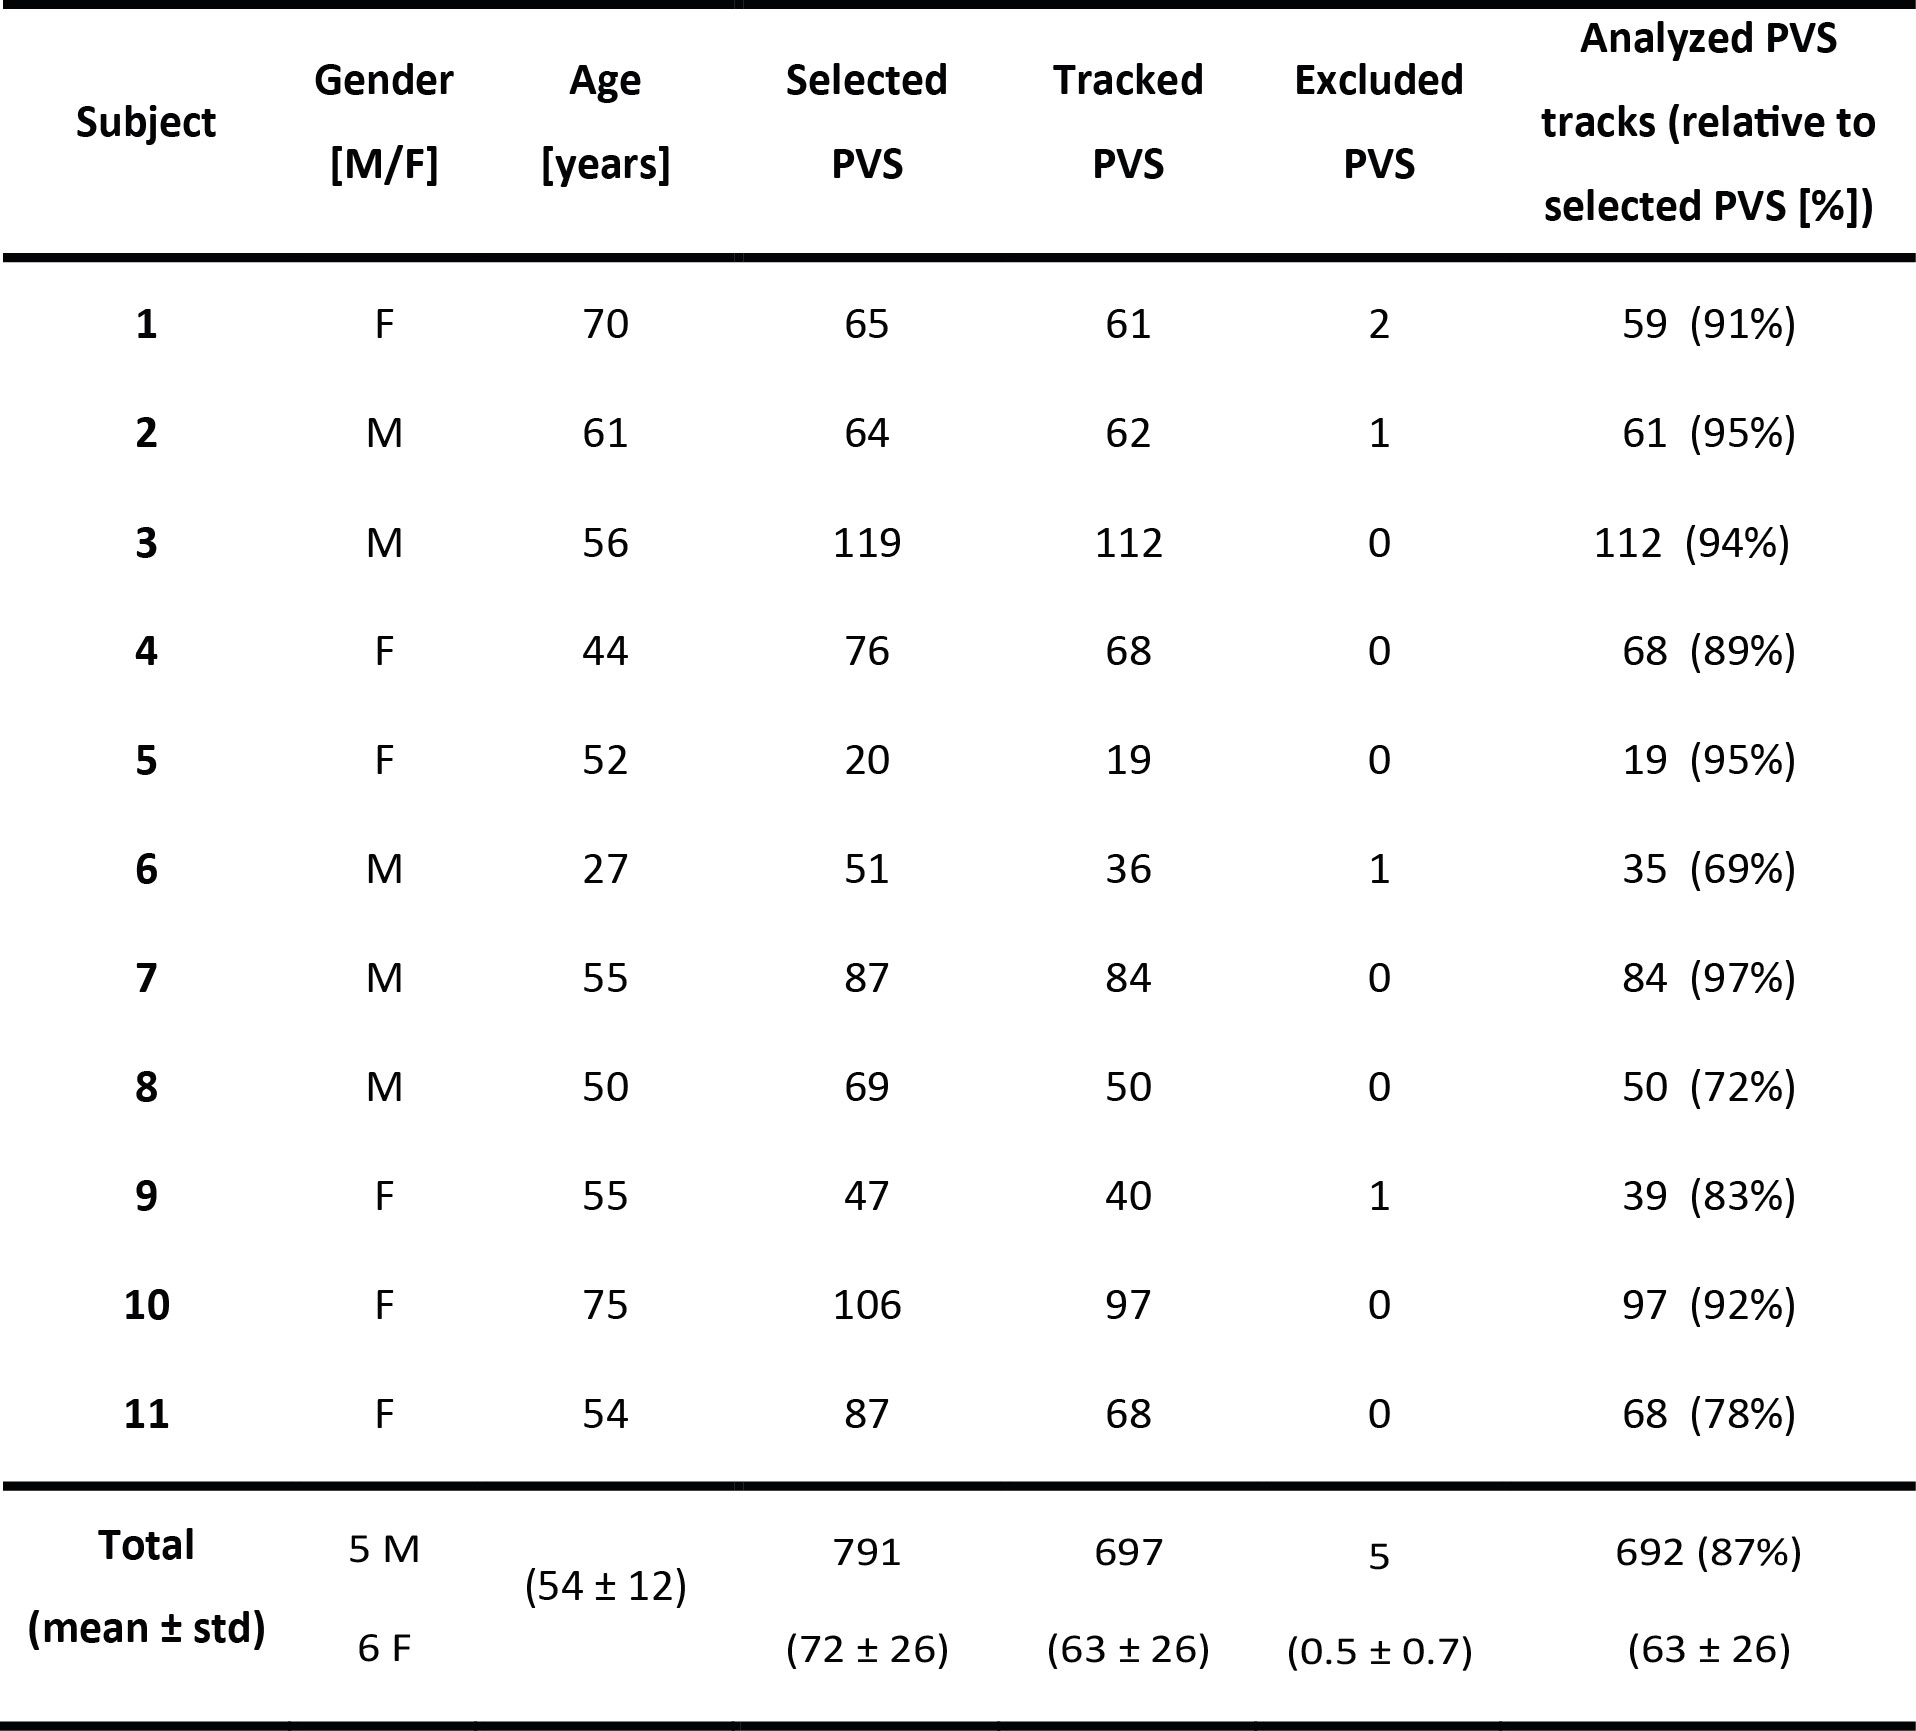
We used images of 11 subjects from a previously described study5. Briefly, for all subjects a 3D T2-weighted TSE sequence at 7T was available (acquired resolution 0.7 mm isotropic, interpolated to 0.35 mm isotropic). Subject characteristics are summarized in Table 1.
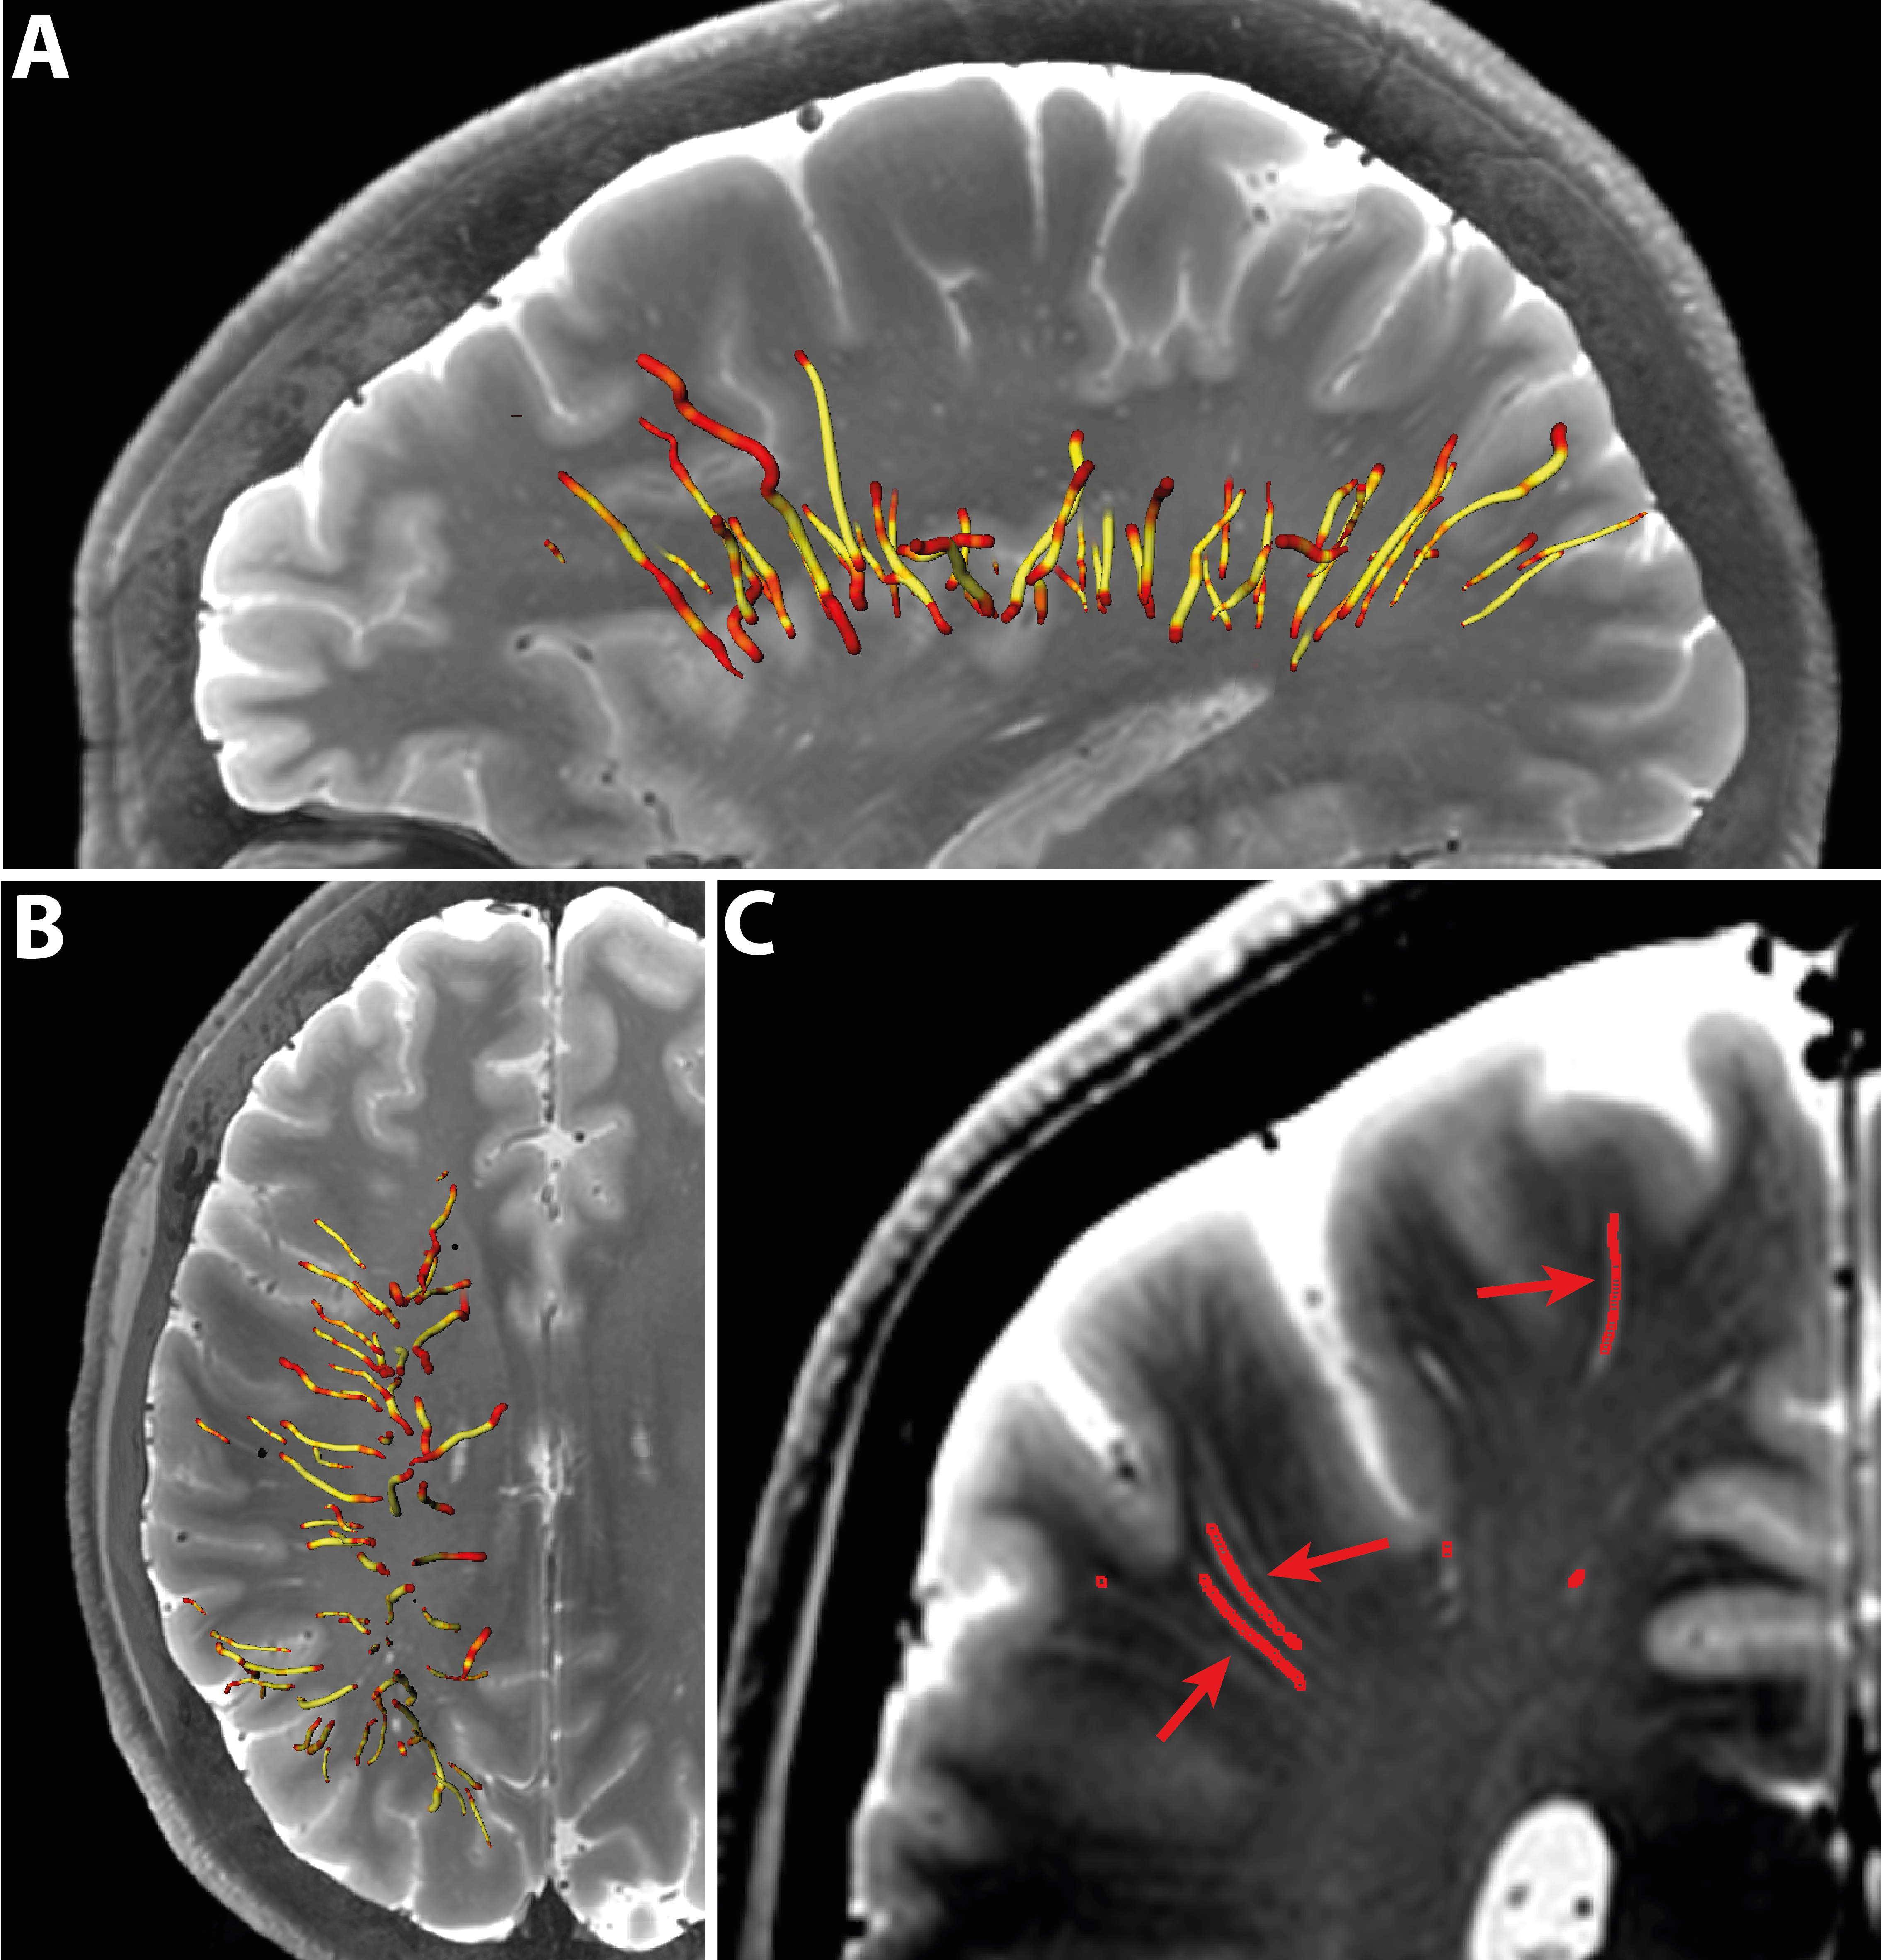
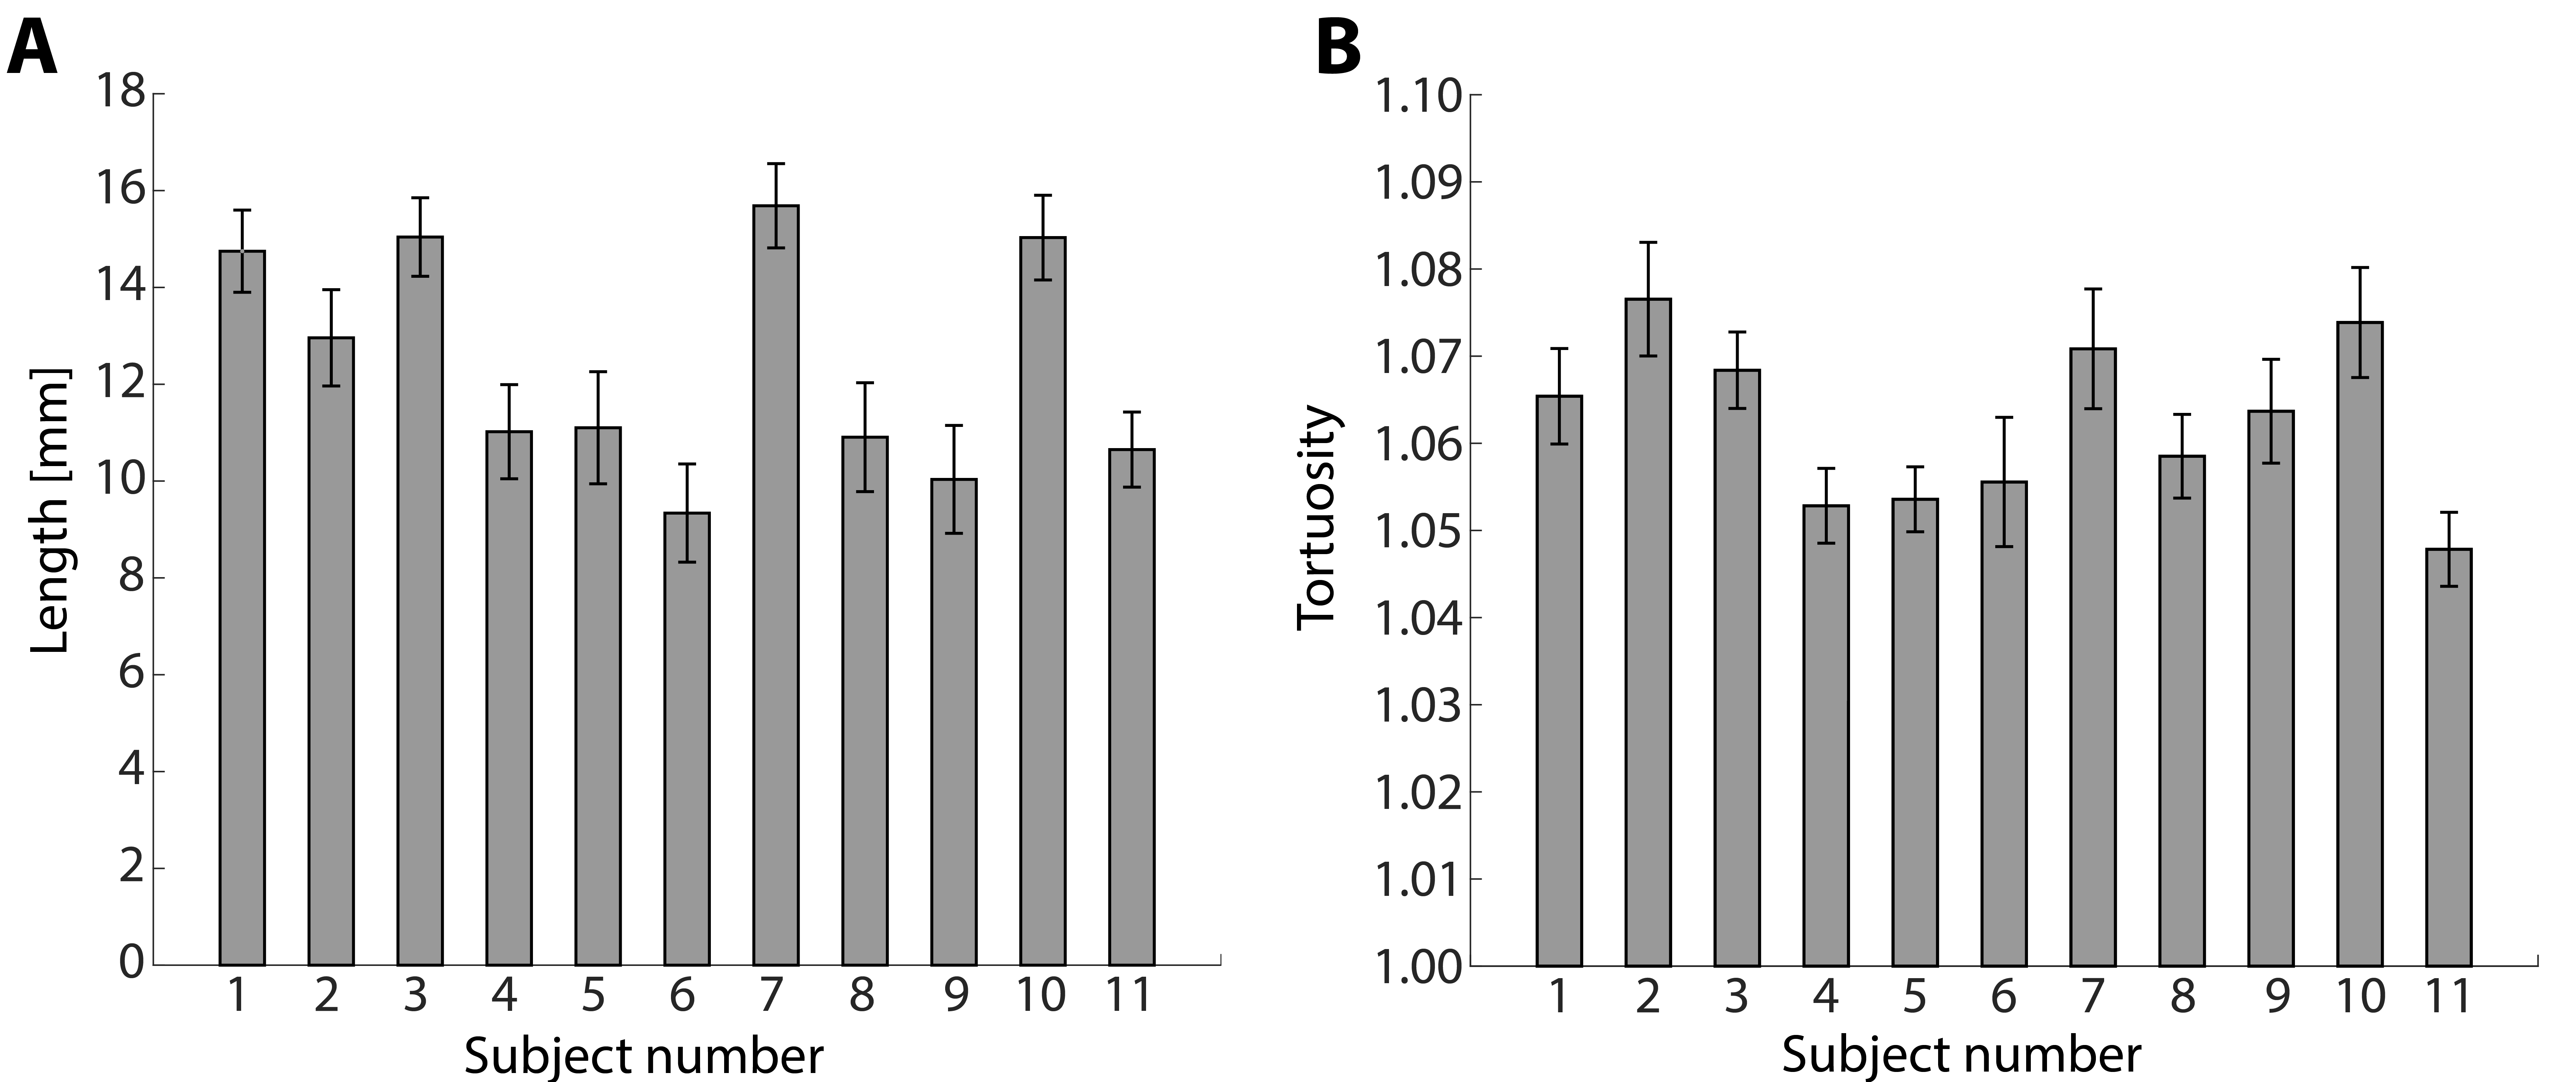
For each subject, PVS markers from an expert were available, marking individual PVS in the centrum semiovale in the right hemisphere on one slice5. The scans were vesselness-filtered to enhance PVS-contrast6,7, and thresholding was performed to further suppress background signal. Bidirectional tubular tracking was performed8, using the marked PVS as seed point. Tracking was considered successful when tracking could follow the PVS from the seed point over minimally 0.7 mm (2 voxels). Tracked PVS longer than 40 mm were excluded from further analysis, since these were tracked into the subarachnoid spaces. Mean PVS length and tortuosity τ (τ = L/C, with L the PVS length, and C the distance between the endpoints of the curve) were determined.
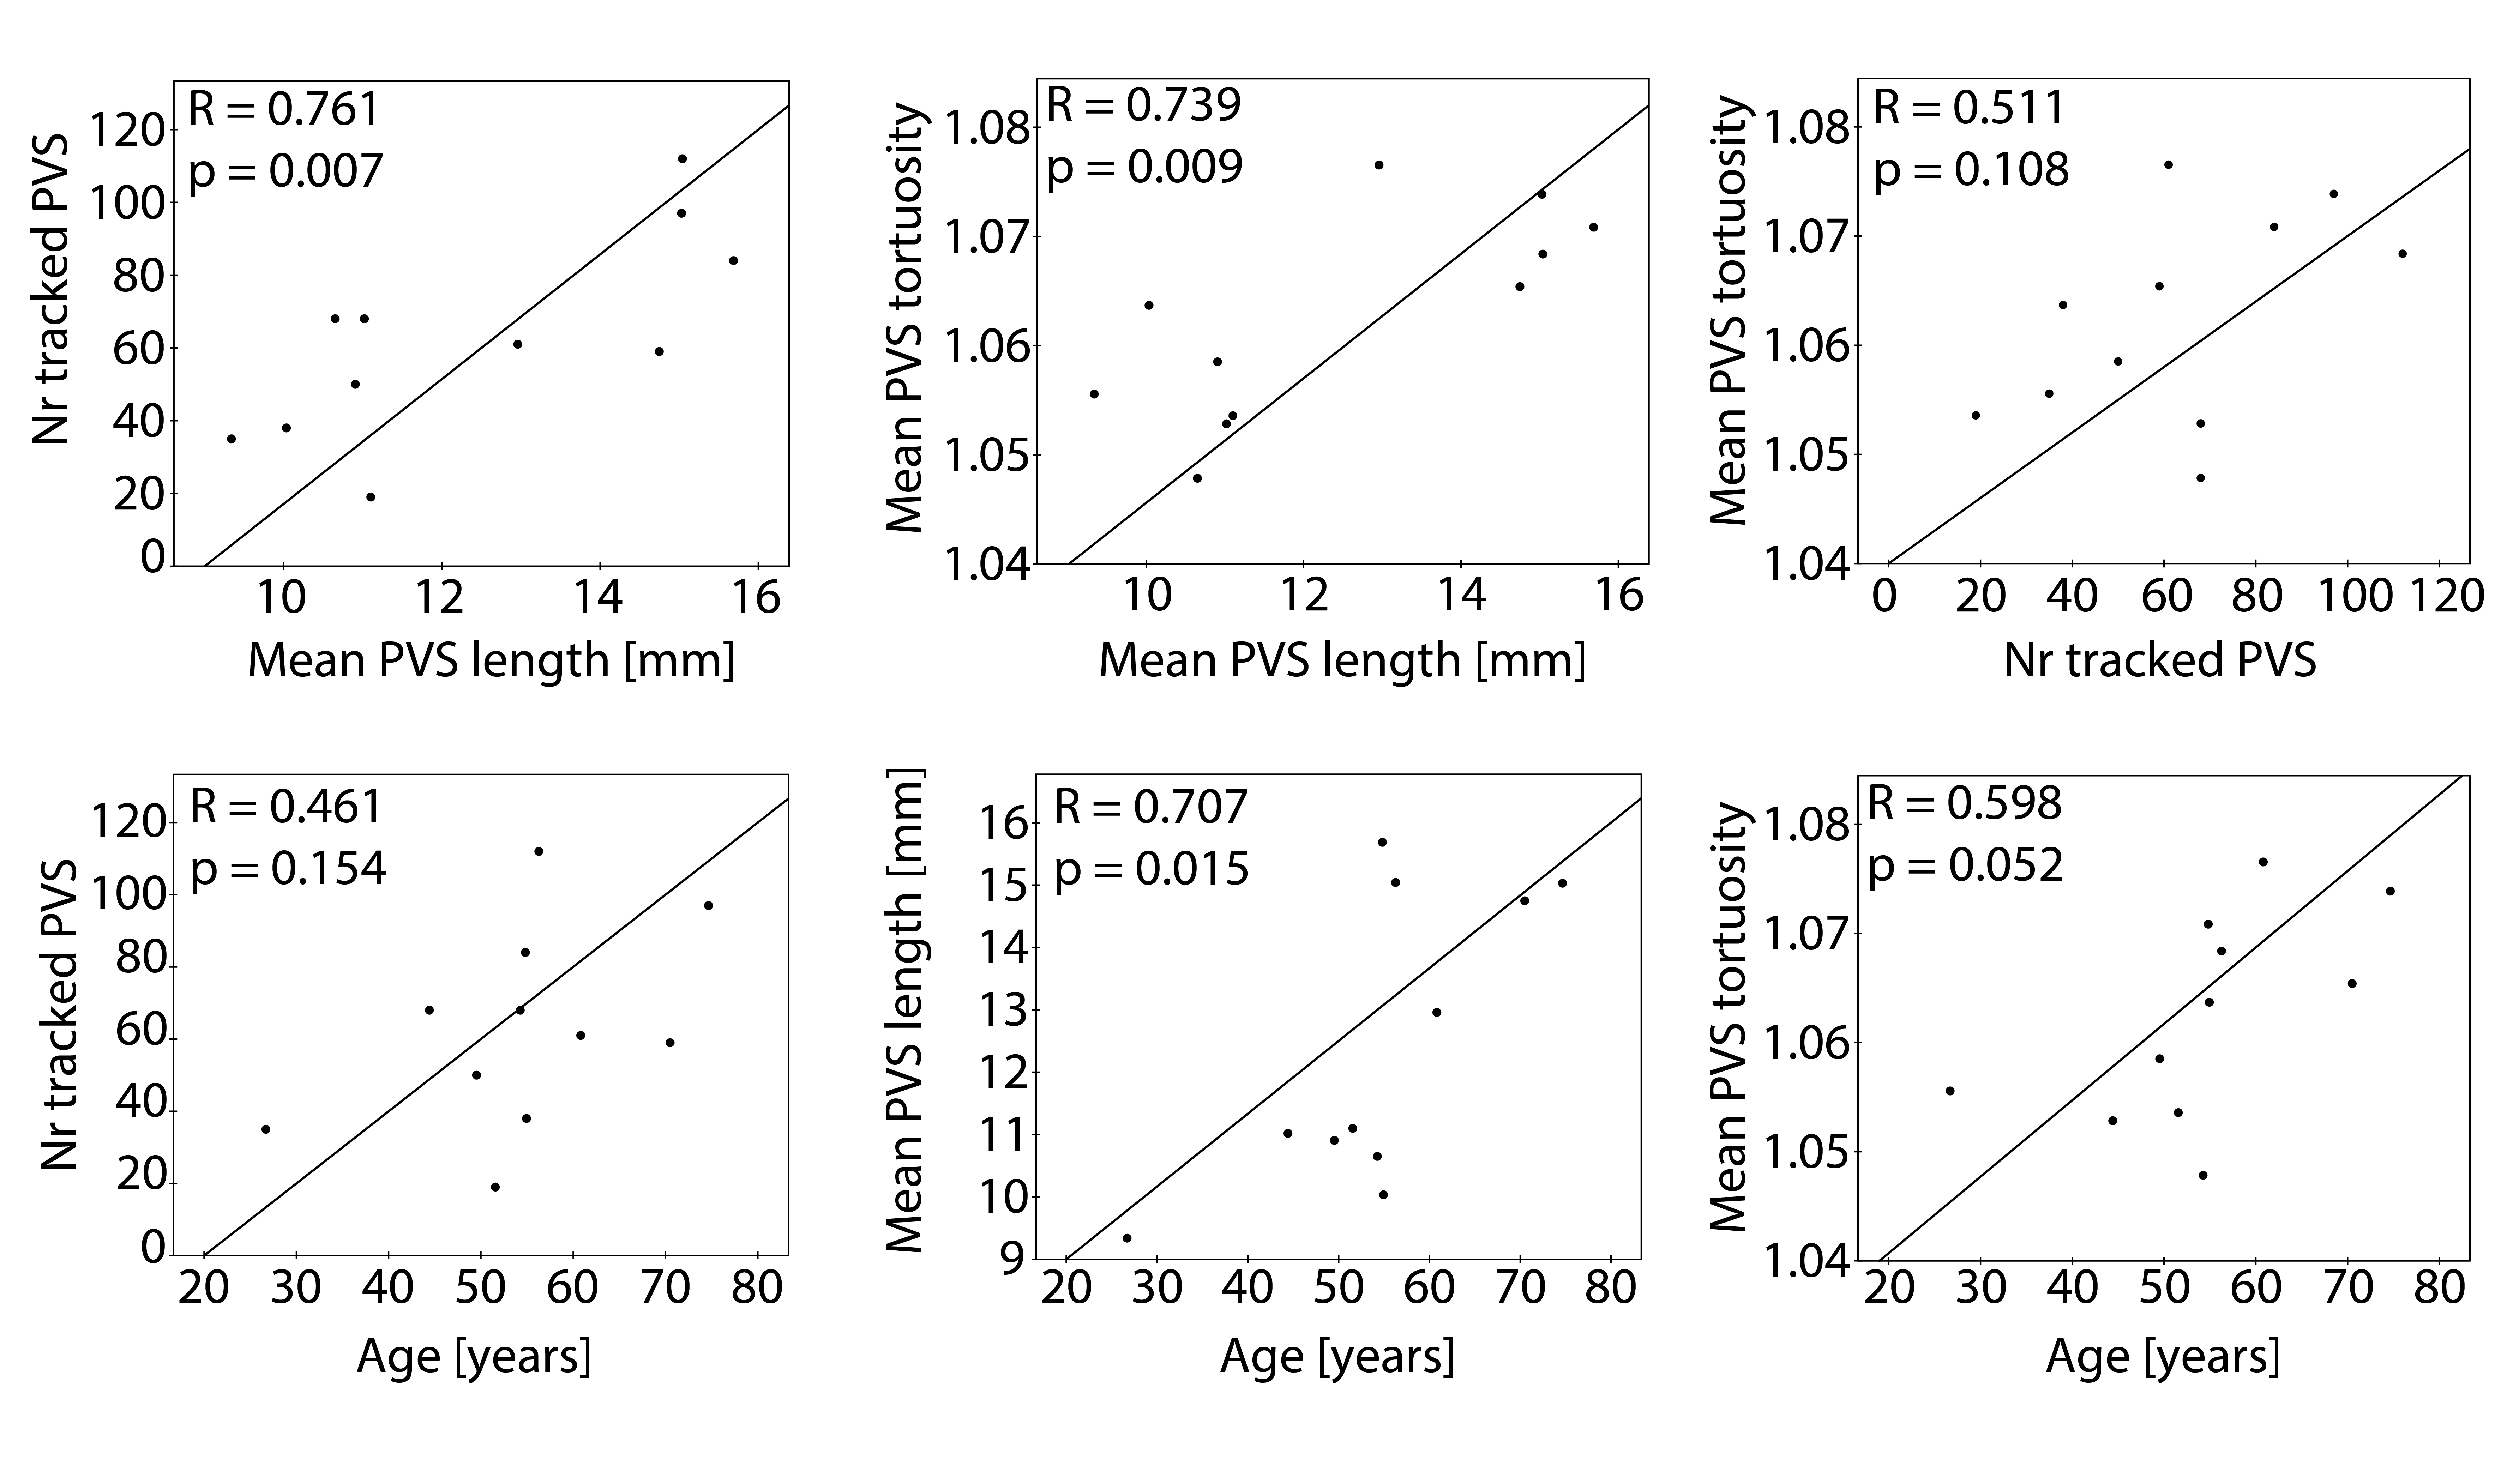
To explore the obtained PVS metrics, six univariate linear regression analyses were performed: independent variables were age (compared with the number of tracked PVS, mean PVS length, and mean PVS tortuosity), mean PVS tortuosity (compared with the number of tracked PVS and mean PVS length), and mean PVS length (compared with the number of tracked PVS). Multivariate regression analysis was performed with the number of tracked PVS as dependent variable, and the remaining variables (that were significant in the univariate analyses) as independent variables. Significance level was p<0.05. Statistical analysis was performed in SPSS v20.
Results
Table 1 summarizes subject characteristics, the number of manually marked PVS, successfully tracked PVS, excluded PVS, and analyzed PVS tracks. Tracking results for one subject are shown in Figure 1. Mean and standard error of the mean (SEM) of PVS length and tortuosity for all subjects are shown in Figure 2. Results from the univariate linear regression are shown in Figure 3. All four variables, i.e. age, the number of tracked PVS, mean PVS tortuosity, and mean PVS length, were part of at least one significant, positive association (p<0.05). Multivariate regression resulted in a significant model: larger PVS length was associated with a larger number of tracked PVS (p=0.008).Discussion
The results show that PVS tracking is feasible, and PVS length and tortuosity can be determined using this method. The mean PVS lengths found with this method are longer compared to literature: Zong9 reported a median PVS length of approximately 5 mm (range 0-30 mm), while the median PVS length found in this work was 11.2 mm. However, Zong used younger subjects (ages 21-37 years), compared to the population used for this work (ages 27-75 years).
Most studies investigating PVS in relation to disease, use qualitative measures such as the rating scale introduced by Potter4, which rates PVS between 0-4 based on count, where rate 4 indicates >40 PVS. In the current study, performed at 7T, most subjects are rated 4 on this scale. However, the regression results show continuous variation in e.g. PVS length, dependent on the number of PVS, consistent with Wang10, so this rating scale may not be suitable.
Most selected PVS were successfully tracked (87%). Since manual PVS selection was performed, a part of the untracked PVS may be due to selection errors. Further optimization of the method might increase the number of successfully tracked PVS and prevent any PVS tracking outside the true PVS.
In the future, a fully automatic whole-brain PVS tracking method may be developed, eliminating manual PVS selection, to retrieve maximal PVS information, which could be very useful to investigate the role of (enlarged) PVS in various diseases, including SVD.
Conclusion
Semi-automatic PVS tracking is feasible and can supply quantitative PVS information, like length and tortuosity. A significant, positive association was found between PVS and the number of tracked PVS.
Acknowledgements
This work was supported by the European Research Council, ERC grant agreement n°337333.References
1. Barth M, Moser E. Proton NMR relaxation times of human blood samples at 1.5 T and implications for functional MRI. Cell Mol Biol. 1997;43:783–791.
2. Satizabal CL, Zhu YC, Dufouil C, et al. Inflammatory proteins and the severity of dilated Virchow-Robin spaces in the elderly. J Alzheimer’s Dis. 2013;33(2):323–328.
3. Doubal FN, MacLullich AMJ, Ferguson KJ, et al. Enlarged Perivascular Spaces on MRI Are a Feature of Cerebral Small Vessel Disease. Stroke. 2010;41(3):450–454.
4. Potter GM, Chappell FM, Morris Z, et al. Cerebral perivascular spaces visible on magnetic resonance imaging: Development of a qualitative rating scale and its observer reliability. Cerebrovasc Dis. 2015;39(3-4):224–231.
5. Bouvy WH, Zwanenburg JJM, Reinink R, et al. Perivascular spaces on 7 Tesla brain MRI are related to markers of small vessel disease but not to age or cardiovascular risk factors. JCBFM. 2016;36(10):1708–1717.
6. Frangi AF, Niessen WJ, Vincken KL, et al. Multiscale vessel enhancement filtering. Med Image Comput Comput Interv. 1998:130–137.
7. Sato Y, Nakajima S, Shiraga N, et al. Three-dimensional multi-scale line filter for segmentation and visualization of curvilinear structures in medical images. Med Image Anal. 1998;2(2):143–168.
8. Friman O, Hindennach M, Kühnel C, et al. Multiple hypothesis template tracking of small 3D vessel structures. Med Image Anal. 2010;14(2):160–171.
9. Zong X, Park SH, Shen D, et al. Visualization of perivascular spaces in the human brain at 7T: Sequence optimization and morphology characterization. Neuroimage. 2016;125:895–902.
10. Wang X, Valdés Hernández M del C, Doubal F, et al. Development and initial evaluation of a semi-automatic approach to assess perivascular spaces on conventional magnetic resonance images. J Neurosci Methods. 2016;257:34–44.
Figures