5203
Cartesian MR Fingerprinting at 7T for Rapid Quantification of Relaxation Times in the Eye1Leiden University Medical Center, Leiden, Netherlands, 2Philips Research Hamburg, Germany
Synopsis
MR imaging of the eye requires a sequence of scans with different contrast to provide the necessary information on ocular conditions. In this study we apply Cartesian MR fingerprinting in the eye at 7T to add quantitative information to the standard clinical protocol, with the final goal of advancing disease diagnosis.
Introduction
MR imaging of the eye is a relatively new diagnostic tool for ocular pathologies. One of its main strengths is the ability to image opaque structures such as tumours1. Because of the small anatomies high spatial resolution is necessary, making high field preferable. Current clinical protocols consist of several contrast-weighted scans to differentiate between the ocular tissues, but measures remain qualitative. Quantitative T1 and T2 measures would give access to a new dimension of information, such as the discrimination between different classes of eye tumours.Purpose
In this study we describe an MR fingerprinting sequence2 which has been adapted for ocular imaging and we evaluate this technique to quantify T1 and T2 in five healthy subjects.Methods
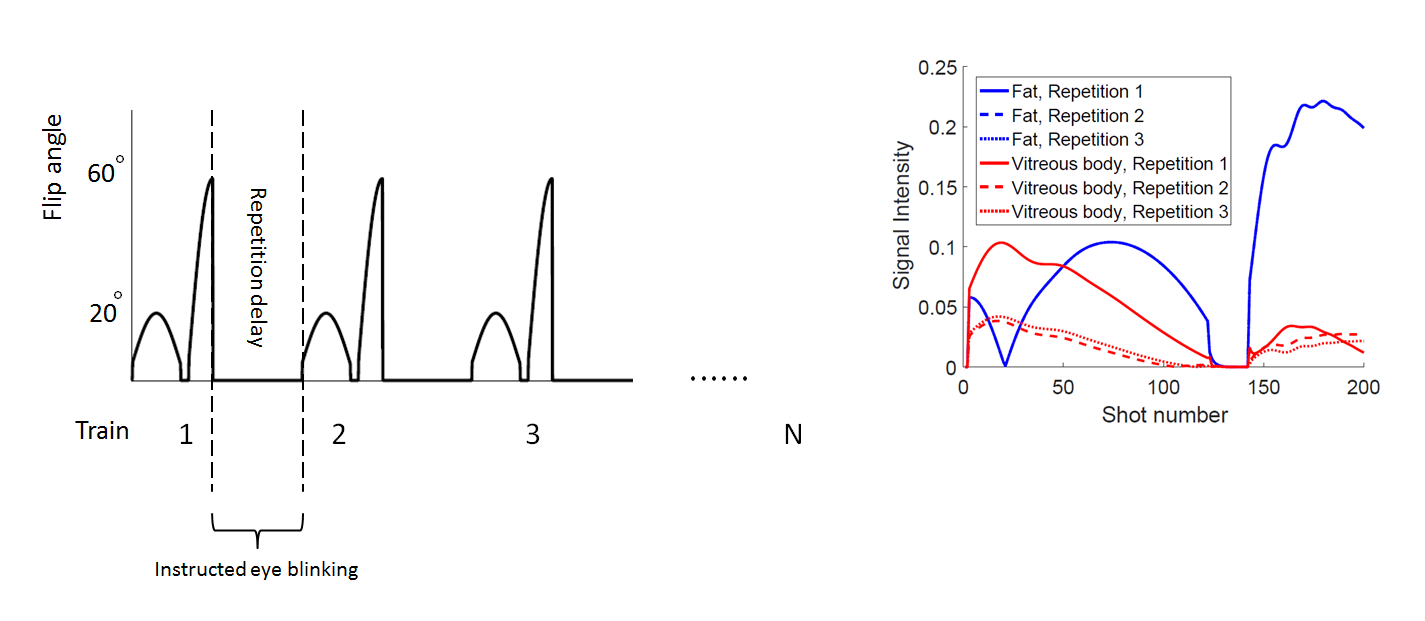
Fingerprinting definition: A sinusoidal pattern of flip angles ranging from 5° to 60° was used preceded by a 22 ms inversion pulse3 (Figure 1). The TE/TR/RF-phase was fixed to 3.5ms/11ms/0°. The dictionary was calculated using the extended phase graph formalism4, integrating the measured B1+ value in the eye. 70.000 signal evolutions were simulated with T1 and T2 values ranging from 10-7000 ms5 and 10-1000 ms, respectively.
The relatively long T1 (~4625 ms) of the vitreous body5 means that full recovery of longitudinal magnetization takes over 13 seconds. Such a long repetition delay is not feasible in practise. Therefore, we implemented a shorter repetition delay of 2 seconds, resulting in a partial recovery of longitudinal magnetization6. Calculations showed that two dummy flip angle trains were sufficient to ensure a steady state signal for all subsequent trains (Figure 1). Signal reduction for long-T1 tissues is compensated by a shortened scanning time. Furthermore, the 2 second delay allows for the subject to blink between the trains, reducing eye-blink related motion artefacts7,8.
Data acquisition: Spiral k-space coverage is an efficient sampling scheme2,3, however, due to the abundance of orbital fat and its relatively short T1, off-resonance blurring of the fat signal compromises MRF analysis. We therefore used Cartesian sampling, with partial Fourier and undersampling9, to acquire the images.
We evaluated this technique in five healthy volunteers, using a 7T Achieva MR system (Philips Healthcare) and a custom-built 1-channel eye receive coil1. Scan parameters: FOV 100x100 mm2, resolution 0.6x0.6x6.0 mm3, total undersampling factor of 3.3, scan time of 3:43 minutes. The fingerprinting scan was performed twice for each subject. First, the subjects were asked to close his/her eyes and second, the subjects were instructed to focus on a fixation target and to blink in the 2 seconds repetition delay.
Signal evolutions in the MR images were matched to a dictionary entry using an inner product based selection process.
Results
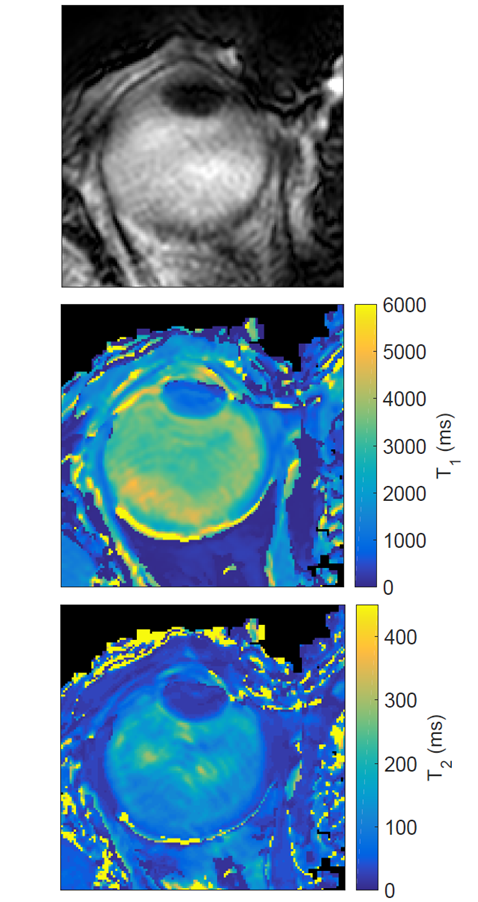
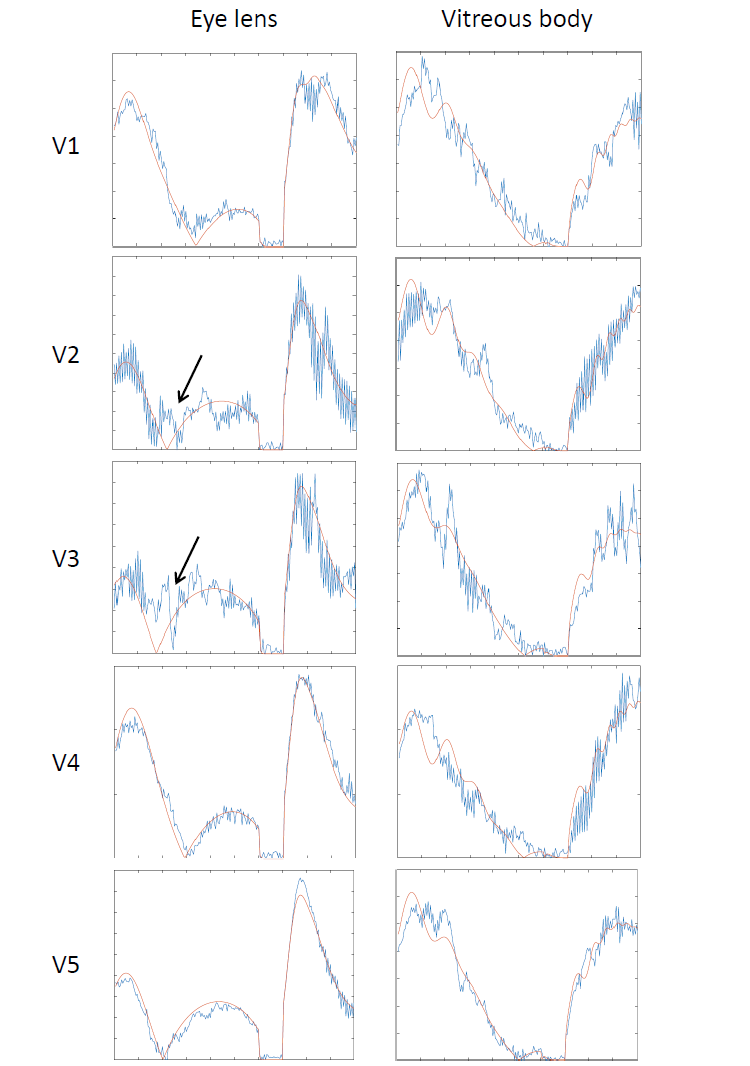
Figure 2 shows a reconstructed image of the Cartesian MRF train, along with the matched T1 and T2 maps. The longitudinal relaxation time of the vitreous body is 3400 ms on average, with subject specific matches shown in Figures 3 and 4. The cued-blinking protocol reduces the sensitivity to motion artefacts compared to closed eyes scans in which severe motion artefacts hindered successful matching. With cued-blinking, matching results show more, but not completely, homogeneous T1 and T2 maps.Discussion and Conclusion
In this study the fingerprinting technique has been tailored to the eye, which is challenging due to the long T1, high fat content and the limited scan time due to eye motion. Cartesian sampling with short repetition delays has shown to effectively solve some of the issues, but motion artefacts remain a significant confounding factor. The cued-blinking protocol efficiently uses the waiting time, reduces motion related artefacts and increases patient comfort. Since the fingerprinting scans allow undersampling factors of 3.3, the resulting scan takes less than 4 minutes. The matches of the vitreous body agree with literature, considering the fact that the actual T1 value is largely dependent on the measurement method and the condition of the eye.
In conclusion, these results show the feasibility of MR fingerprinting to quantify tissue parameters in the eye at 7T, but further work has to be done to improve the robustness of the MRF approach against eye motion. The current implementation acquires similar k-space data during a train, resulting in no spatial variation of the undersampling artefacts. A more random k-space filling would introduce spatial variation of the artefacts, so that they can be averaged out in the matching process similarly to undersampling artefacts in spiral MRF.
Acknowledgements
Thanks to Mariya Doneva and Karsten Sommer (Philips Research Hamburg) for helpful discussions.References
1. Beenakker JM, et al. Clinical evaluation of ultra-high-field MRI for three-dimensional visualisation of tumour size in uveal melanoma patients, with direct relevance to treatment planning. Magn Reson Mater Phy 29, 571-577 (2016)
2. Ma D, et al. Magnetic resonance fingerprinting. Nature 495, 187-192 (2013)
3. Jiang Y, et al. MR Fingerprinting Using Fast Imaging with Steady State Precession (FISP) with Spiral Readout. Magn Res Med 74, 1621-1631 (2015)
4. Scheffler K. A pictorial Description of Steady-States in Rapid Magnetic Resonance Imaging. Concepts in Magnetic Resonance 11(5), 291-304 (1999)
5. Richdale K, et al. 7T MR Imaging of the Human Eye In Vivo. J Magn Reson Imaging 30(5), 924-932 (2009)
6. Amthor T, et al. Steady-State Magnetic Resonance Fingerprinting. Proc. Intl. Soc. Mag. Reson. Med. 24 (2016)
7. Berkowitz BA, et al. Measuring the Human Retinal Oxygenation Response to a Hyperoxic Challenge Using MRI: Eliminating Blinking Artifacts and Demonstrating Proof of Concept. Magn Res Med 46, 412-416 (2001)
8. Beenakker JM, et al. Automated Retinal Topographic Maps Measured with Magnetic Resonance Imaging. Multidisciplinary Opthalmic Imaging 56(2), 1033-1039 (2015)
9. Katscher U, et al. Underdetermined SENSE using a-priori knowledge. Proc. Intl. Soc. Mag. Reson. Med. 10 (2002)
Figures