5202
Biased Fuzzy C means based intensity inhomogeneity correction for segmentation of abdominal fat in DIXON MR Images1Laboratory of Molecular Imaging, Singapore Bioimaging Consortium, Singapore, Singapore, 2Singapore Institute for Clinical Sciences, Singapore
Synopsis
Uniform distribution of intensity values for a given tissue type is desirable for accurate segmentation and quantification. Factors like non-uniform static magnetic field, motion artifacts, and inconsistent RF coil sensitivity introduce intensity inhomogeneity during MR image acquisition. Several methods for intensity inhomogeneity correction are proposed in the literature. We explored the suitability of Biased fuzzy C-means (BFCM) correction for quantification of abdominal fat from Dixon images. In our study we formulated a new 2-pass, 2D (intra-slice and inter-slice) BFCM framework for improved segmentation and quantification of abdominal fat.
Purpose:
Intensity inhomogeneity is commonly observed over imaging volume due to non-uniform static magnetic field and inconsistent RF coil sensitivity. Uniform distribution of intensity values for a given tissue type is beneficial for segmentation on MRI images. In this study we evaluated the performance of Biased Fuzzy C means (BFCM) algorithm1 for intensity inhomogeneity correction in fat tissue acquired using Dixon sequence. Commonly used automatic global thresholding methods like Otsu 2, Isodata 3 , Renyi’s entropy measure 4 and Yen’s measure 5 were applied to measure the efficacy of intensity correction by BFCM.Materials and Methods:
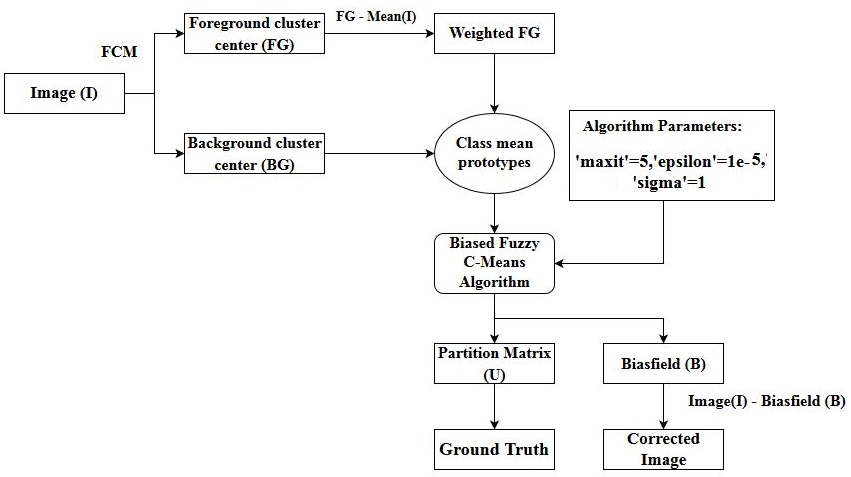
MR Imaging: MR abdominal image data were acquired using a Siemens Tim Trio 3T MR scanner. Two-point Dixon sequence with parameters TR/TE1/TE2/FA/BW1/BW2 / Num of slices/ interslice gap / slice thickness / intra-slice resolution = 5.28ms / 2.45ms / 3.68 ms / 90/ 500 Hz/Px / 780 Hz/Px /80 /0.6mm /3mm / 1.25 mm x1.25 mm was used acquire the abdominal images after anatomical localization 6. The region between L1 – L5 of the spine was imaged under breath hold. Institutional review board approval and written consent from the subjects were taken for the study. Processing: The flowchart of the algorithm is shown in Figure-1. A 2 class (background (BG) and foreground (FG)) Fuzzy C-means (FCM) based clustering was performed on each slice of the data to estimate the centres of the BG and FG. A weighted FG (Cent FG - Mean (I); where I = nonzeros pixels of the image) value was used for the estimation of the bias field using Biased fuzzy C means (BFCM) algorithm1. BFCM parameters were set for 3D and was computed once for volume based processing, whereas in 2D slice based processing it was first computed to correct intra-slice variation and in the second run of BFCM the inter-slice variation was processed. The partition matrix component of fat was used as ground truth for comparison of thresholding based segmentation methods. Dice similarity coefficient (DSC) 7 was used to estimate the quality of segmentation before and after bias field correction (Two pass – inter-slice & intra-slice; Single pass – 3D volume correction) by comparing the segmented masks with the fat ground truth mask. A total of 11 abdominal examinations were used in this study. Original and corrected image volumes for all 11 examinations were segmented for fat regions using global thresholding methods namely OTSU, Yen, Renyi Entropy and Isodata. Algorithm parameters used are; Number of iterations= 5, epsilon = 1e-5, sigma = 1. All calculations were performed on MATLAB® and Image J.Results:
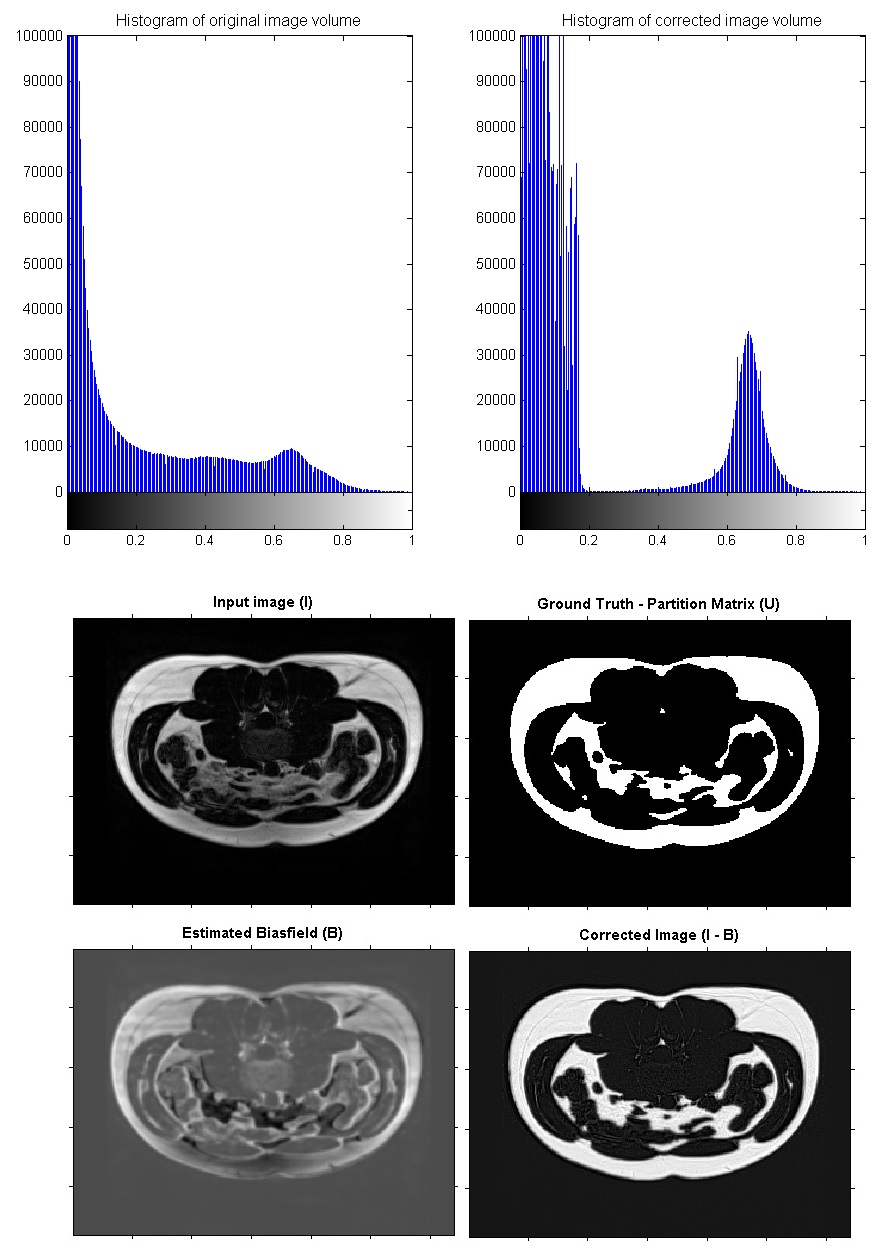
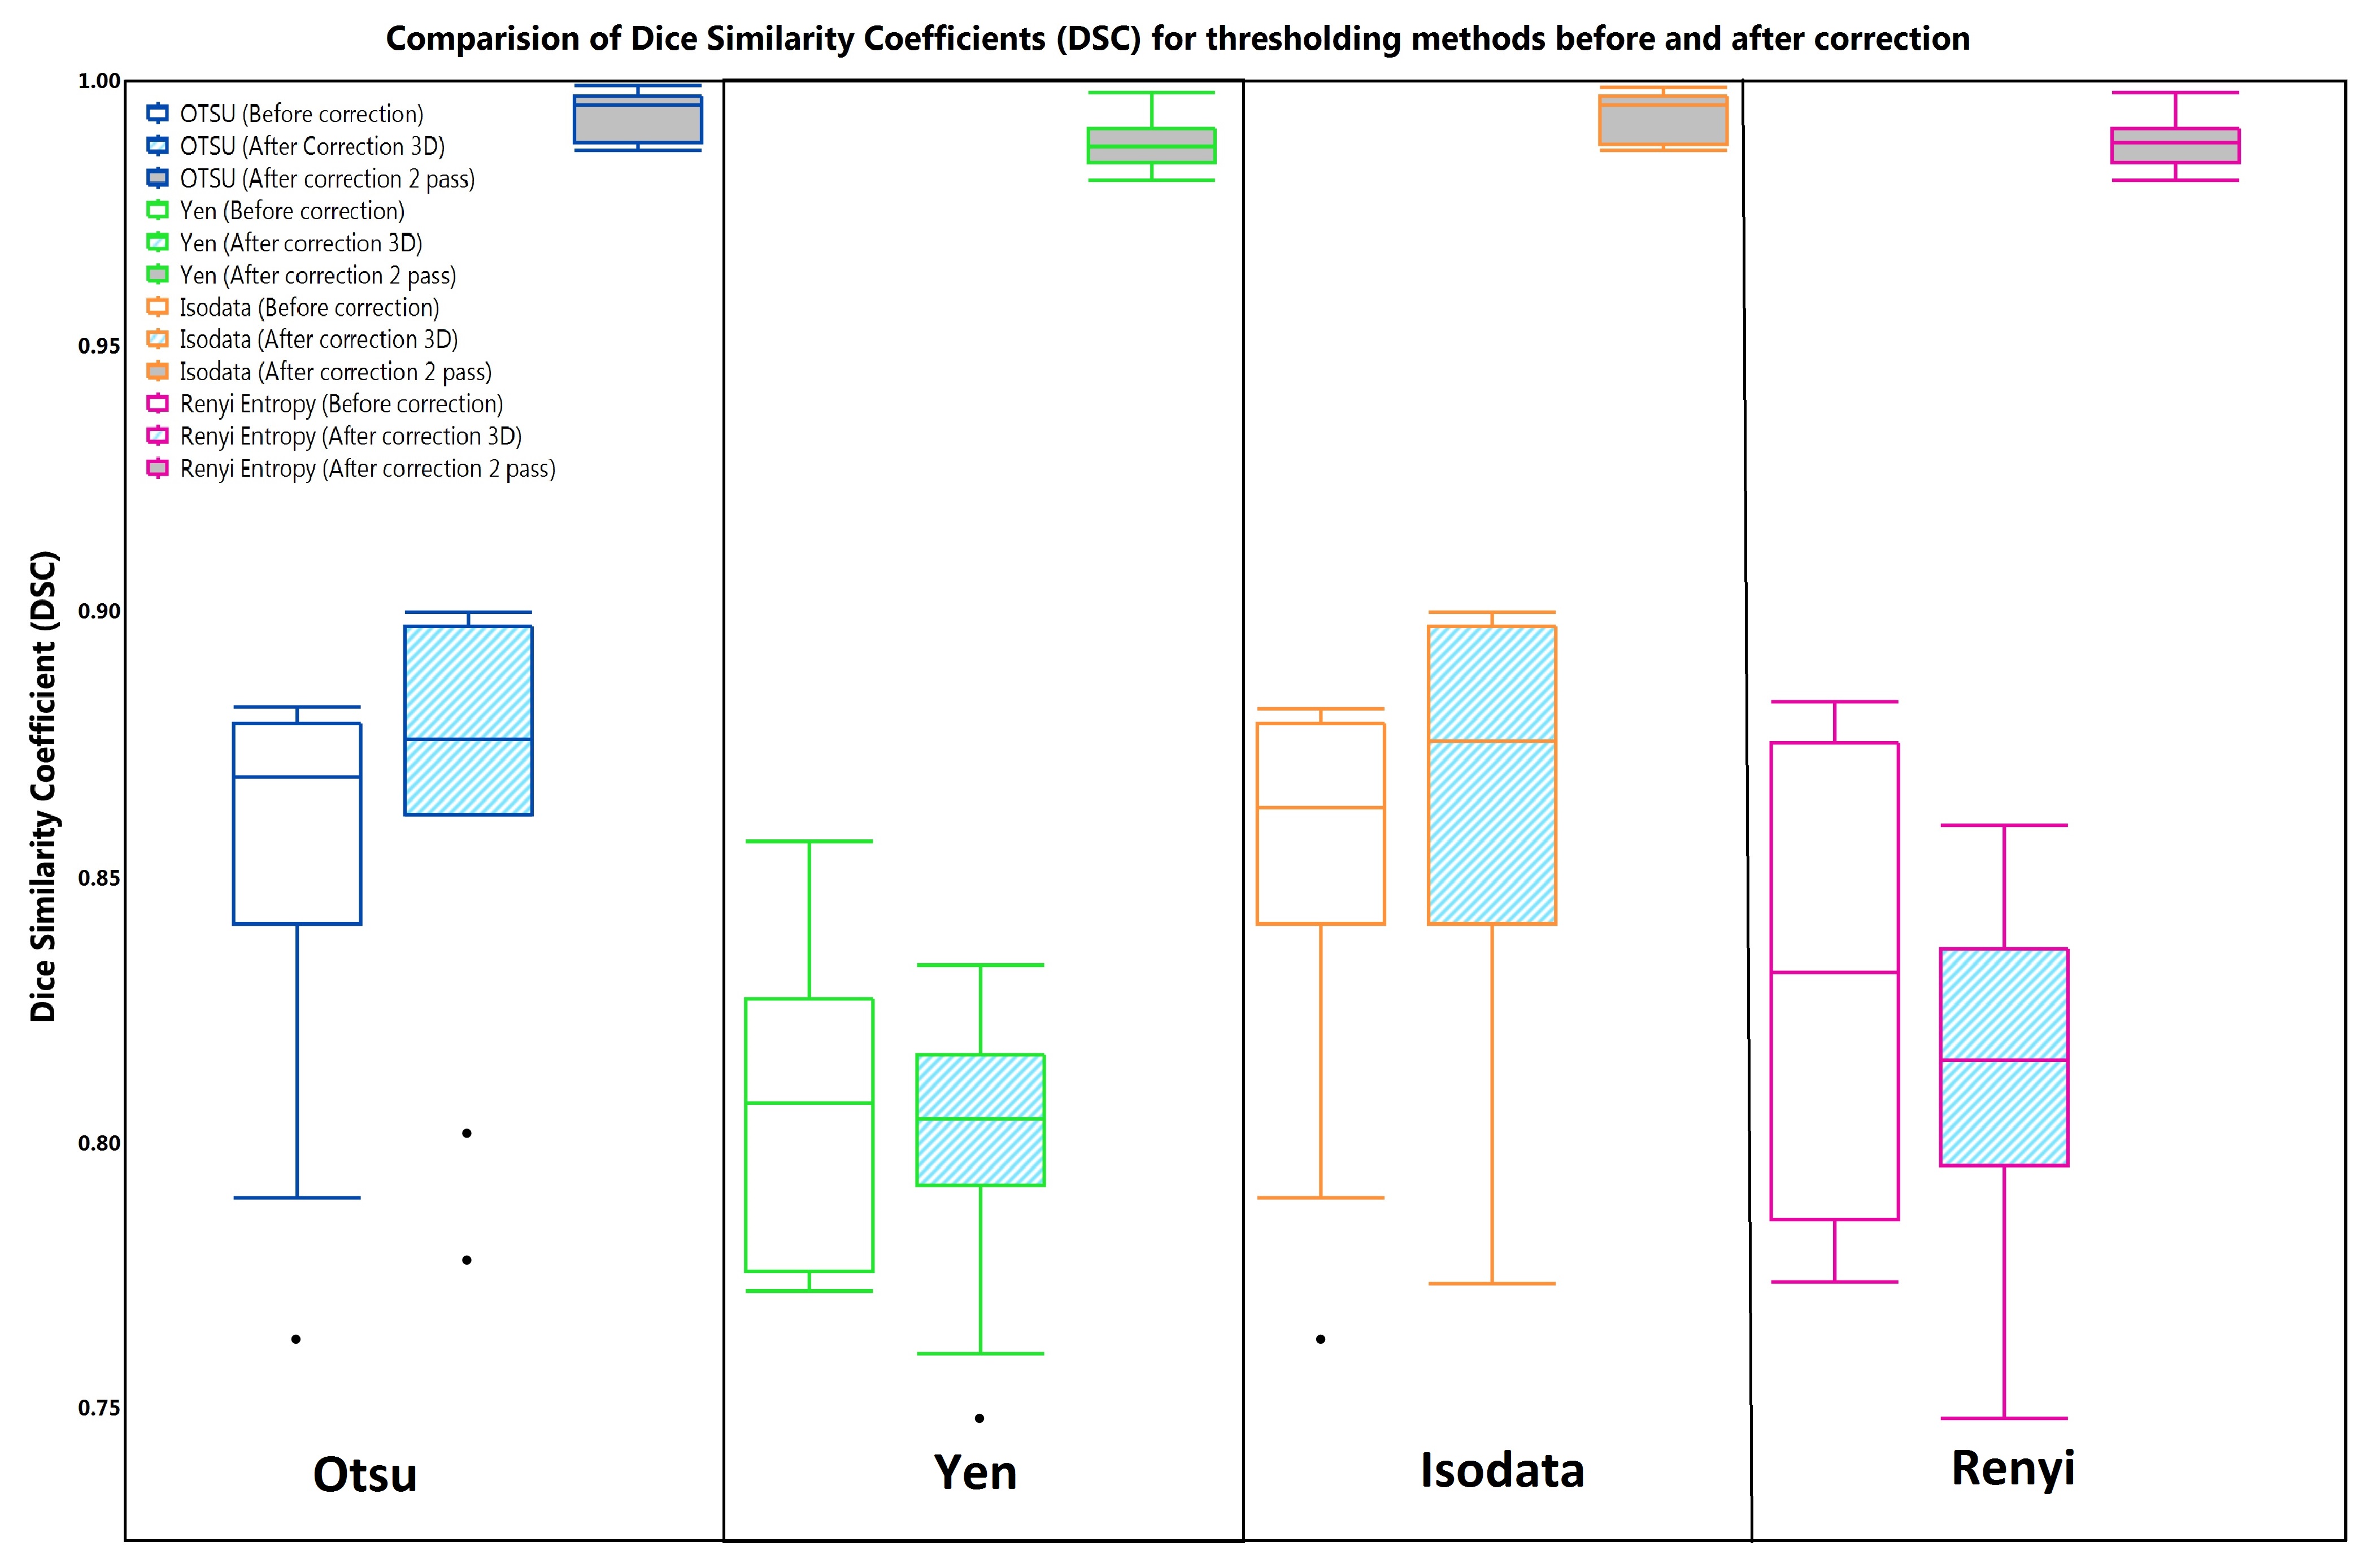
Histograms of image volume before and after correction (Fig 2) indicated the decreased dispersion of intensity values for fat tissue in Dixon MRI images. Results of bias field estimation, correction and partition matrix (ground truth) for a sample slice is shown in Figure-2. Dice similarity coefficients were computed for each segmentation method without and with intensity correction. Boxplot analysis of DSCs for each segmentation method is represented in Figure-3 . The student T-test (one variable, one tail and unequal variance) between DSCs of before and after intensity correction showed the significance (p < 0.05) indicating a significant improvement in DSC due to intensity correction. Higher variance of DSC was observed in uncorrected and 3D based correction techniques whereas 2-pass BFCM gave better results.
Conclusion:
Biased Fuzzy C means algorithm1 improves the consistency of intensity distribution across different classes. Two-pass BFCM in which both intra-slice and inter-slice corrections was made gave significant improvement in terms of reduction of variance and increased DSC. The study shows 2-pass i.e. intra-slice and inter-slice based correction has better results than single-pass 3D correction. BFCM based intensity inhomogeneity correction is a promising technique for bias field estimation, intensity normalization and improvement of segmentation quality.We will explore usefulness and efficiency of BFCM for other MR sequences and other body parts in our future studies.
Acknowledgements
No acknowledgement found.References
1. Ahmed, Mohamed N., et al. (2002), IEEE Trans on medical imaging 21.3: 193-199.
2. Nobuyuki Otsu (1979), IEEE Trans. Sys., Man., Cyber. 9 (1): 62–66.
3. Ridler TW et al. (1978), IEEE Transactions on Systems, Man and Cybernetics 8: 630-632
4. Kapur JN et al. (1985), Graphical Models and Image Processing 29(3): 273-285
5. Yen JC et al. (1995), IEEE Trans. on Image Processing 4 (3): 370-378
6. SA Sadananthan et al. (2015) JMRI 41 (4), 924-934
7. Zou et al. Acad Radiol. 2004 Feb; 11(2): 178–189.
Figures