5201
Quantitative Cardiac B0, Fat Fraction, and R2* Mapping using Pre-Channel-Combination Phase Processing1Biomedical Engineering Graduate Program, University of Western Ontario, London, ON, Canada, 2Imaging Research Laboratories, Robarts Research Institute, London, ON, Canada, 3Department of Medical Biophysics, University of Western Ontario, London, ON, Canada
Synopsis
Multi-echo gradient echo MR imaging enables the generation of quantitative B0, fat fraction and R2* maps, from which tissue can be characterized. When applied to cardiac imaging these methods face the challenge presented due to the large susceptibility differences between lung and heart. We present a novel post-processing pipeline for multi-echo GRE phase images that processes the phase data prior to channel combination to enable generation of robust quantitative cardiac maps enabling accurate tissue visualization and characterization.
Introduction
Multi-echo gradient echo (GRE) imaging enables the generation of quantitative maps such as B0, fat fraction (FF),1 R2*,2 local frequency shift and quantitative susceptibility maps. Quantitative GRE imaging requires accurate phase data and its application to cardiac imaging faces challenges due to cardiac and respiratory motion. Additional corruption of the phase signal is caused by the large phase gradients at the interface of the heart and lungs. It has been demonstrated in recent work that channel-by-channel processing of MR phase data prior to channel combination results in the preservation of detailed information about underlying tissue.3 In this work, we present a novel pipeline for processing multi-echo GRE cardiac phase images in order to generate quantitative B0, fat fraction, and R2* maps and evaluate its performance in maintaining cardiac tissue signal in challenging anatomical regions.Methods
Imaging: Image acquisition was performed in accordance with our institute’s Research Ethics Board. Three male volunteers were scanned with a dark blood multi-slice four-echo GRE sequence using a 34-channel transmit/receive coil on a 3T scanner. Fifteen breath-held short axis stack (SAX) and a single 2-chamber long axis stack (LAX) were acquired for each volunteer. The imaging parameters for both prescriptions were as follows: TE1/ESP/TR: 2.33/1.27/940 ms; resolution: 1.2x1.2x6.0 mm3; GRAPPA R=2; 9 segments; BW 1150 Hz/pixel. Additionally the SAX scans were repeated with a slice thickness of 3.5-mm. Image processing: Individual channel data, reconstructed by the scanner using GRAPPA, were saved for offline post-processing. First, channel images were corrected for phase errors due to the application of bipolar gradients during acquisition.4 The corrected images were processed with a non-iterative B0-mapping technique, which allows for simultaneous calculation of B0-, FF-, and R2*-maps.5 The individual channel maps were combined using the channel magnitude images for weighting. Channel combination was performed both with data from all coils in the array and by including only data from coils with high signal-to-noise ratio (SNR) in the region of the heart. For comparison, adaptive channel combination5 was also performed and the same B0-mapping algorithm was applied to the combined phase images.Results
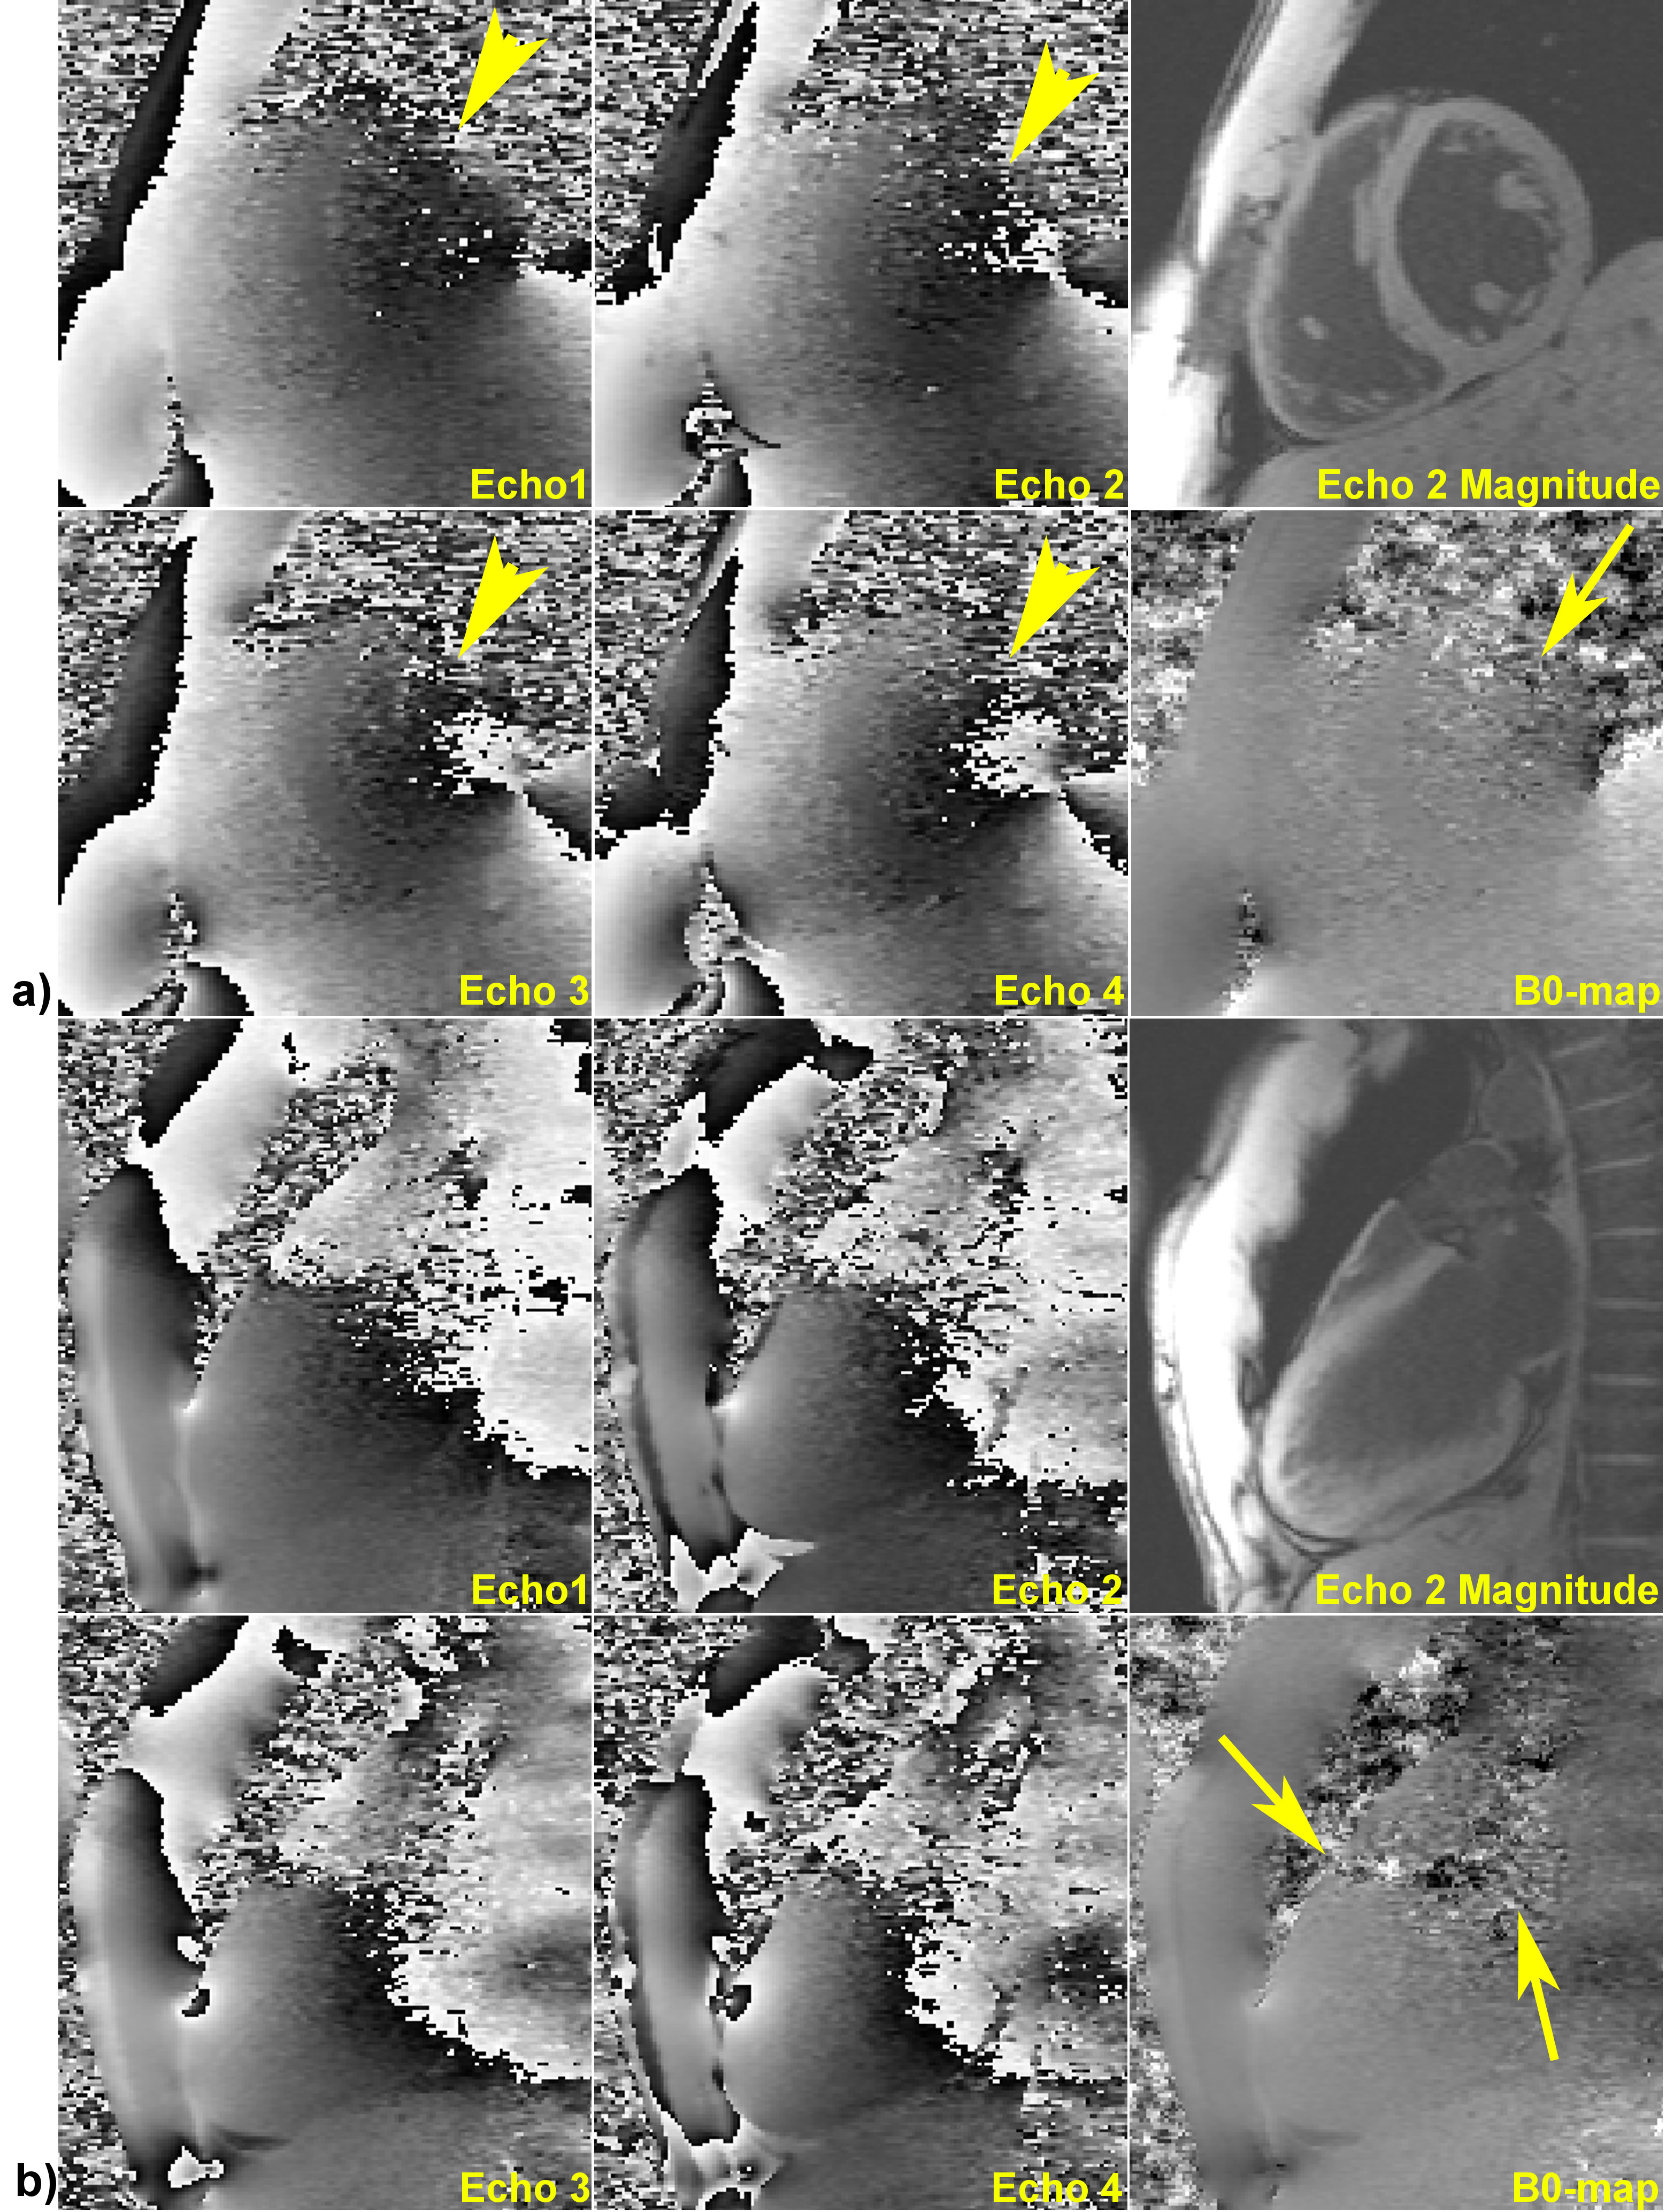
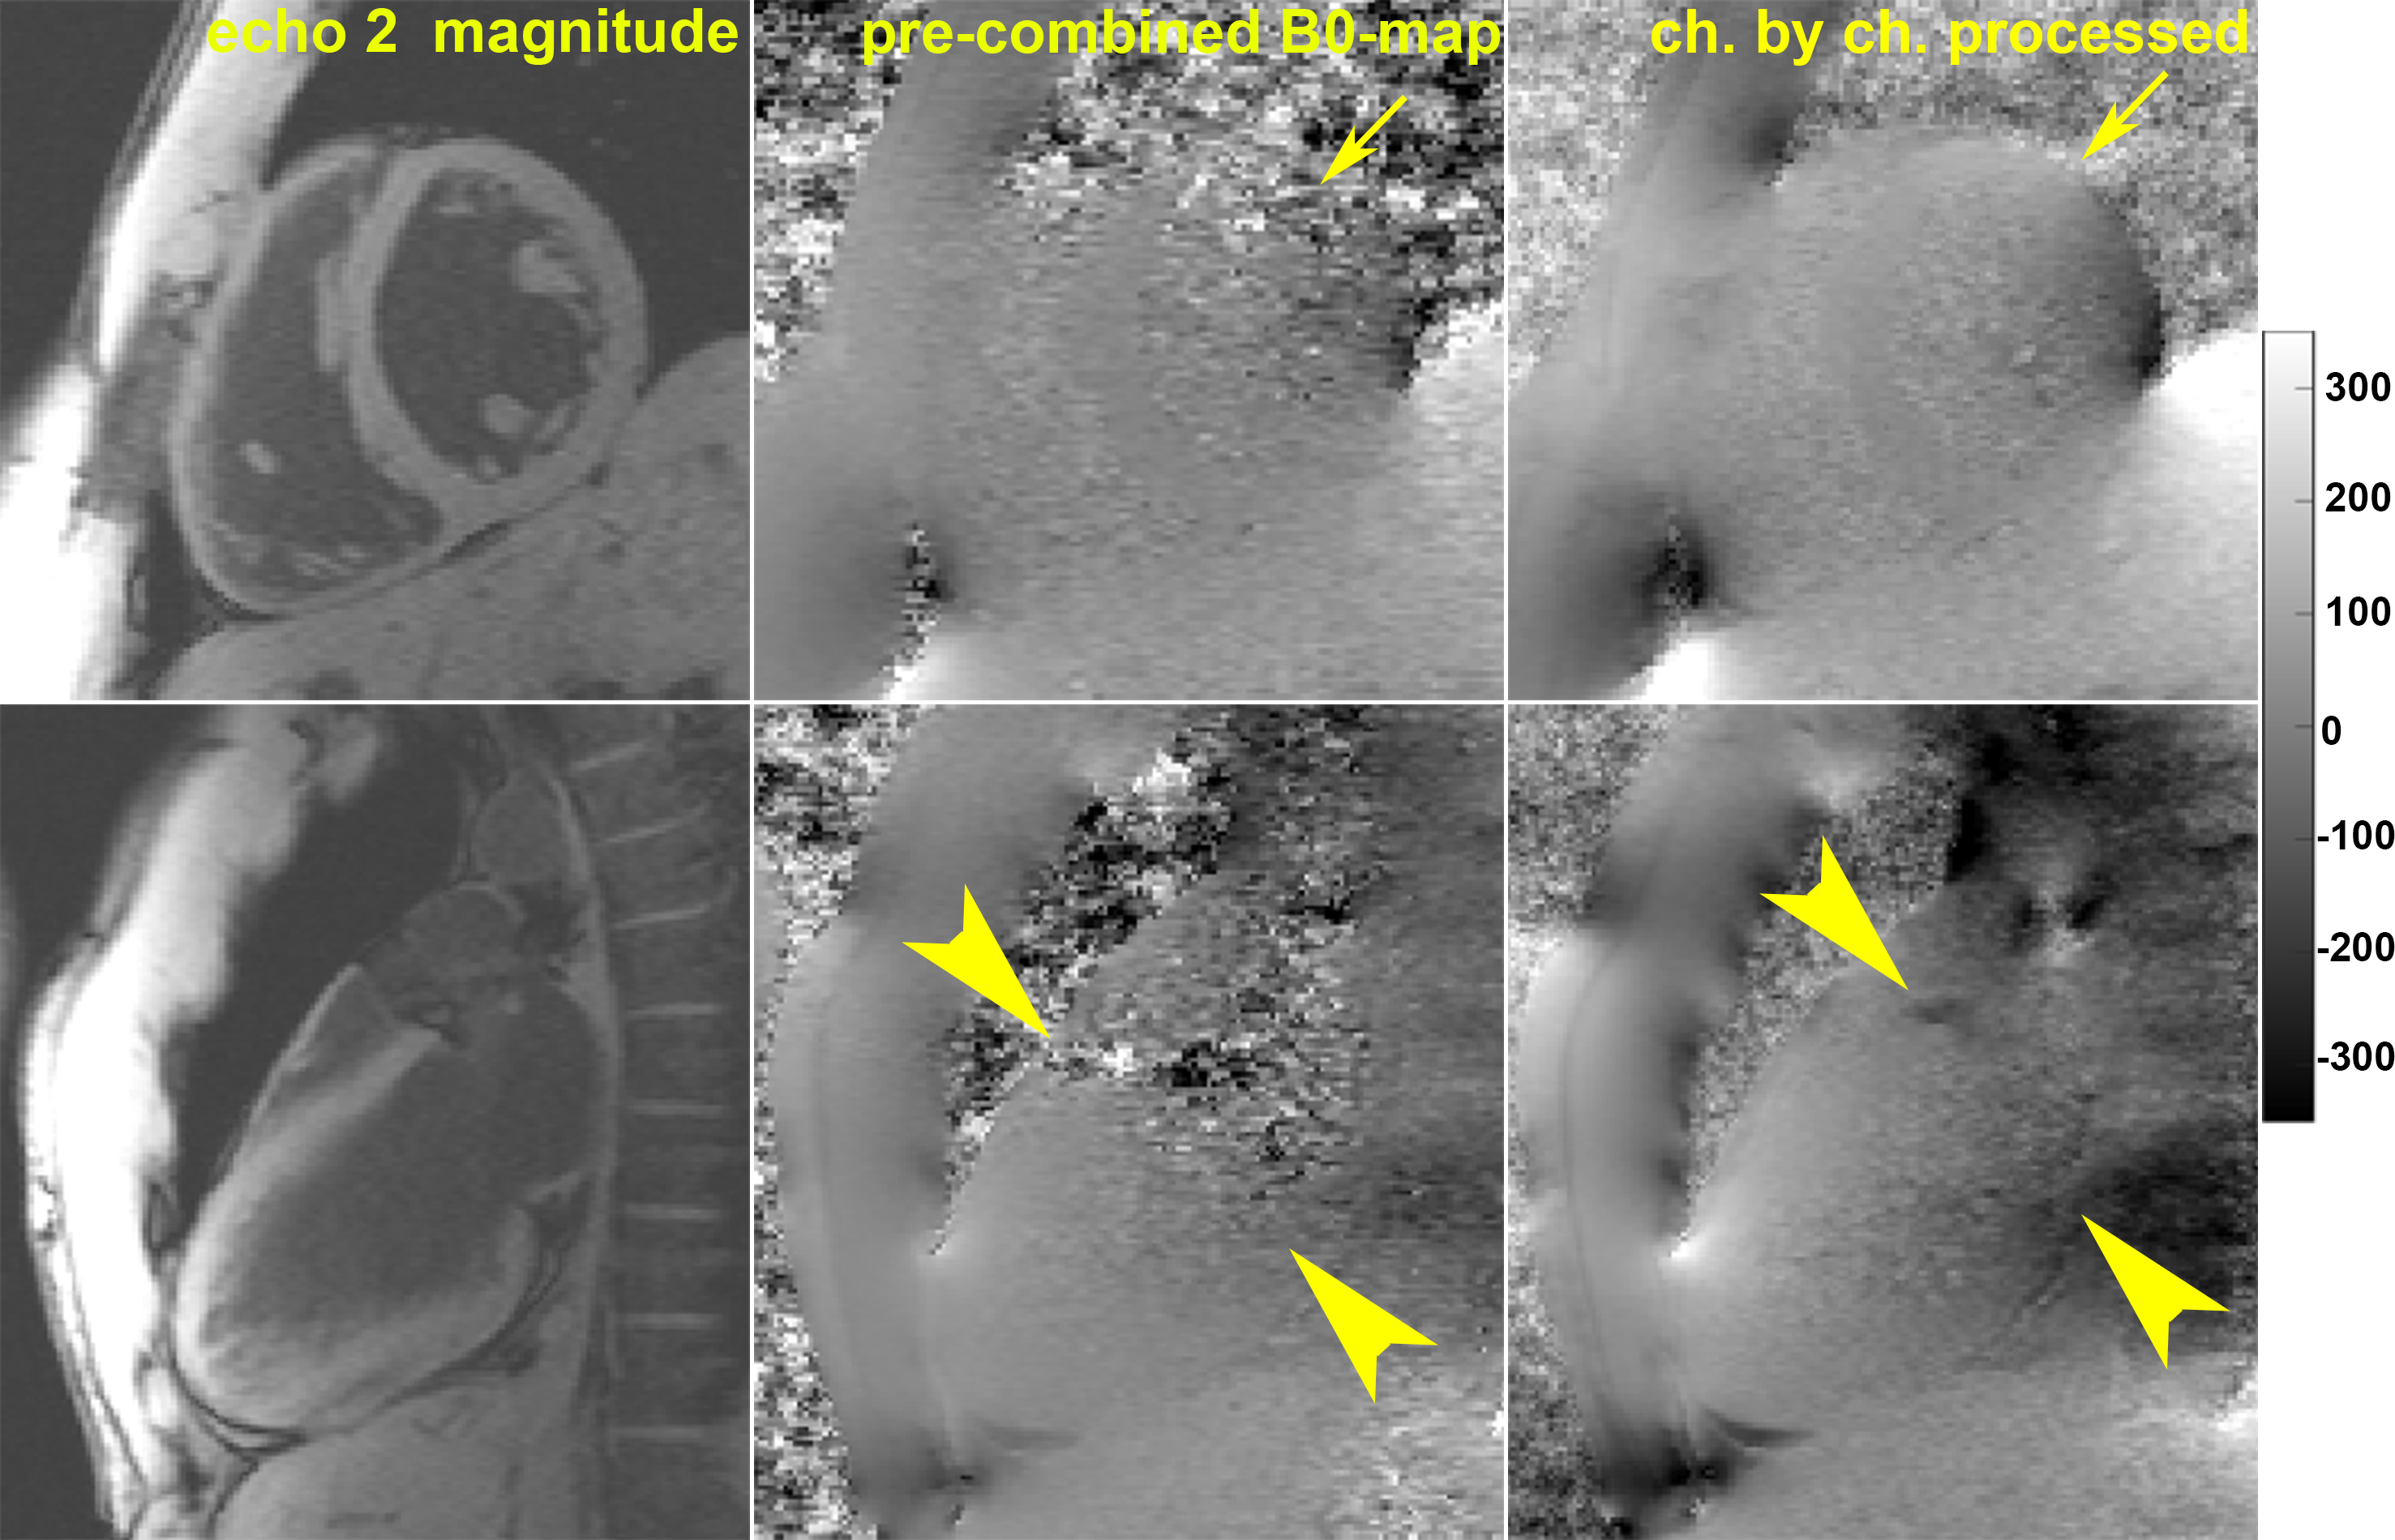
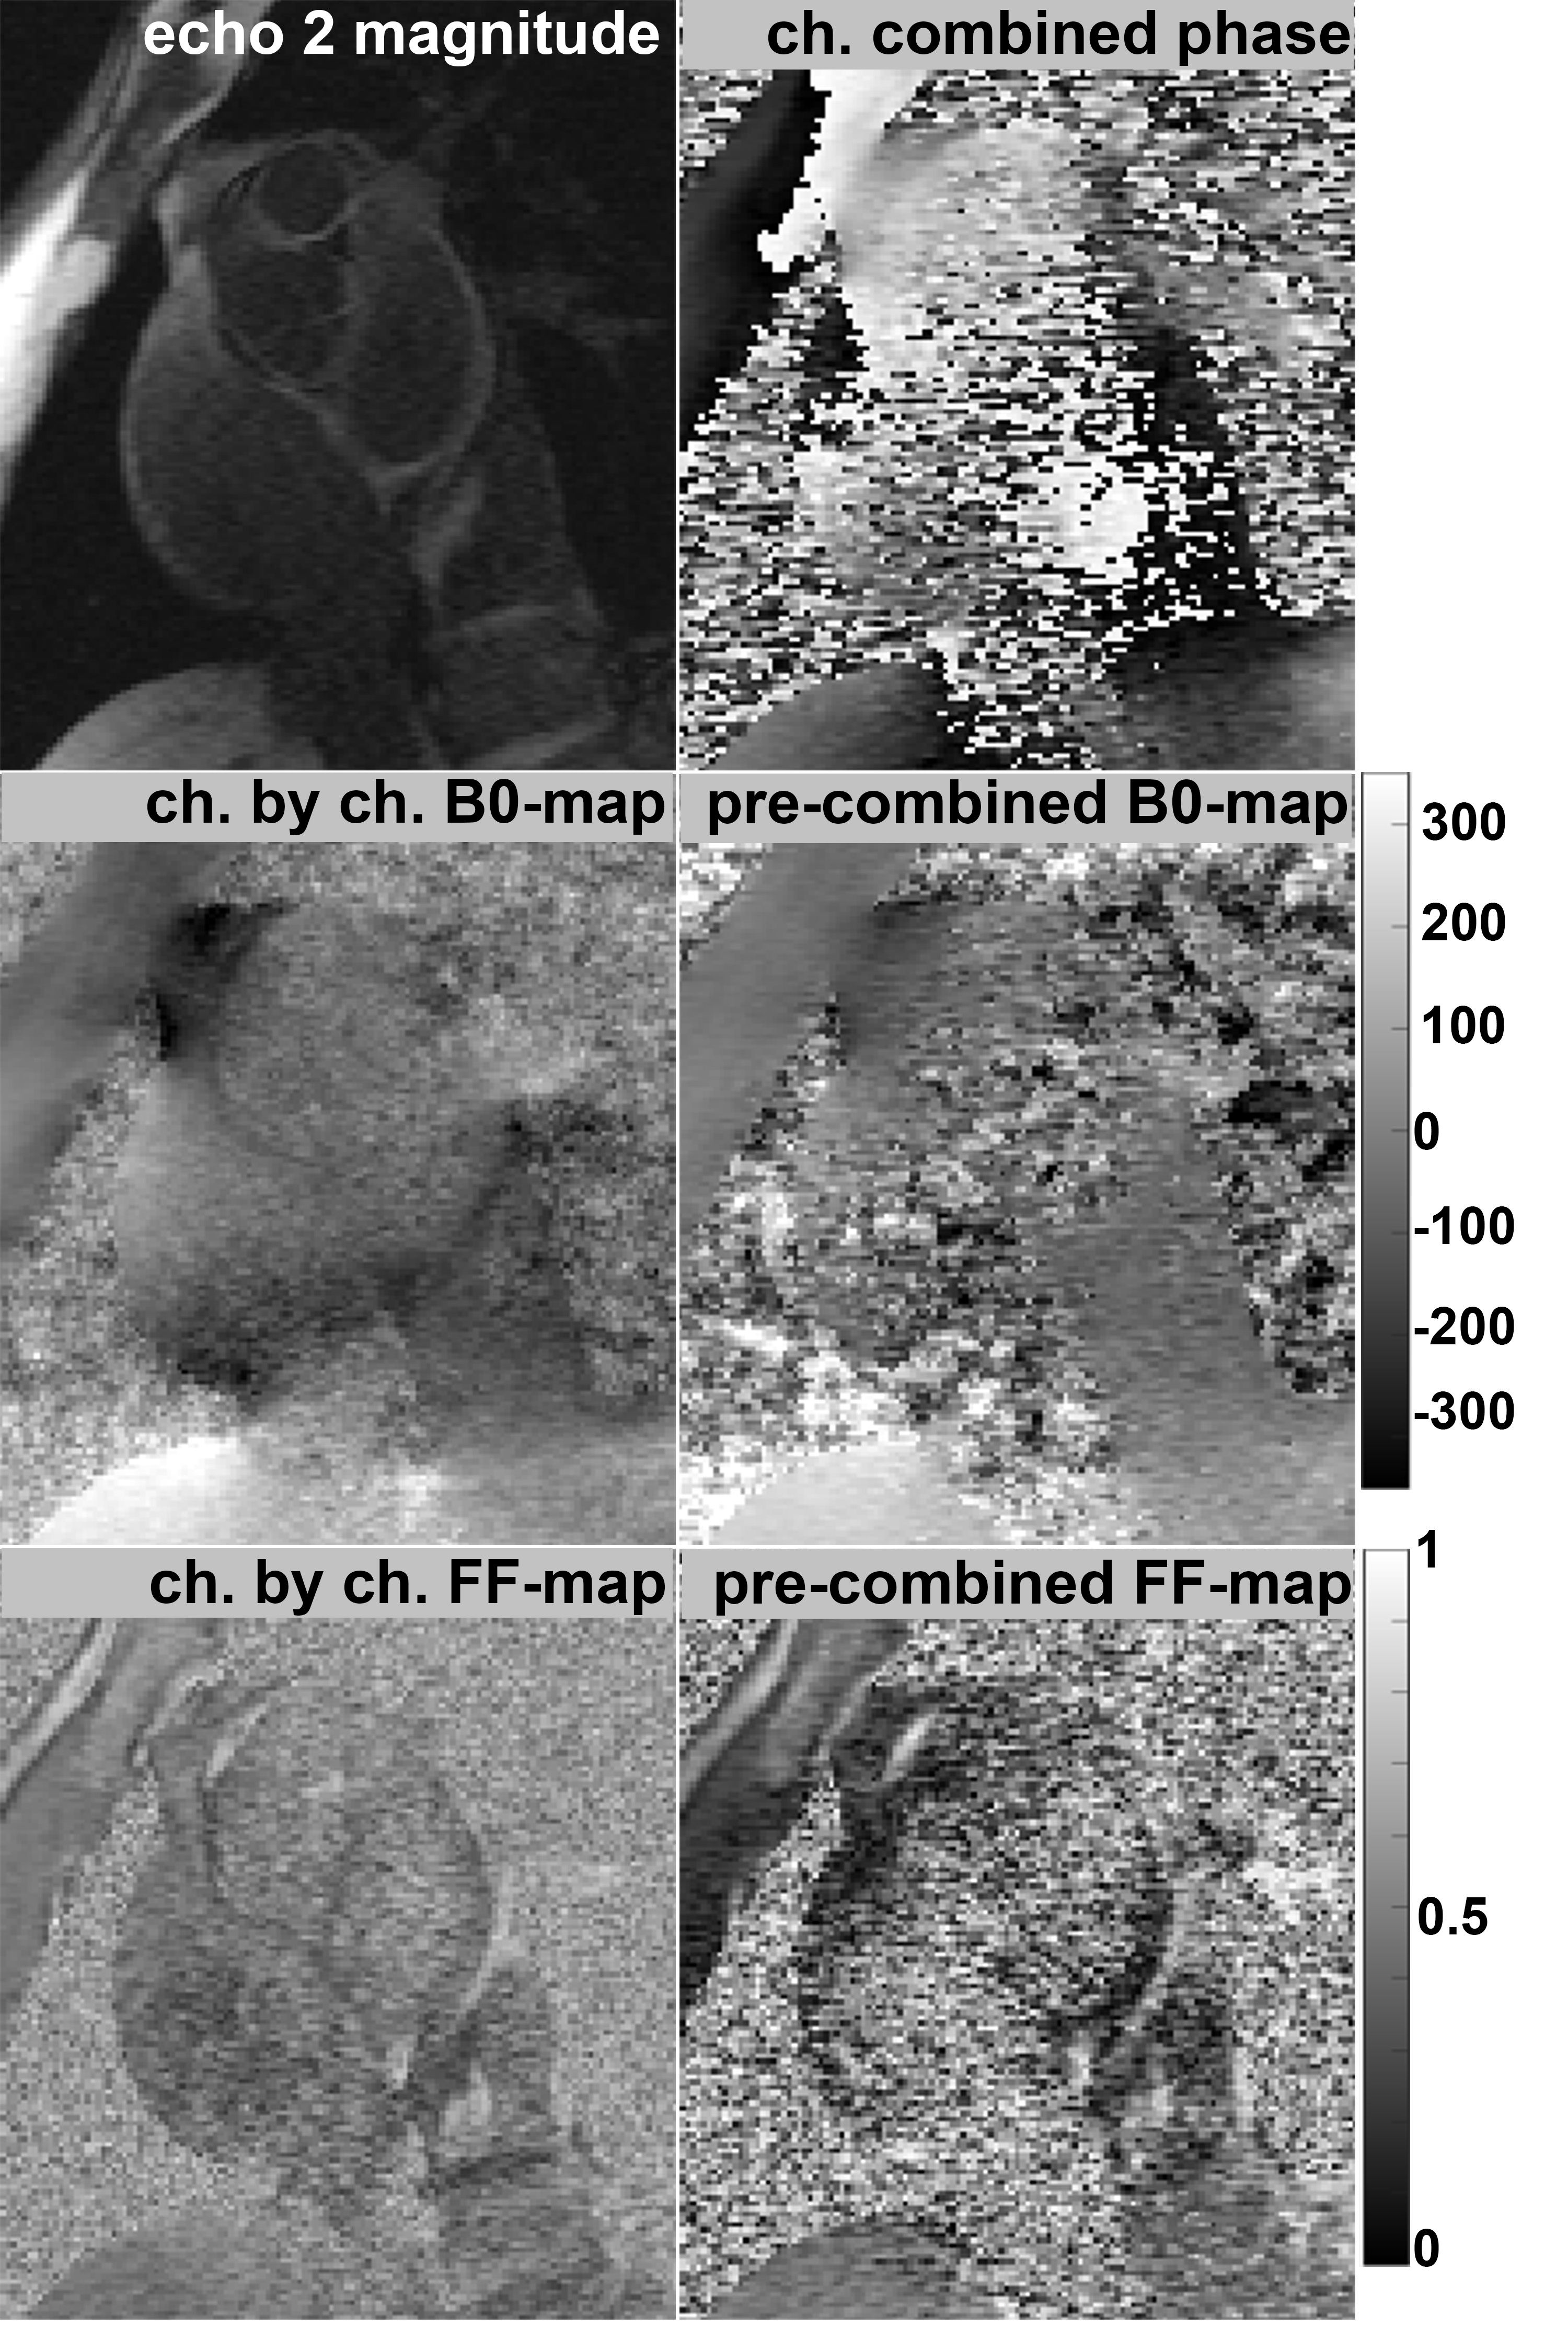
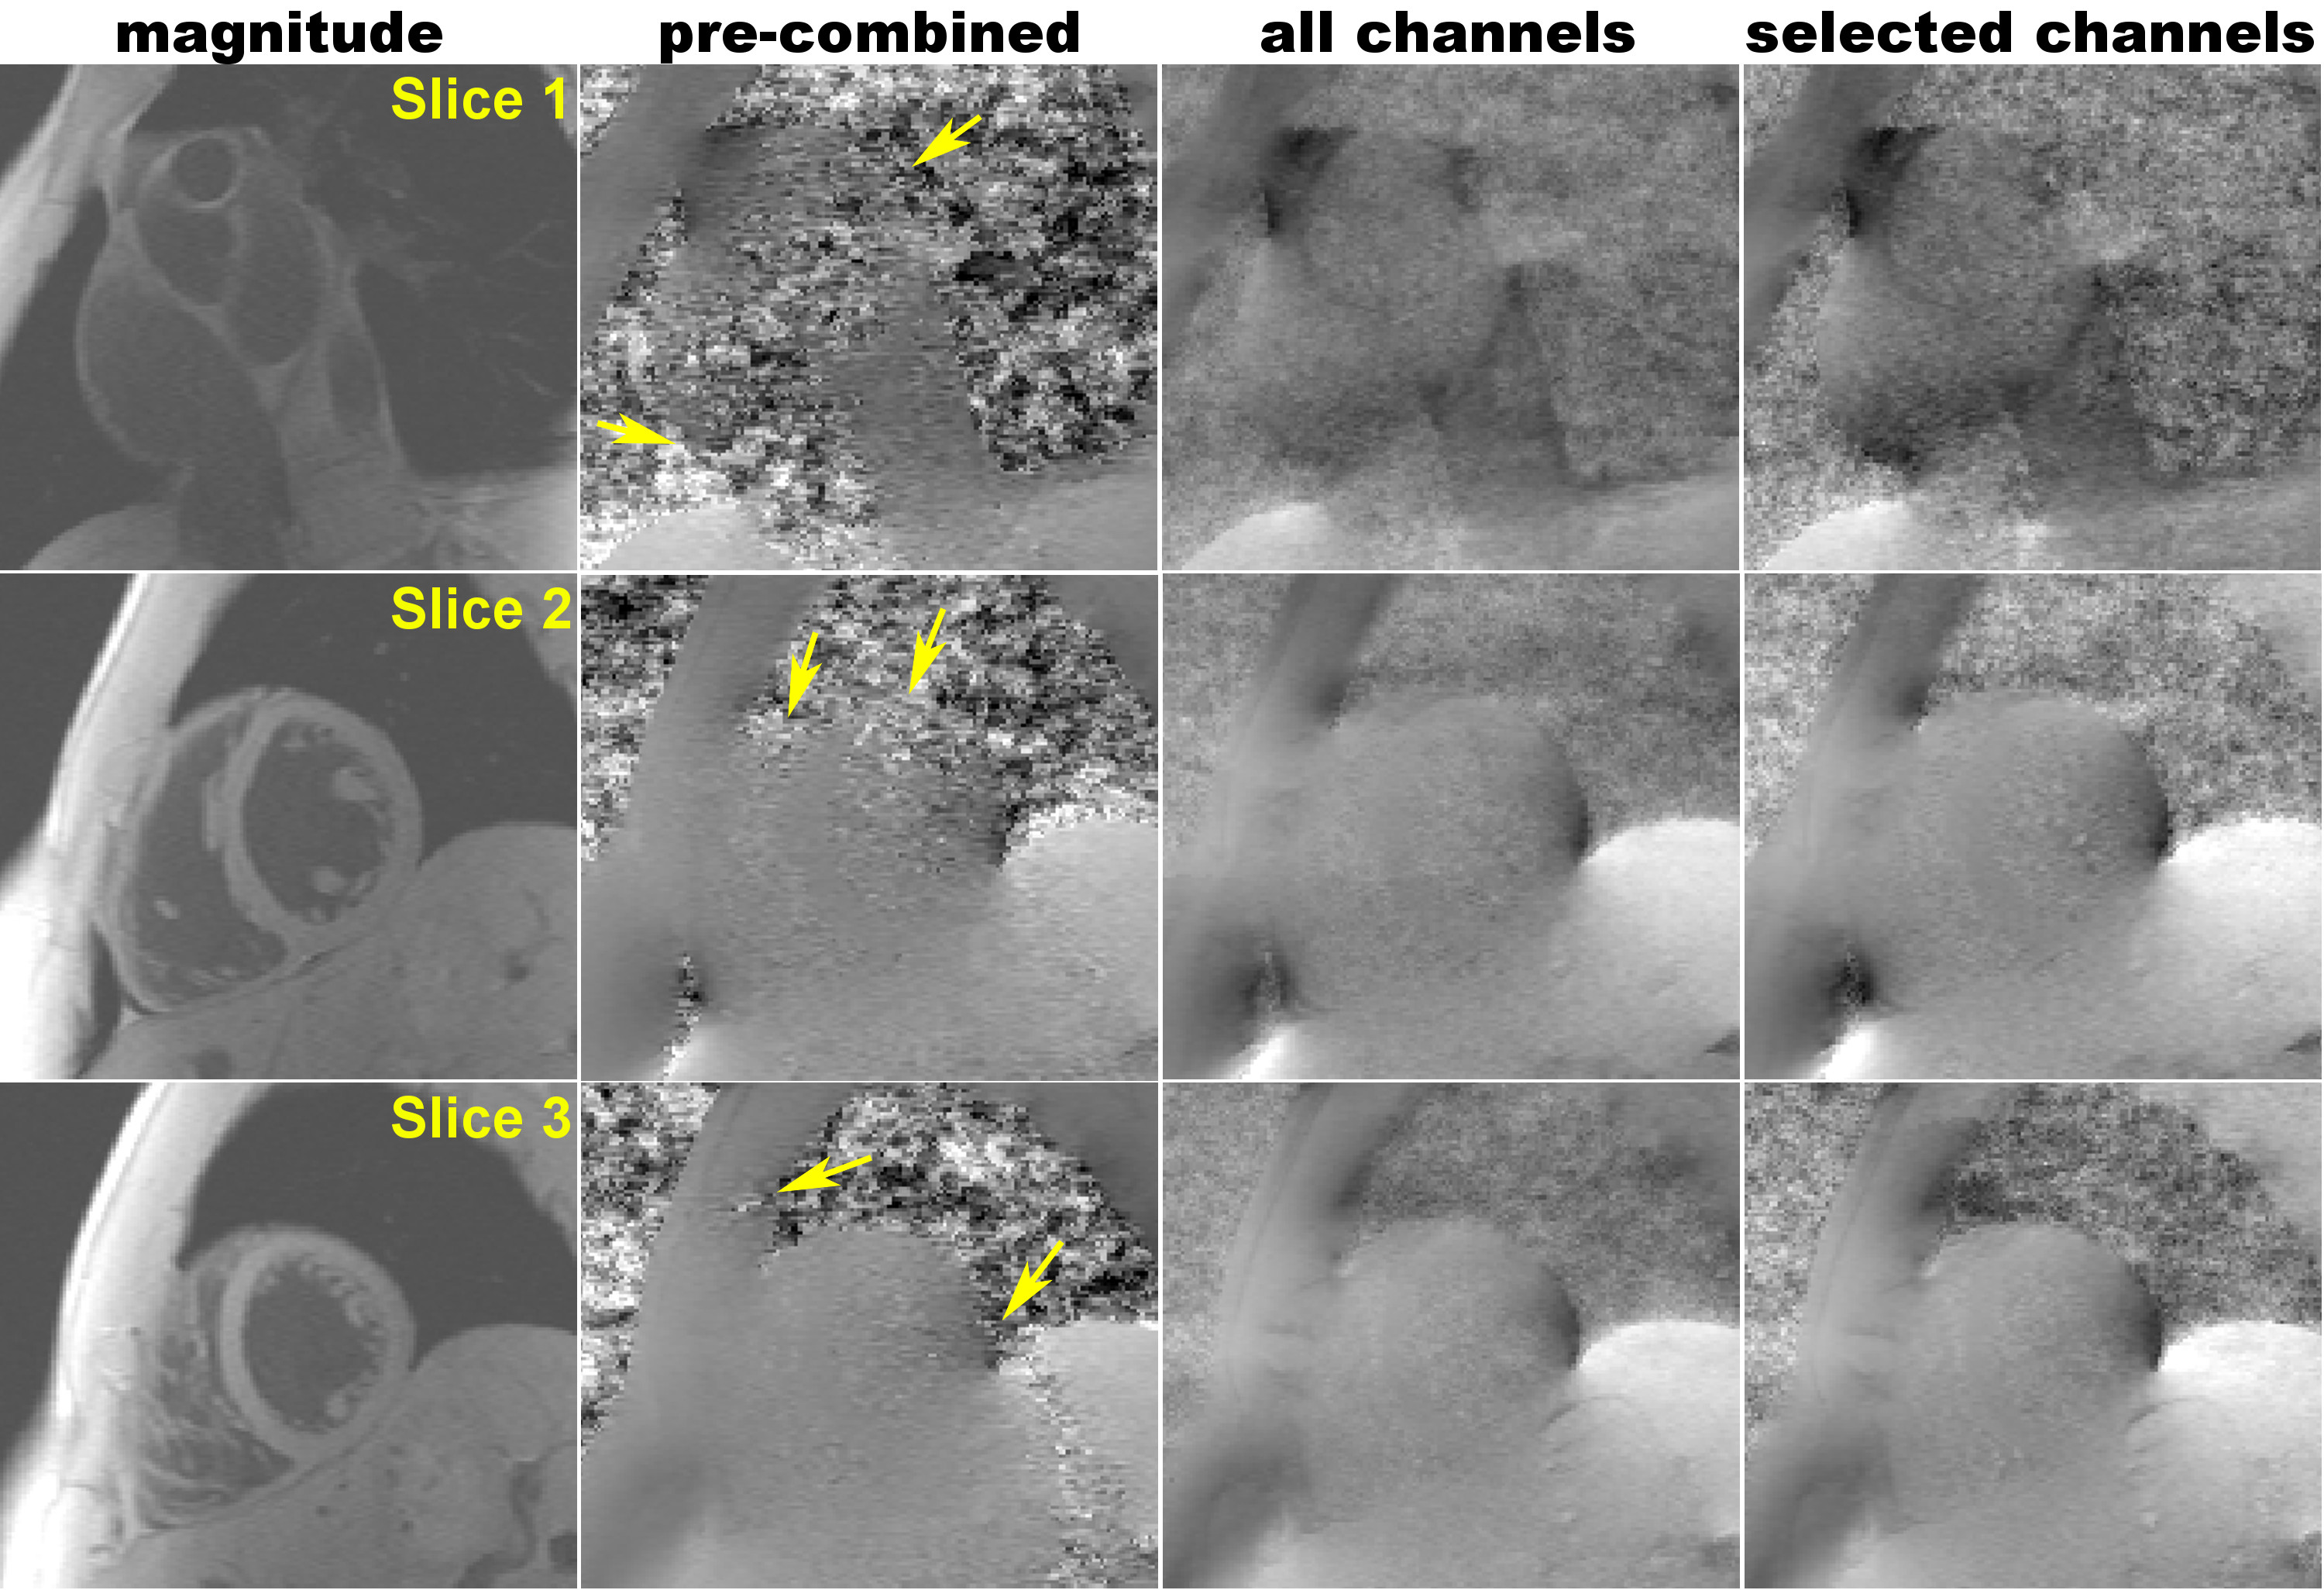
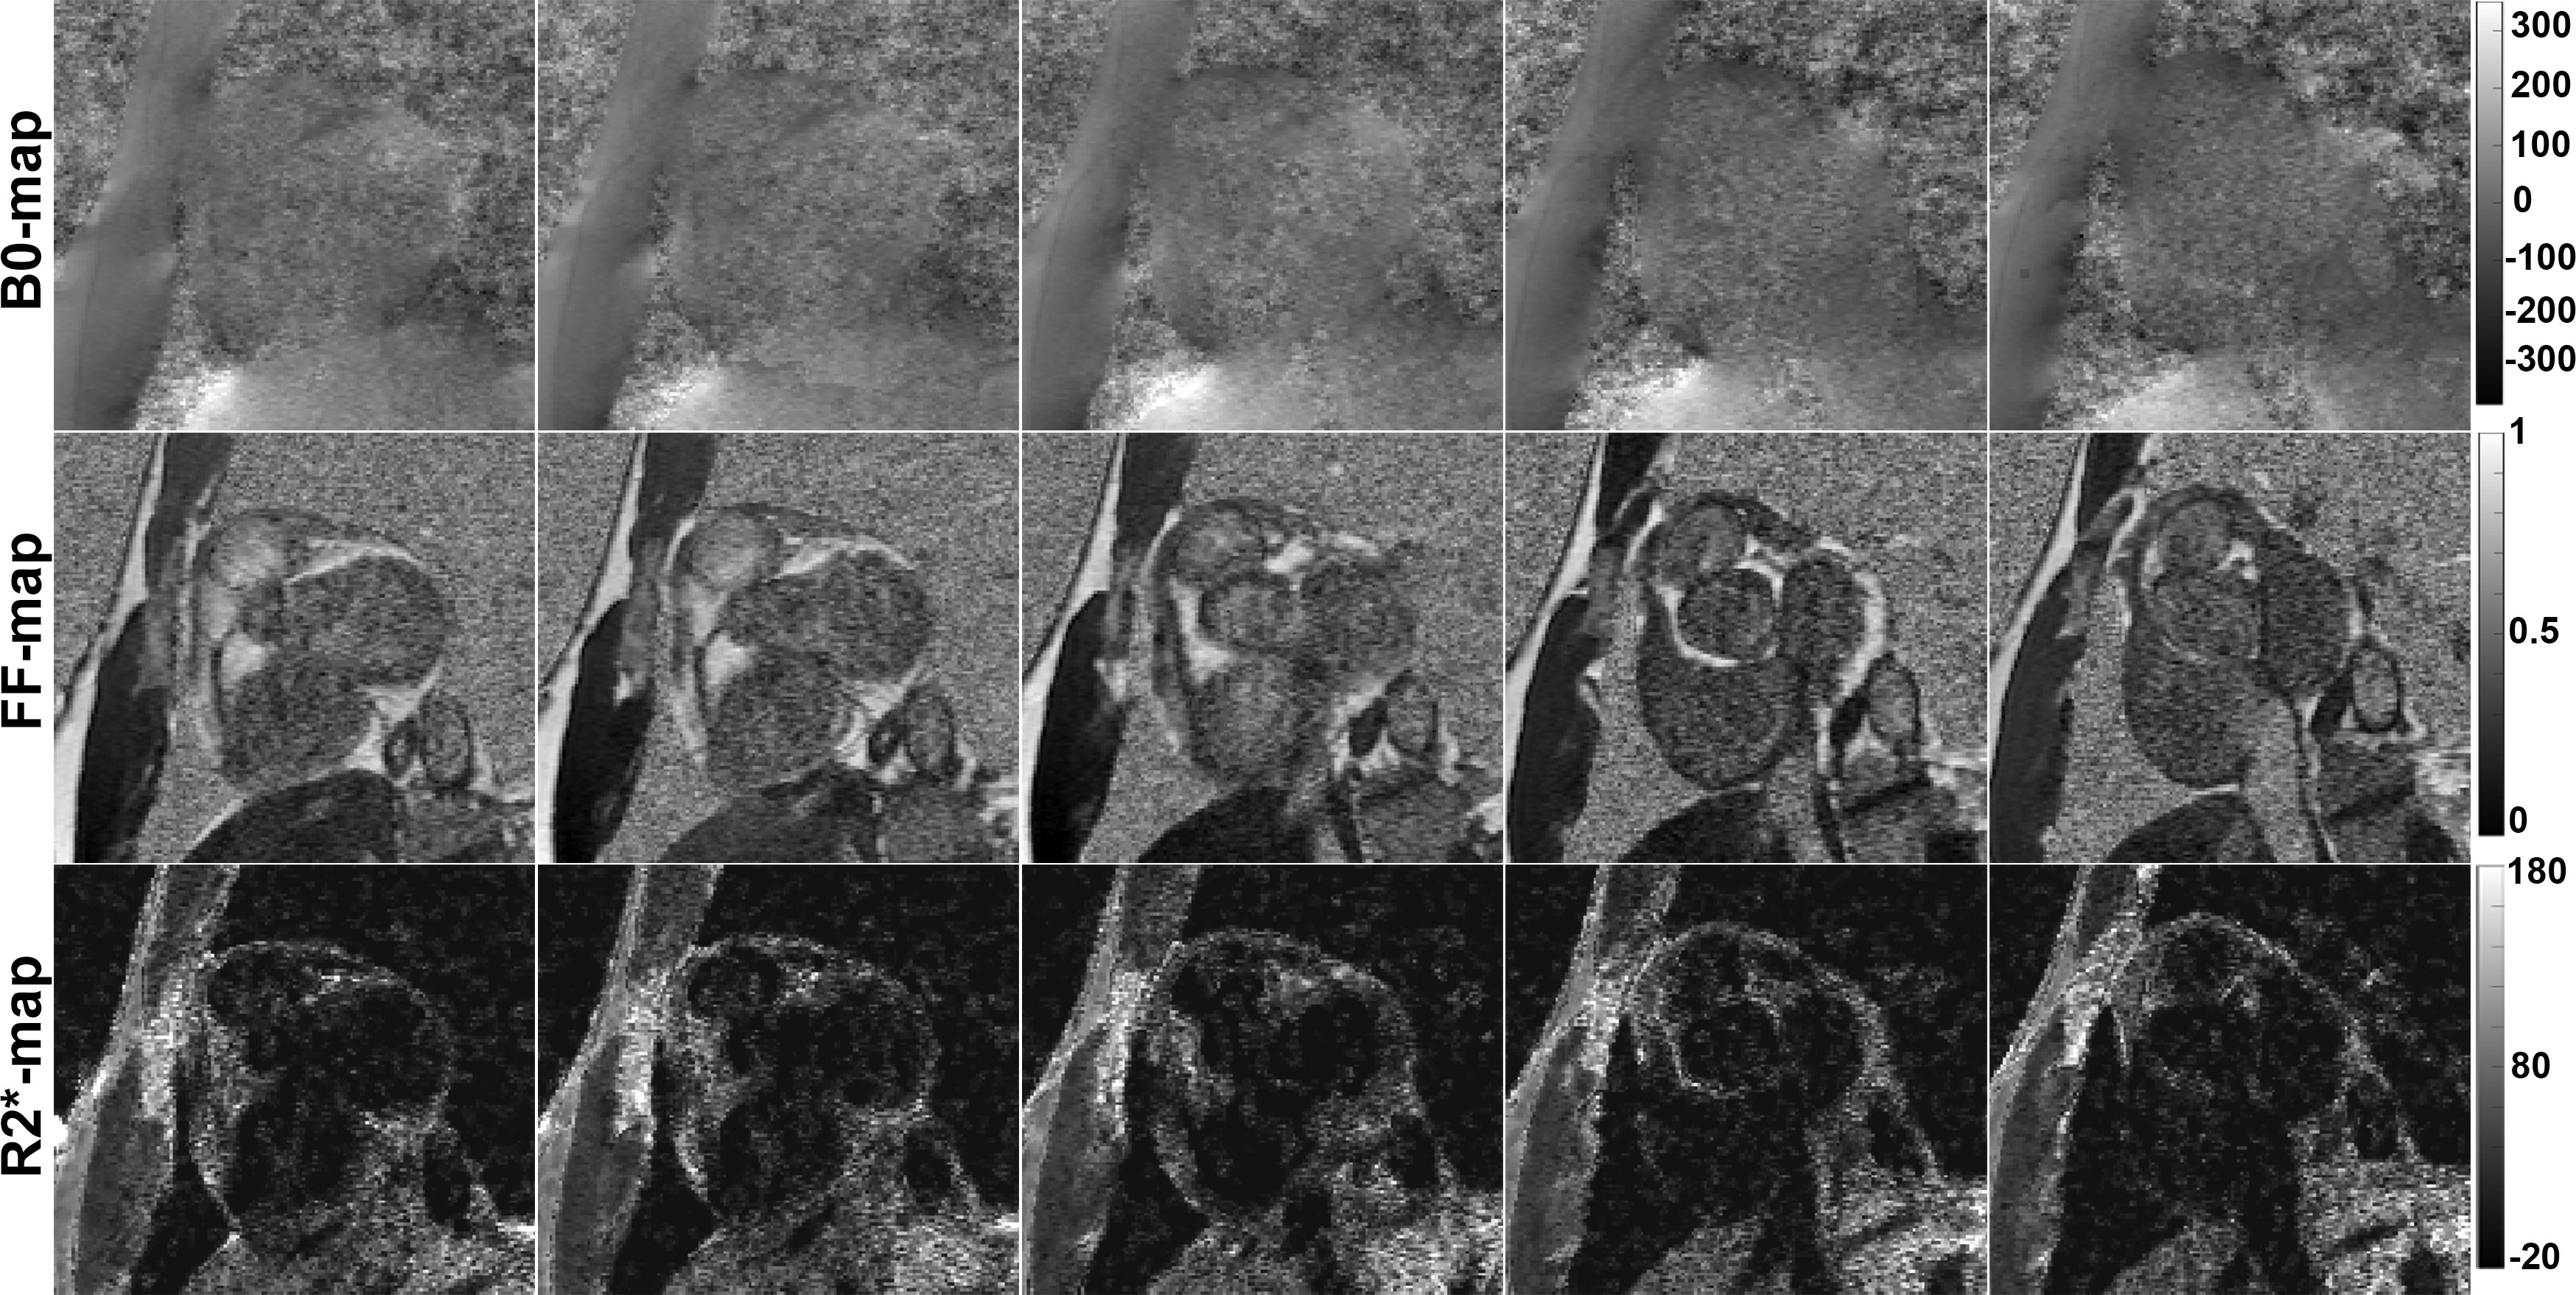
High quality quantitative maps were generated for all three volunteers using the channel-by-channel processing pipeline. In contrast, B0-maps calculated from the pre-combined phase images were consistently corrupted due to susceptibility artifacts present in the original combined phase images. Figure 1 demonstrates this problem by showing the phase images at four echo times along with the resulting field map – signal at the base of the heart near the heart/lung interface is clear. A comparison between the B0-maps resulting from the pre-combined phase data and from the presented channel-by-channel processing pipeline are shown in Fig. 2. It is clearly seen that the myocardium signal near the heart/lung interface is spared when the B0-maps are calculated prior to channel combination. Additional evidence of the robustness of the proposed processing pipeline is provided in Fig. 3, which compares B0- and FF-maps of a slice through the aortic valve and atria. The significant signal recovery from channel-by-channel processing pipeline enables characterization of the atrial wall and vessel visualization. Figure 4 presents additional examples illustrating the significant improvement in the signal quality using the proposed method as compared to processing the pre-combined phase data. This figure also shows that there is minimal improvement when selectively combining data from the coils with high cardiac SNR, rendering magnitude-weighting a robust method of channel-combination in this pipeline. Finally Fig. 5 shows the robust performance of the processing algorithm across five consecutive image slices acquired with 3.5-mm thickness.Discussion and Significance
We presented a novel method of processing cardiac MR phase images to extract B0, FF, and R2* maps. The robustness of the technique is demonstrated through the results, which clearly show that significant amount of information can be lost by early channel combination. Cardiac magnetic resonance imaging is often performed at 1.5T to avoid field inhomogeneity-related artifacts.6-8 This work demonstrate the ability to obtain high quality quantitative maps from a readily available multi-echo imaging sequence at 3T by utilizing a post-processing technique optimized for cardiac imaging and applied on a channel-by-channel basis. The proposed processing pipeline can easily be translated to images acquired 1.5T and similar or even better results are expected. The limitation of this technique is the increased time required for processing data from multiple channels. Parallel computing can be used to reduce processing time dramatically in case of a non-iterative B0-mapping algorithm, such as that used here.5 Future work will include evaluating the efficacy of this processing pipeline to characterizing cardiac tissue in a cohort of patients.Acknowledgements
Z.H. acknowledges the Ontario Graduate Scholarship for funding her research. M.D. is a career investigator of the Heart and Stroke Foundation. M.D. is partially funded by the Ontario Research Fund. Authors acknowledge Trevor Szekeres for assisting with imaging acquisition.References
1. Reeder SB, McKenzie CA, Pineda AR, et al. Water-fat separation with IDEAL gradient-echo imaging. J Magn Reson Imaging 2007;25(3):644-652.
2. Yu H, McKenzie CA, Shimakawa A, et al. Multiecho reconstruction for simultaneous water-fat decomposition and T2* estimation. J Magn Reson Imaging 2007;26(4):1153-1161.
3. Hosseini Z, Liu J, Solovey I, et al. Susceptibility-weighted imaging using inter-echo-variance channel combination for improved contrast at 7 tesla. J Magn Reson Imaging 2016.
4. Peterson P, Mansson S. Fat quantification using multiecho sequences with bipolar gradients: investigation of accuracy and noise performance. Magn Reson Med 2014;71(1):219-229.
5. Liu J, Drangova M. Method for B0 off-resonance mapping by non-iterative correction of phase-errors (B0-NICE). Magn Reson Med 2015;74(4):1177-1188.
6. Atakay MK, Poncelet BP, Kantor HL, et al. Cardiac Susceptibility Artifacts Arising From the Heart-Lung Interface. Magn Reson Med 2001;45:341-345.
7. Storey P, Thompson AA, Carqueville CL, et al. R2* imaging of transfusional iron burden at 3T and comparison with 1.5T. J Magn Reson Imaging 2007;25(3):540-547.
8. Zaman A, Higgins DM, Motwani M, et al. Robust myocardial T2 and T2 * mapping at 3T using image-based shimming. J Magn Reson Imaging 2015;41(4):1013-1020.
Figures