5199
Measurement of spleen fat on MRI-proton density fat fraction arises from reconstruction of noise1Liver Imaging Group, Department of Radiology, University of California, San Diego, San Diego, CA, United States, 2Department of Pediatrics, Division of Pediatric Gastroenterology, Rady Children's Hospital, San Diego, CA, United States, 3Departments of Radiology, Medical Physics, Biomedical Engineering, Medicine, and Emergency Medicine, University of Wisconsin, Madison, Madison, WI, United States
Synopsis
Non-zero proton density fat fraction (PDFF) is commonly observed in the spleen on chemical-shift-encoded MRI. A prospective assessment in 42 research subjects with no visible fat peaks on MR spectroscopy demonstrated small amounts of splenic fat (PDFF up to 4%) using four different MRI-based fat fraction estimation techniques. These measurements were poorly correlated with each other, implying that fat measurements in spleen are likely artifactual rather than representing true splenic fat.
Introduction
Chemical shift-encoded (CSE) MRI is an accurate method for the non-invasive in vivo measurement of proton density fat fraction (PDFF) 1–3. The spleen is known to have no detectable fat histologically except in exceptionally rare disorders and assumed to have no MR visible fat. For these reasons, it is sometimes used as a reference standard for calibration 1. Anecdotally, however, we have observed spleen CSE-MRI-PDFF values ( > 4%) higher than expected from noise. The purpose of this study is to describe splenic CSE-MRI-PDFF values in human subjects with MRS-verified absence of splenic fat.Methods
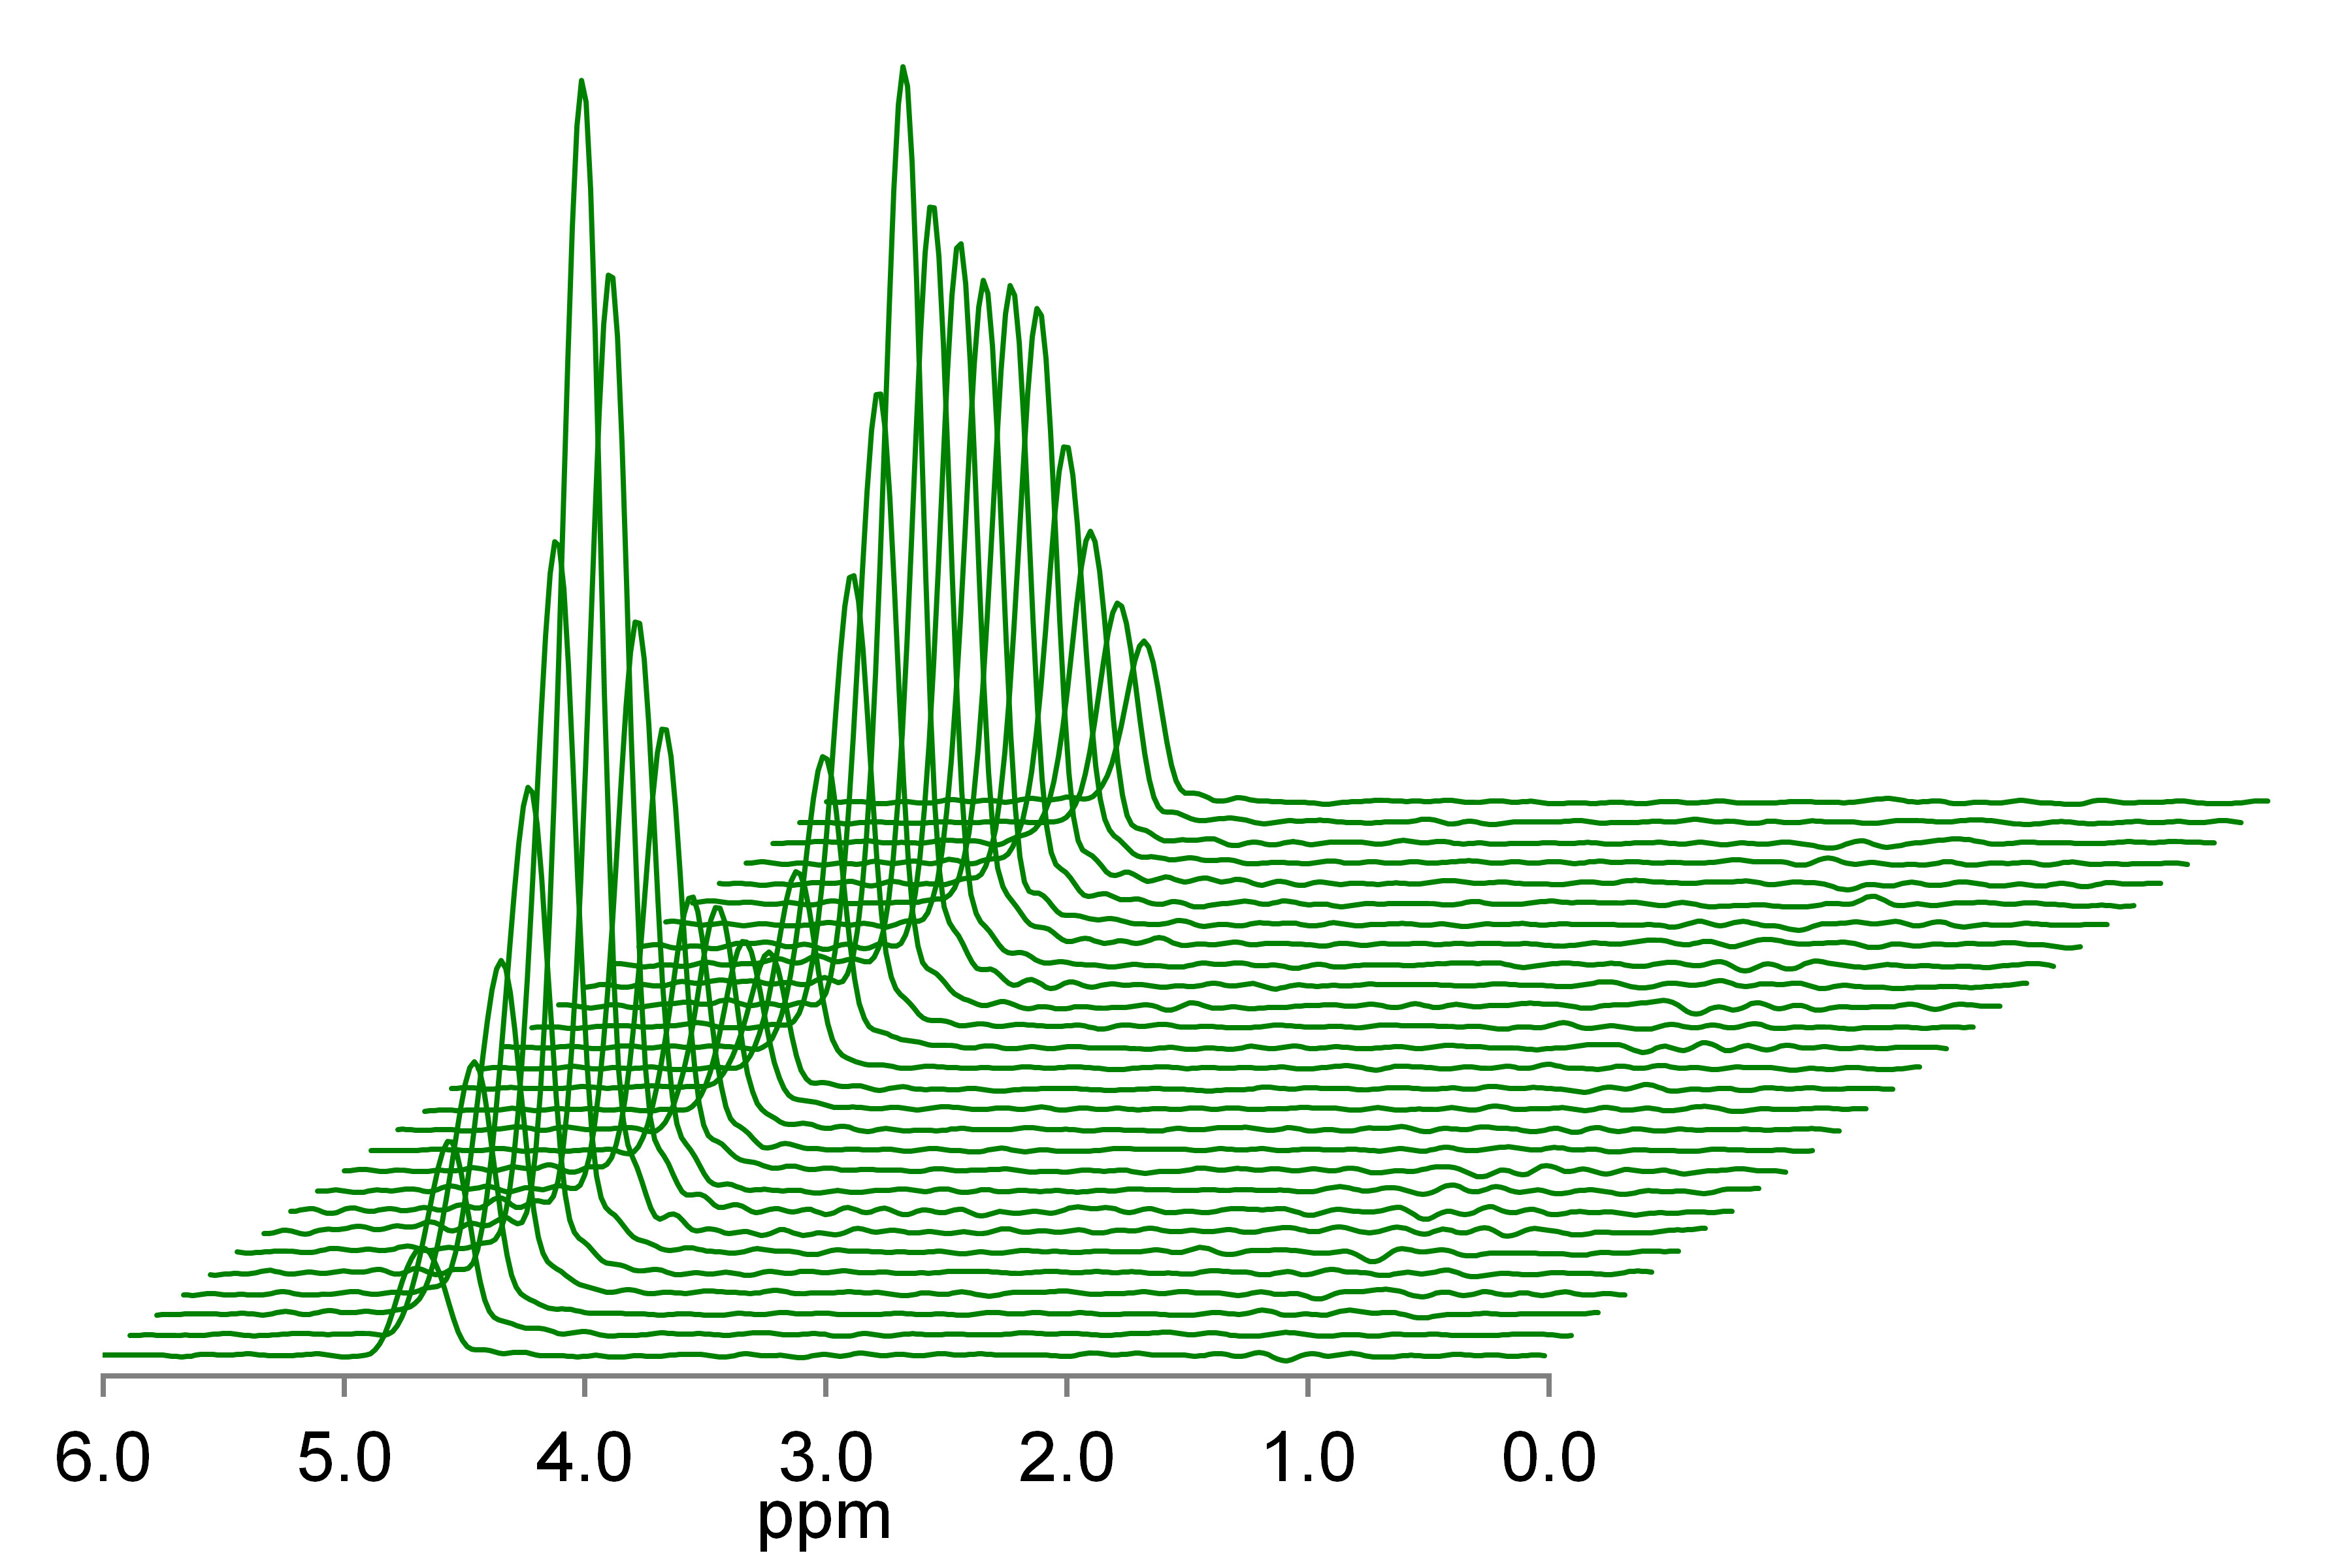
This was a prospectively designed secondary aim of single-center clinical trials requiring CSE-MRI and MRS at 3T between April and July 2014. Demographics were recorded and summarized descriptively. Multi-TR multi-TE MR spectroscopy was performed with a 2 x 2 x 2 cm3 voxel in the spleen. Spectra were visually analyzed by an experienced spectroscopist to verify the absence of splenic fat signal. Patients in whom splenic fat signal could not be excluded due to contamination by extrahepatic adipose tissue were excluded (Figure 1) 4. Research subjects also underwent confounder-corrected CSE 3T MRI and had fat quantification in the spleen using four MRI-based techniques: magnitude-based PDFF (MRI-M), high-signal-to-noise (SNR) magnitude-based PDFF, complex-data-based PDFF (MRI-C), and high-SNR complex-data-based PDFF. As PDFF values obtained were right-skewed, the median and range of PDFF values measured by each technique were reported. Spearman’s rank correlation coefficient was computed for each pair of measurement techniques pairwise, and a scatterplot matrix was generated.Results
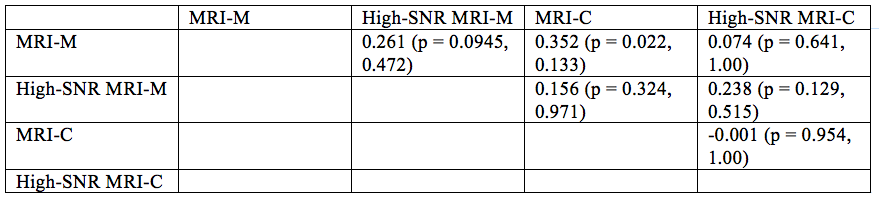
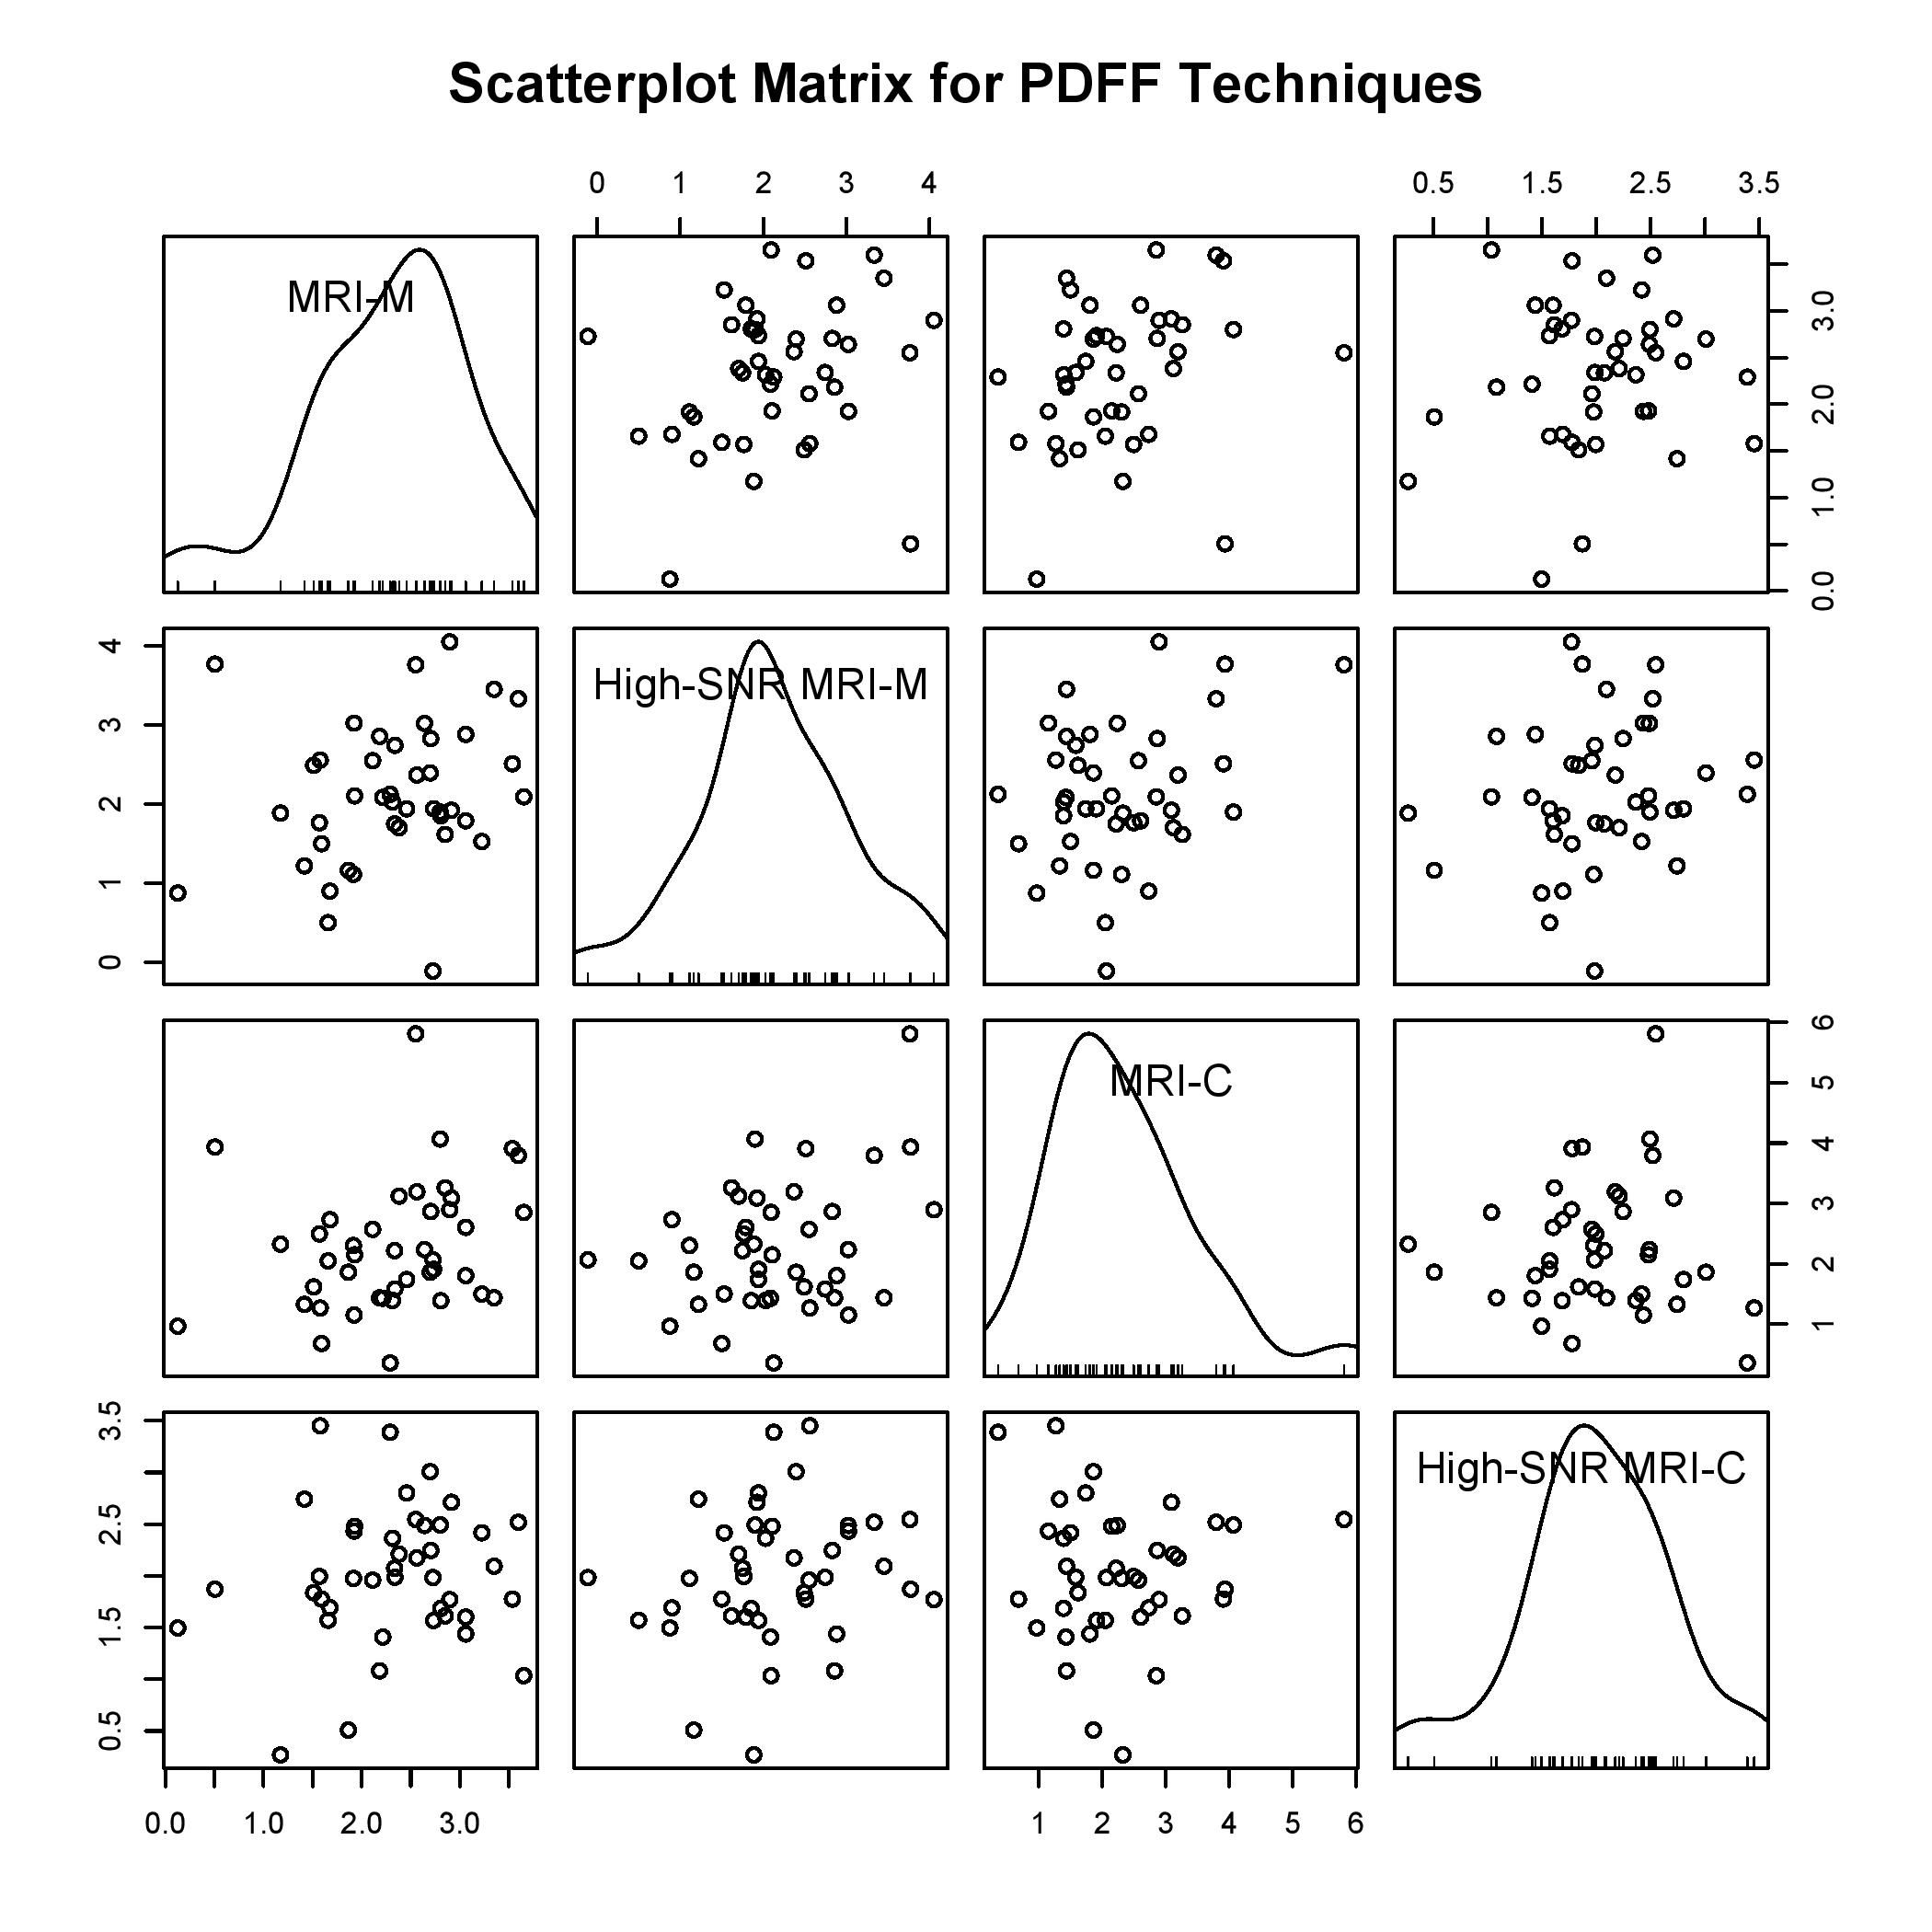
42 research subjects (17 female, 25 male; median age 14 years old, range 8 – 65; median BMI 29 kg/m2, range 17 – 41). Median PDFF measured by magnitude-based PDFF, high-SNR magnitude-based PDFF, complex-data based PDFF, and high-SNR complex-data based PDFF was, respectively, 2.4% (range: 0.1% - 3.7%), 2.0% (range: -0.1% – 4.1%), 2.1% (range: 0.4% - 5.8%), and 2.0% (range: 0.3% - 3.5%). Pairwise associations were weak, with the highest rank correlation coefficient being 0.352 between MRI-M and MRI-C (Table 1). Once correction for multiple comparisons was performed, none of these associations were statistically significant. No relationship between PDFF measured by each technique was observed on the pairwise scatterplot matrix (Figure 2).Discussion
These results demonstrate that CSE-MRI estimates non-zero PDFF values in human spleen with MRS-verified absence of MR visible fat. The poor agreement between PDFF estimated by different CSE-MRI methods suggest that these values are artifactual rather than representing true fat signal not observed by MRS. Prior studies of CSE-MRI-PDFF estimation in human liver have also suggested that PDFF estimation is noisy in the low-PDFF range, but this is the first study to evaluate PDFF estimation in an organ that is known to contain no fat and in which the absence of fat could be verified by MRS. Limitations of this study include selection bias from analyzing research subjects at a single tertiary care facility and relatively small sample size. Further technical innovation is needed to improve the accuracy of CSE-MRI-PDFF estimation in the low-PDFF range.Conclusion
Advanced CSE-MRI methods spuriously detect non-zero PDFF values in the human spleen.Acknowledgements
No acknowledgement found.References
1. Reeder SB, Cruite I, Hamilton G, Sirlin CB. Quantitative assessment of liver fat with magnetic resonance imaging and spectroscopy. J Magn Reson Imaging 2011;34(4):729–49.
2. Reeder SB, Hu HH, Sirlin CB. Proton density fat-fraction: a standardized MR-based biomarker of tissue fat concentration. J Magn Reson Imaging 2012;36(5):1011–4.
3. Meisamy S, Hines CDG, Hamilton G, et al. Quantification of hepatic steatosis with T1-independent, T2-corrected MR imaging with spectral modeling of fat: blinded comparison with MR spectroscopy. Radiology 2011;258(3):767–75.
4. Hamilton G, Middleton MS, Hooker JC, et al. In vivo breath-hold (1) H MRS simultaneous estimation of liver proton density fat fraction, and T1 and T2 of water and fat, with a multi-TR, multi-TE sequence. J Magn Reson Imaging 2015;42(6):1538–43.
Figures