5198
MRI Quantification of Liver Proton Density Fat Fraction during Free Breathing using a Motion-Insensitive Single-Shot 2D Technique1University of Wisconsin, Madison, WI, United States, 2GE Healthcare, Waukesha, WI, United States
Synopsis
Chemical shift encoded (CSE-MRI) techniques have been previously validated for the measurement of liver proton density fat fraction (PDFF), which serves as a biomarker for liver fat content. However, current CSE-MRI techniques rely upon 3D volumetric or 2D interleaved acquisitions, both of which are sensitive to motion and require the patient to suspend respiration. In this study, we demonstrate the feasibility of a "single shot" 2D sequential CSE-MRI technique to freeze motion. 2D sequential CSE-MRI demonstrates superior performance during free breathing when compared to 3D and 2D interleaved acquisitions.
Introduction
Chemical shift-encoded (CSE) MRI techniques can accurately measure liver proton density fat fraction (PDFF), a quantitative imaging biomarker of liver fat content. Current CSE-MRI techniques are based on multi-echo spoiled gradient echo (SGRE), using either 3D or 2D slice-interleaved acquisitions. Unfortunately, these techniques require a prolonged breath hold to avoid motion-related artifacts. In previous studies, respiratory-gating and navigator based methods have been shown to enable accurate liver PDFF quantification without the need for breath holding. Gated methods [1], however, require several minutes of scan time, and the resulting images contain moderate residual motion artifact.Purpose
To demonstrate the feasibility of a "single-shot" sequential 2D CSE-MRI technique for motion-insensitive quantification of liver PDFF.Methods
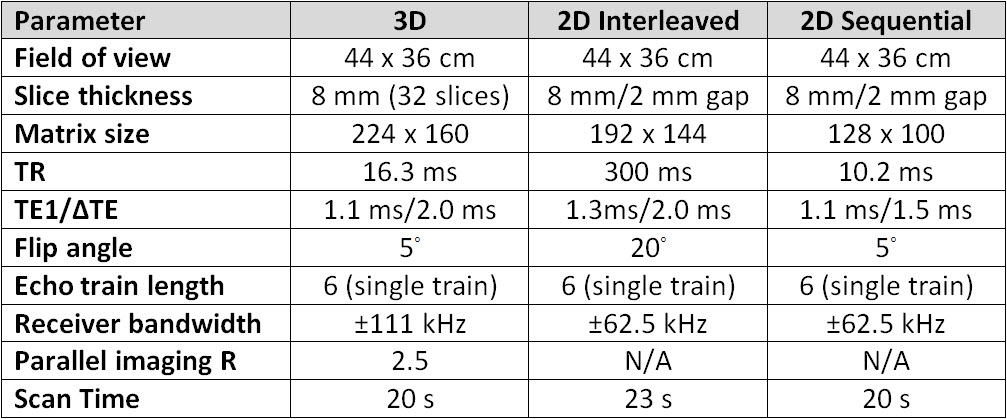
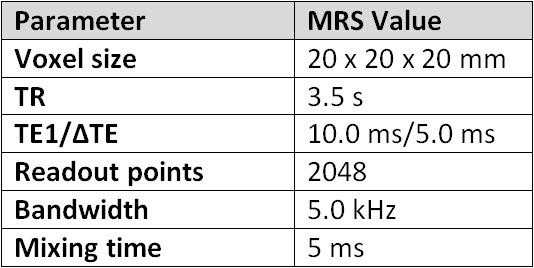
Patients undergoing clinical abdominal MRI were prospectively enrolled in this IRB-approved and HIPAA-compliant single-institution protocol. As an adjunct to their clinical scan, patients underwent CSE-MRI to measure liver PDFF. Scans using three different CSE-MRI techniques (3D CSE-MRI, 2D interleaved CSE-MRI, and 2D sequential CSE-MRI) (Figure 1) were performed both during a single breath hold (BH) and free breathing (FB). Multi-echo T2-corrected single-voxel STEAM MR spectroscopy (MRS) measurements of liver PDFF for each patient were also performed (Figure 2), as described elsewhere [2], resulting in a total of seven scans per patient.
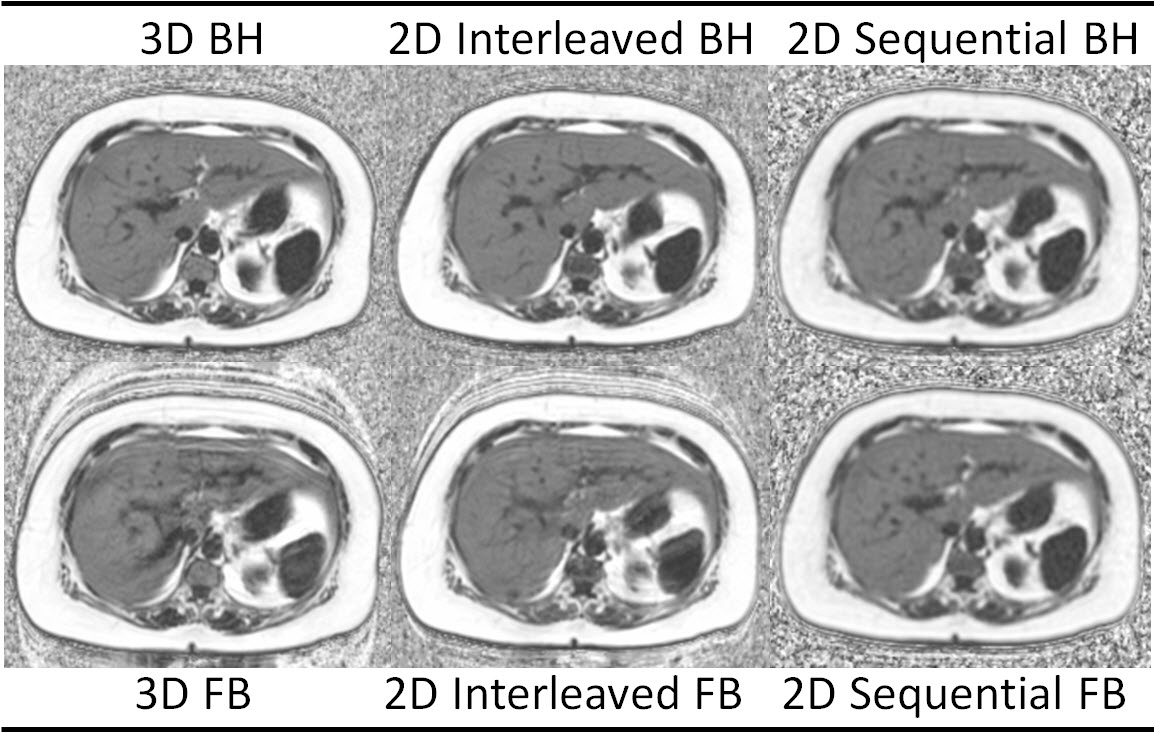
All imaging was performed at 1.5T (MR450w v25.0, GE Healthcare, Waukesha, WI) using a phased-array torso coil. Acquisition parameters between corresponding FB and BH acquisitions were identical. PDFF maps were reconstructed for each of the six CSE-MRI acquisitions (Figure 3), corrected for all relevant confounding factors, including R2* decay, multi-peak fat, and phase errors [3-7].
Analysis of PDFF maps was performed on a standalone workstation (OsiriX, Pixmeo SARL, Geneva, Switzerland). Circular regions of interest (ROI) 3 cm2 in area were placed centrally in each of the nine Couinaud liver segments by an experienced analyst for each CSE-MRI acquisition for all patients. PDFF measurements from all nine Couinaud segments were averaged to estimate an overall liver PDFF for each acquisition.
MRS-PDFF was estimated using a previously proposed algorithm for T2-corrected spectroscopic quantification of the water and multi-peak fat signals [2]. MRS processing was performed off-line using Matlab (MathWorks, Natick, MA).
Correlation plots of MRS-PDFF and CSE-MRI-PDFF fat fraction were performed for BH techniques to demonstrate the validity of the CSE-MRI measurements. Bland-Altman analysis of FB vs BH acquisitions was performed for each CSE-MRI technique to determine bias and limits of agreement (LOA).
Results
15 subjects (10 women and 5 men) were recruited (mean [±SD] age 53.1 ± 13.9, range 23-81 years). By MRS, mean liver PDFF for the cohort was 6.0 ± 7.1% (range 0.6-28.0%). Mean liver PDFF was 5.6 ±7.5% for 3D BH, 6.2 ± 6.5% for 3D FB, 5.4 ±7.4% for 2D interleaved BH, 6.7 ± 7.1% for 2D interleaved FB, 5.7 ± 6.9% for 2D sequential BH, and 5.7 ± 6.8% for 2D sequential FB, none of which were significantly different than MRS.
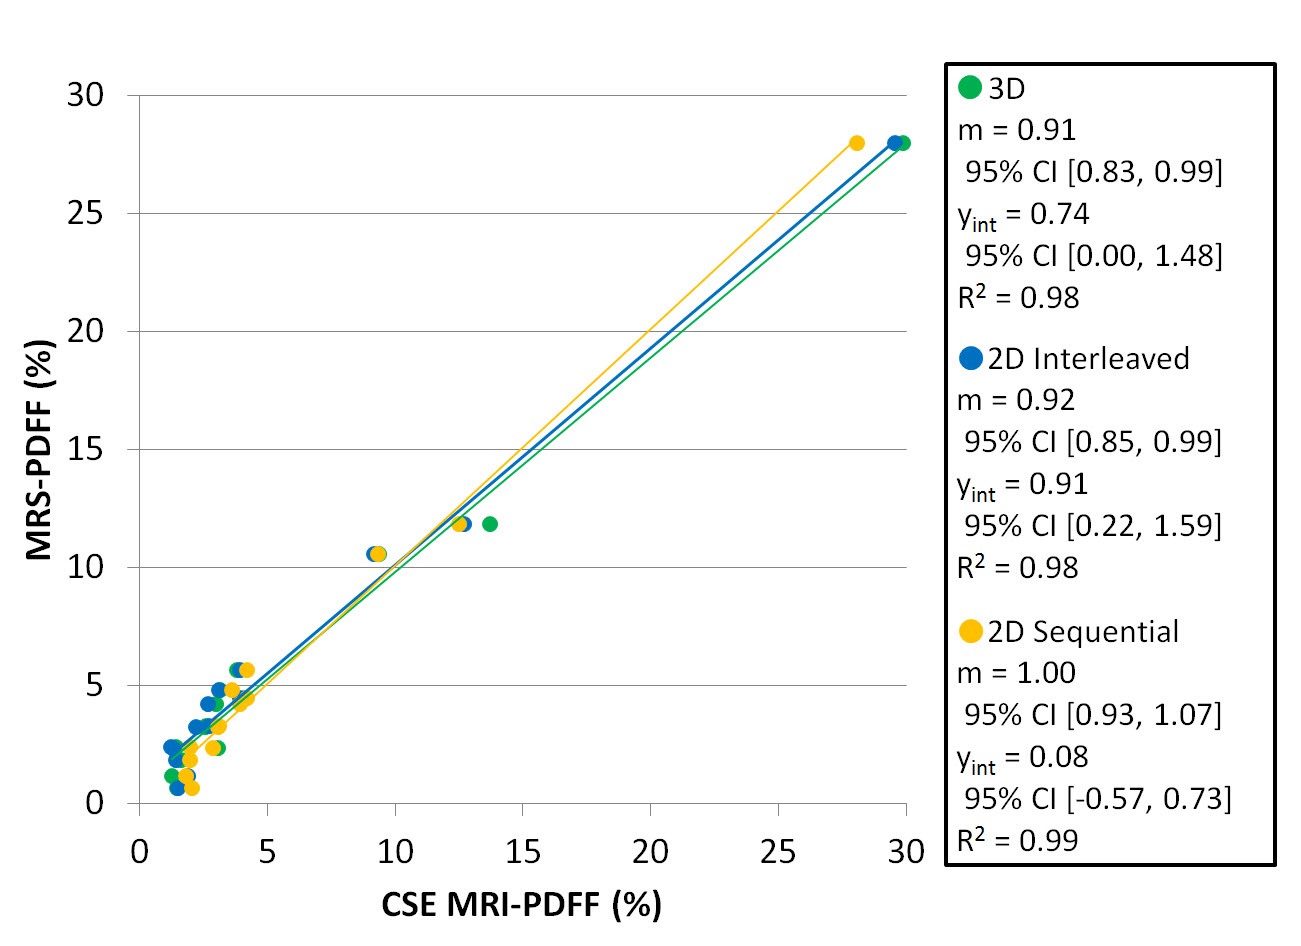
To assess the accuracy of the three CSE-MRI methods, correlation analysis was performed for the breath-hold acquisitions. Strong correlation (Figure 4) was observed between mean CSE-MRI PDFF and MRS-PDFF, with R2 values of 0.98, 0.98, and 0.99 for 3D, 2D interleaved, and 2D sequential acquisitions, respectively. Corresponding slope values were 0.91 (95% CI [0.83, 0.99]), 0.92 [0.85, 0.99], and 1.00 [0.93, 1.07] and intercept values 0.74 [0.00, 1.48], 0.91 [0.22, 1.59], and 0.08 [-0.57, 0.73], respectively.
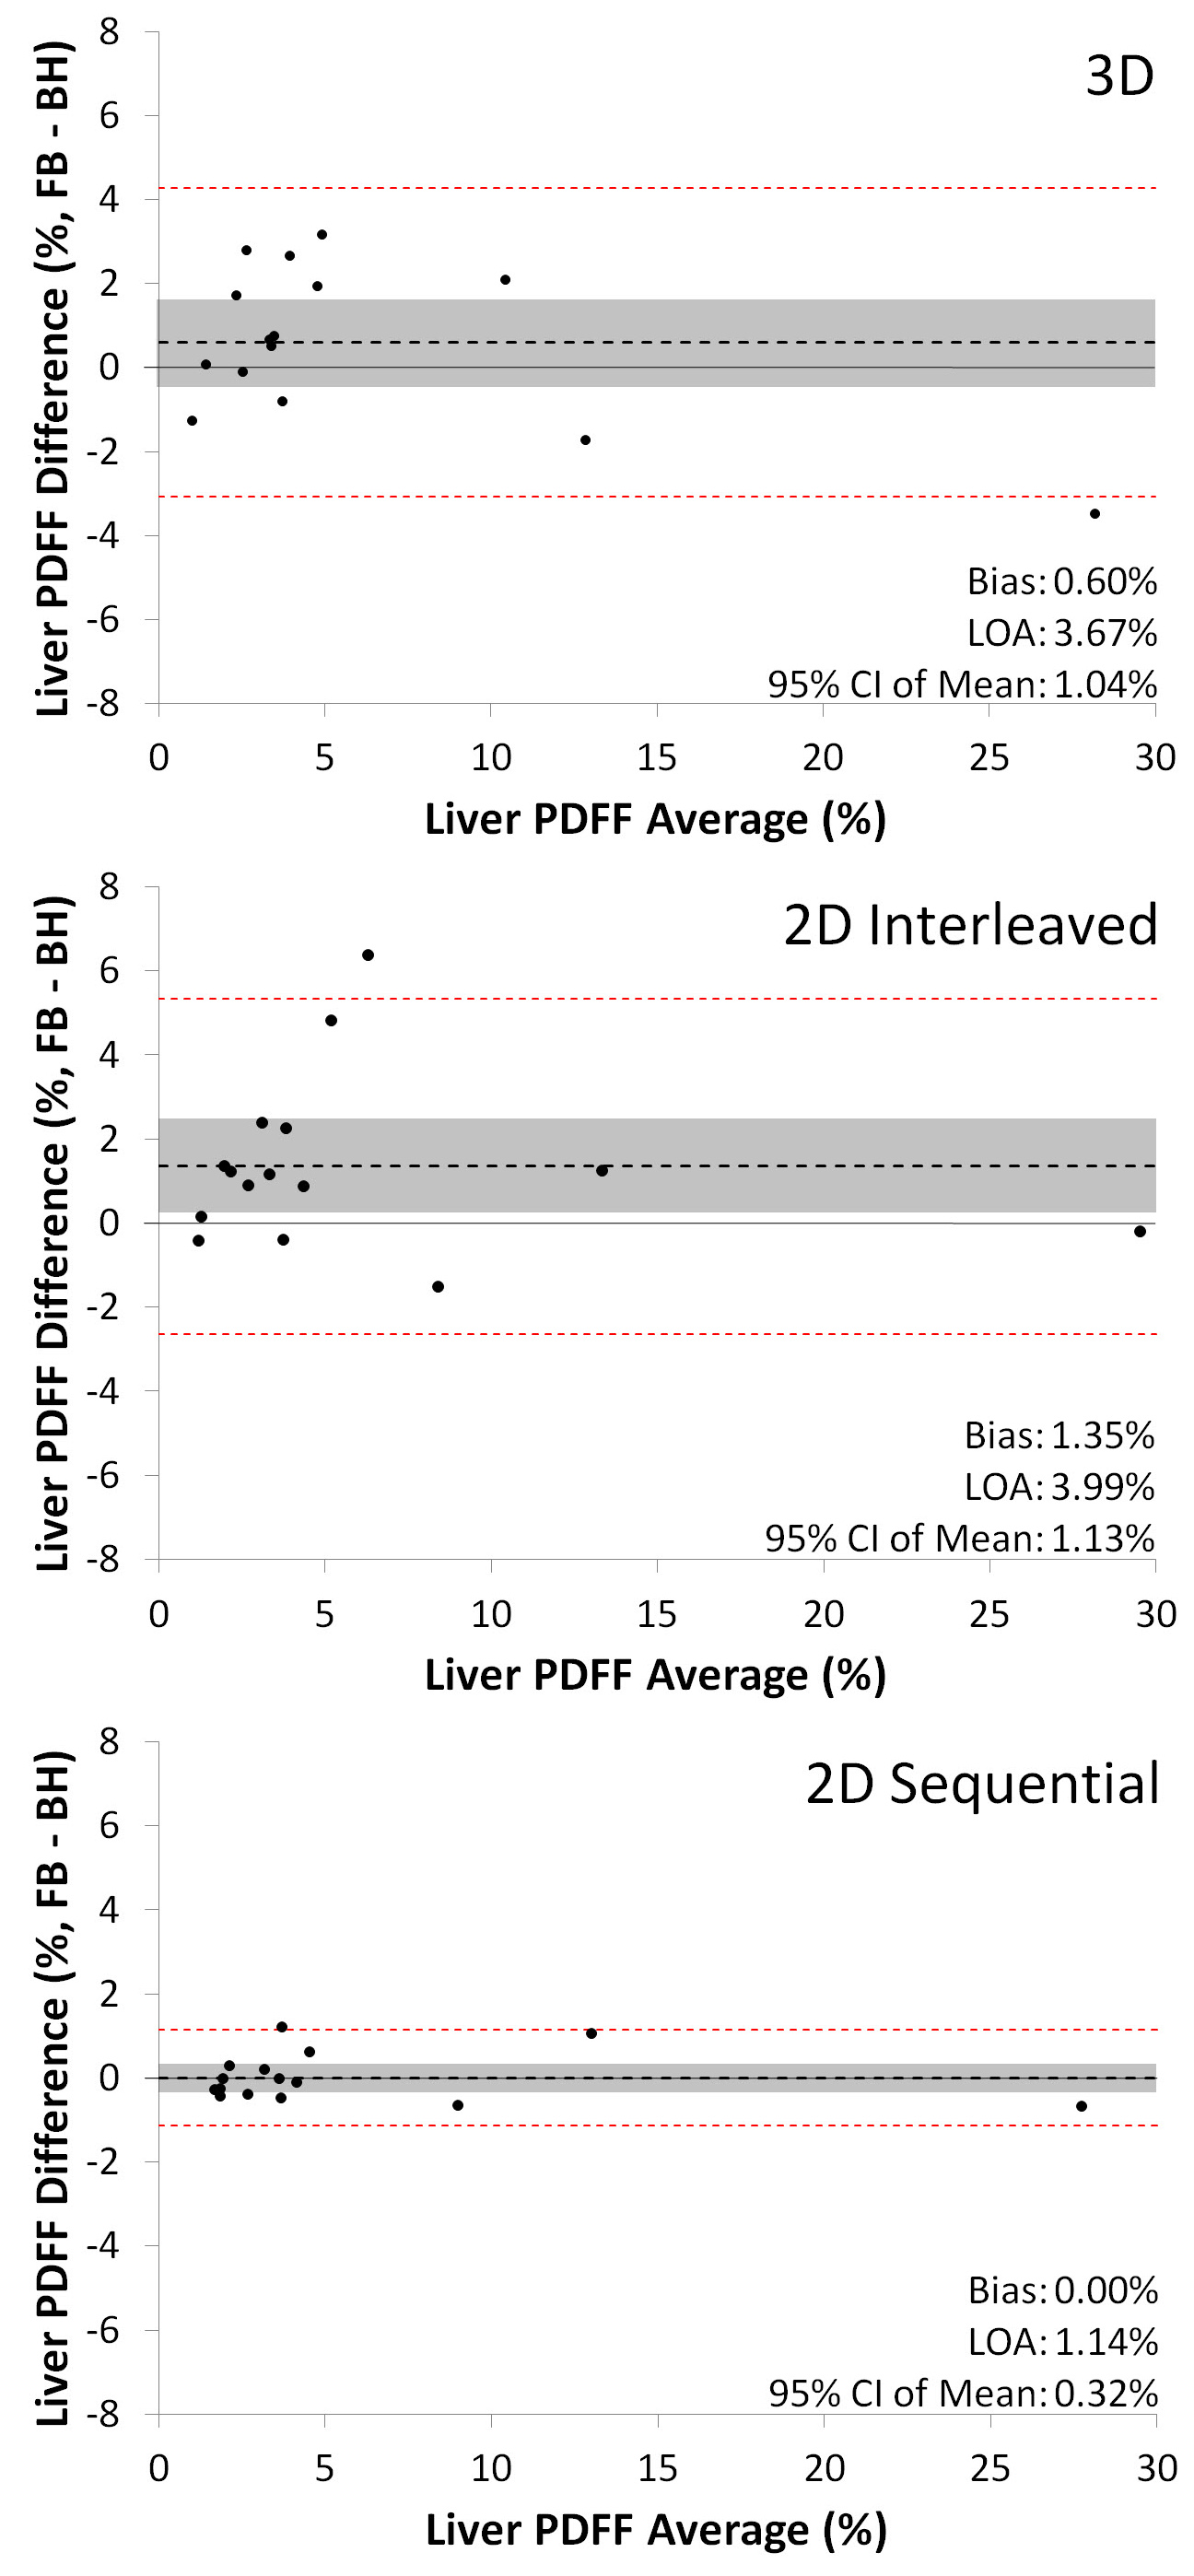
To assess the effects of motion on PDFF quantification, Bland-Altman analysis (Figure 5) was performed to compare FB and BH acquisitions. The 2D-sequential acquisition demonstrated essentially no bias, with a mean of 0.00% (95% CI [-0.32%, 0.32%]) compared to positive biases of 0.60% (95% CI [-0.44%, 1.64%]) for 3D and 1.35% (95% CI [0.22%, 2.48%]) 2D interleaved acquisitions. The 95% limits of agreement (LOA) were also narrower for the 2D sequential acquisition (±1.14%) compared with 3D (±3.67%) and 2D interleaved (±3.99%) acquisitions.
Discussion
Our data demonstrate strong correlation between MRS PDFF and PDFF measurements for all CSE-MRI acquisitions, confirming the validity of all three techniques for the quantification of liver fat content. We observed markedly less degradation of MR images by motion artifact during free breathing scans with the 2D sequential acquisition when compared to the 3D and 2D interleaved acquisitions.Conclusion
CSE-MRI can be successfully used to measure liver PDFF during free breathing using a motion-insensitive, "single-shot" sequential 2D technique. This technique permits the accurate quantification of liver fat content without the need for the patient to suspend respiration.Acknowledgements
The authors wish to acknowledge support from the NIH (UL1TR00427, R01-DK083380, R01-DK088925, R01-DK100651, K24-DK102595), as well as research support from GE Healthcare.References
1. Motosugi U, Hernando D, Bannas P, Holmes JH, Wang K, Shimakawa A, Iwadate Y, Taviani V, Rehm JL, Reeder SB. “Quantification of liver fat with respiratory-gated quantitative chemical shift encoded MRI.” J Magn Reson Imaging 2015 42(5):1241-8.
2. Hernando D, Artz NS, Hamilton G, Roldan A, Reeder SB. “Fully automatic processing of multi-echo spectroscopy data for liver fat quantification.” Proceedings of the Joint Annual Meeting ISMRM-ESMRMB 2014. Abstract 2884.
3.Yu H, Shimakawa A, McKenzie CA, Brodsky E, Brittain JH, Reeder SB, “Multiecho water-fat separation and simultaneous R2* estimation with multifrequency fat spectrum modeling.” MagnReson Med 2008 60(5):1122-34.
4. Bydder M, Yokoo T, Hamilton G, Middleton MS, Chavez AD, Schwimmer JB, Lavine JE, Sirlin CB, “Relaxation effects in the quantification of fat using gradient echo imaging.” J MagnReson Imaging 2008 26(3):347-59.
5. Yu H, McKenzie CA, Shimakawa A, Vu AT, Brau AC, Beatty PJ, Pineda AR, Brittain JH, Reeder SB, “Multiecho reconstruction for simultaneous water-fat decomposition and T2* estimation.” J MagnReson Imaging. 2007 26(4):1153-61.
6. Hernando D, Hines CD, Yu H, Reeder SB, “Addressing phase errors in fat-water imaging using a mixed magnitude/complex fitting method.” MagnReson Med. 2012 67(3):638-44.
7. Liu CY, McKenzie CA, Yu H, Brittain JH, Reeder SB, “Fat quantification with IDEAL gradient echo imaging: correction of bias from T1 and noise.” MagnReson Med 2007 58(2):354-64.
Figures