5196
Hydration imaging of skeletal muscle tissue based on fat referenced water-fat separated MRI1Department of Biomedical Engineering, Linköping University, Linköping, Sweden, 2Center for Medical Image Science and Visualization (CMIV), Linköping University, Linköping, Sweden, 3Advanced MR Analytics AB, Linköping, Sweden, 4Department of Nephrology, Region Östergötland, Sweden, 5Biomedical Engineering, Tallinn University of Technology, Estonia, 6Department of Medical and Health Sciences, Linköping University, Sweden
Synopsis
This work introduces a signal model for imaging of the local hydration of lean tissue, based on water-fat separated MRI. The signal model is calibrated on a healthy cohort and then evaluated on a cohort of hemodialysis patients.
Introduction
Currently there are no good quantitative imaging methods for determining the hydration of soft tissue. On a systematic level hydration imaging can help to better describe the dynamic water regulation of the body, and potentially determine the dry weight of hemodialysis patients. On a local level, hydration imaging can help to locate and characterize inflammation, and increase the precision of volumetric measurements of organs by removing variations induced by the current tissue hydration.
The aim of this pilot study was to show that the hydration, relative to a reference value, of muscle tissue can be detected based on water-fat MRI.
Theory
The aim is to construct the relative hydration ratio $$$H^\phi$$$ of a tissue $$$\phi$$$ based on $$$T^*_2$$$ and lipid spectrum corrected water-fat MRI, where $$$H^\phi=1$$$ if normally hydrated, $$$H^\phi<1$$$ if under hydrated and $$$H^\phi>1$$$ if over hydrated.
From a water-fat MRI perspective the tissue distribution within a voxel can be described as $$$V_f^\phi+V_w^\phi+V_i^\phi=1$$$, where $$$V_x^\phi$$$ are the fat, water and MR invisible volume fractions. Thus a lean tissue water concentration (LTW) can be defined:
$$LTW=\frac{V_w^\phi}{V_w^\phi+V_i^\phi}=\frac{V_w^\phi}{1-V_f^\phi}$$
and $$$H^\phi$$$ can be determined by a $$$LTW$$$ reference:
$$H^\phi=\frac{LTW^\phi}{LTW^\phi_{ref}}$$
Assuming a global $$$T_1$$$ saturation factor for fat the water-fat signals can be described as:
$$w(r)=k(r)*s_w^\phi*\rho_w(r)$$
$$f(r)=k(r)*s_f*\rho_f(r)$$
where $$$k(r)$$$ is a unknown scale factor, $$$s$$$ the saturation and $$$\rho$$$ the number of lipid or water bound protons.
The $$$V_f^\phi$$$ can be determined by using the fat signal of nearby adipose tissue $$$f^{AT}$$$ as a signal reference, these calibrated images are defined as:
$$f_c(r) =\frac{f(r)}{f^{AT}},w_c(r)=\frac{w(r)}{f^{AT}}$$
and, assuming $$$k(r_1)\approx k(r_2)$$$ and compensating fro non-lean tissue:
$$\frac{f_c(r)}{V_f^{AT}}=\frac{k(r)*s_f*\rho_f (r)}{k(r_{AT})*s_f*\rho^{AT}_f/V_f^{AT}} \approx \frac{\rho_f(r)}{\rho^{AT}_f}V_f^{AT}=V_f(r)$$
Provided that the proton density of the water and lipid compartments are identical, as in the liver1, $$$V_w^\phi$$$ relation to $$$w_c$$$ becomes:
$$\frac{w^\phi(r)}{f^{AT}/V_f^{AT}}=\frac{k(r)*s_w^\phi*\rho_w(r)}{k(r_{AT})*s_f*\rho^{AT}_f/V_f^{AT}}\approx \frac{s_w^\phi*\rho_f(r)}{s_f*\rho^{AT}_f}V_f^{AT}=\frac{s_f}{s_w^\phi}V_w(r)$$
thus
$$LTW^\phi=\frac{V_w^\phi}{1-V_f^\phi}=\frac{s_f}{s_w^\phi}\frac{w^\phi_c*V_f^{AT}}{1-f^\phi_c*V_f^{AT}}=\frac{s_f}{s_w^\phi}\frac{w^\phi_c}{1/V_f^{AT}-f^\phi_c}$$
and assuming that the $$$LTW^\phi_{ref}$$$ saturations are equal to that in $$$LTW^\phi$$$, then $$$H^\phi$$$ is only dependent on $$$w_c^\phi$$$, $$$f_c^\phi$$$ and $$$V^{AT}_f$$$.
Methods
The volume fraction $$$V_f^{AT}$$$ was assumed to be constant and set to 0.86, based on the average distribution of water, fat and protein observed by Thomas2 and densities reported by Siri2.
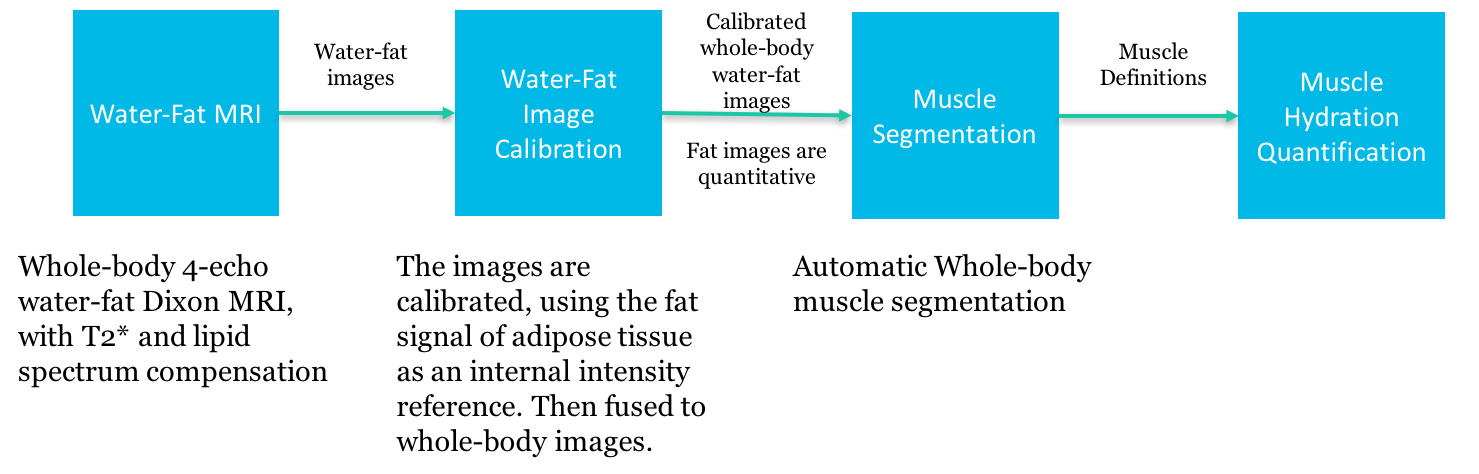
A skeletal muscle reference $$$LTW^M_{ref}$$$ was established from whole-body scans of 19 postmenopausal women, using 10 axial 3D spoiled GRE stacks acquired on a Philips Ingenia 3T with, flip angle = 10°, TE = 1.15/2.3/3.35/4.6 ms, TR = 5.8 ms, FOVs 340x560 mm3 and voxel size of 2.5x2.5x4 mm3. Water-fat images were separated by a 2-point reconstruction4 that initialized a reconstruction using a complete signal model5. The water-fat images were calibrated6,7 and the abdominal and leg skeletal muscles segmented8, so the average $$$LTW^M_{ref}$$$ could be computed, see figure 1.
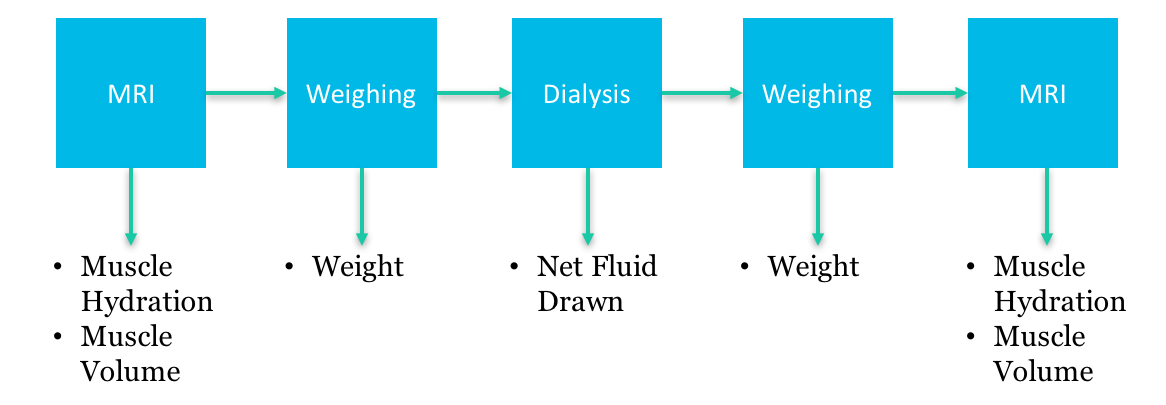
To show that the relative hydration of skeletal muscle $$$H^M$$$ is dependent on the current hydration, 11 hemodialysis patients were imaged and analyzed as above pre/post hemodialysis. The relative hydration $$$H^M$$$ was computed based on $$$LTW^M_{ref}$$$. Furthermore, the pre/post dialysis weight and the net fluid drawn during dialysis were recorded, see figure 2.
The $$$H^M$$$ and muscle volume of both cohorts were measured and compared using t-tests. The change in $$$H^M$$$ and muscle volume following hemodialysis was analyzed using paired t-tests. The agreement between MRI and external measurements were assessed using linear regression.
Results
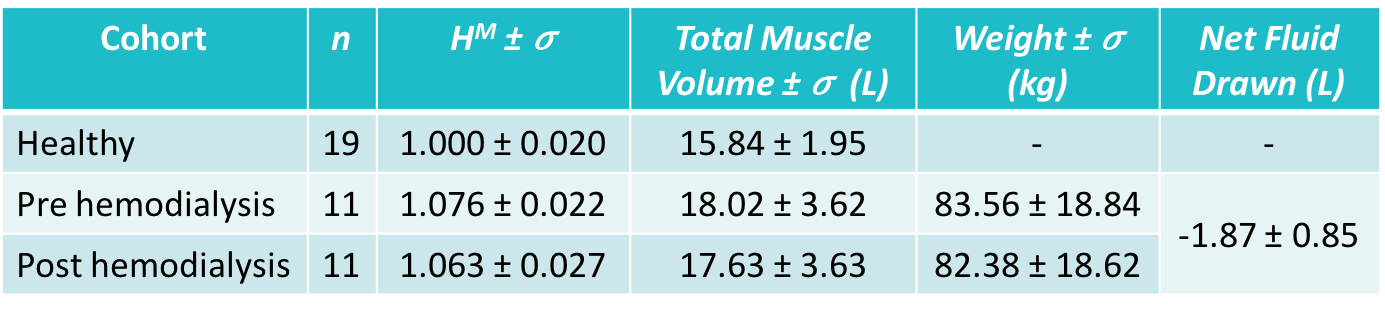
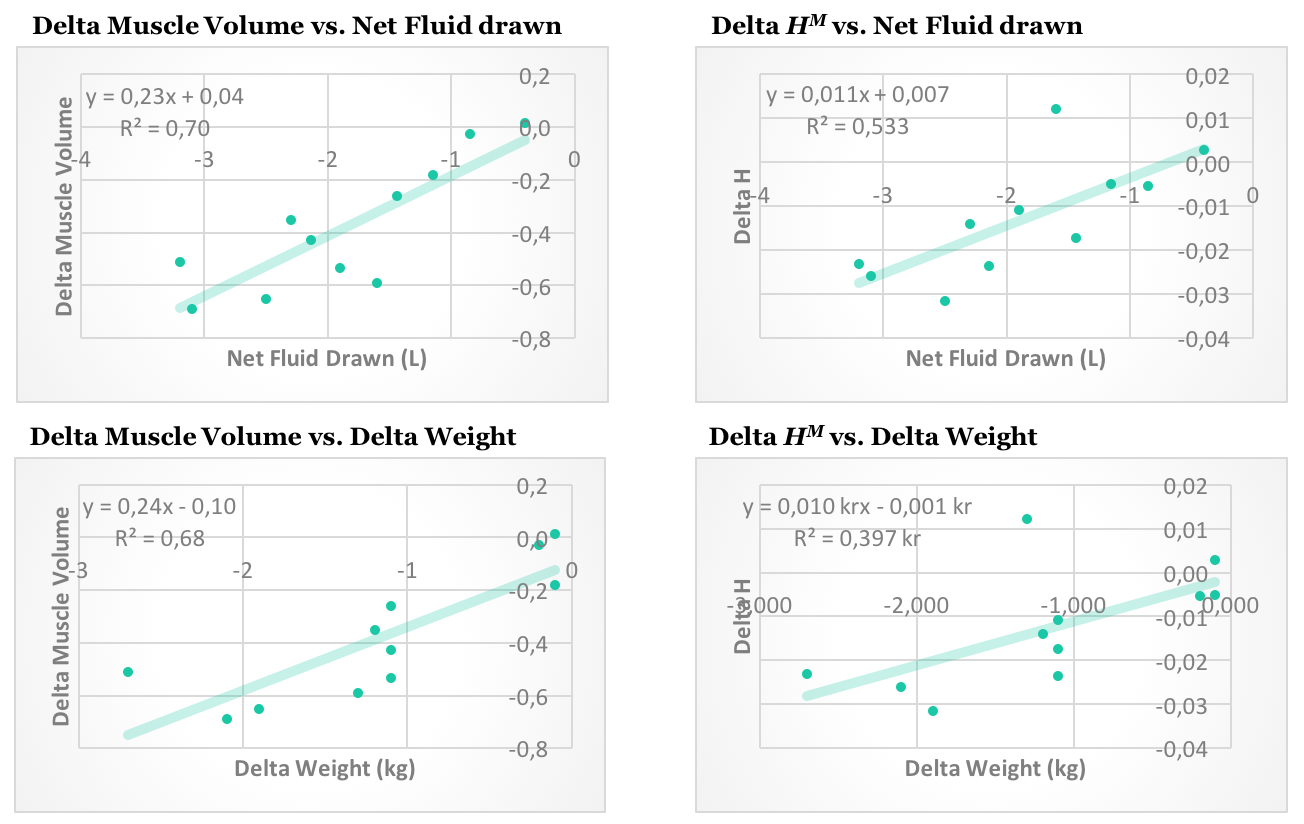
The observed measurements and standard deviations can be found in figure 3. The between cohorts t-tests showed significant differences in $$$H^M$$$ between healthy volunteers and hemodialysis patients pre (p < 0.001) and post (p < 0.001) hemodialysis. In the hemodialysis cohort paired t-tests showed a significant reduction in $$$H^M$$$ (p = 0.009), muscle volume (p < 0.001) and weight (p < 0.001). The results of the linear regression between MRI and external measurements are found in figure 4.Discussion
The relative hydration $$$H^M$$$ is sensitive to the hydration level, as illustrated by the difference between healthy subjects and hemodialysis patients, and the delta $$$H^M$$$ caused by hemodialysis. The study also shows that the muscle volume can vary significantly based on hydration, which is a potential confounder for muscle volume measurement of any population.
The findings in this study are limited by the assumed constant $$$V_f^{AT}$$$, for increased accuracy the method should take adipose hydration into account. Furthermore, the reference cohort does not represent the general population. Although $$$H^M$$$ has been shown to be hydration dependent, further work is needed to properly calibrate and verify the method before applying it for over/under hydration predictions.
Conclusion
The hydration level relative to a reference can be measured by water-fat MRI with adipose tissue as a signal reference. This method can potentially improve hemodialysis care by accurate and objective dry weight measurement.Acknowledgements
No acknowledgement found.References
1. Longo, R., Pollesello, P., Ricci, C., Masutti, F., Kvam, B. J., Bercich, L., Croce, L. S., Grigolato, P., Paoletti, S., De Bernard, B., Tiribelli, C. and Dalla Palma, L. (1995), Proton MR spectroscopy in quantitative in vivo determination of fat content in human liver steatosis. J. Magn. Reson. Imaging, 5: 281–285. doi:10.1002/jmri.1880050311
2. Thomas, Lorette W., (1962), THE CHEMICAL COMPOSITION OF ADIPOSE TISSUE OF MAN AND MICE. Experimental Physiology, 47 doi: 10.1113/expphysiol.1962.sp001589.
3. Siri, William E. "Body composition from fluid spaces and density: analysis of methods." Techniques for measuring body composition 61 (1961): 223-44.
4. Romu, T., Dahlström, N., Leinhard, O. D. and Borga, M. (2016), Robust water fat separated dual-echo MRI by phase-sensitive reconstruction. Magn. Reson. Med.. doi:10.1002/mrm.26488
5. 1.Yu H, Shimakawa A, McKenzie CA, Brodsky E, Brittain JH, Reeder SB. Multi-Echo Water-Fat Separation and Simultaneous R2* Estimation with Multi-Frequency Fat Spectrum Modeling. Magnetic resonance in medicine?: official journal of the Society of Magnetic Resonance in Medicine / Society of Magnetic Resonance in Medicine. 2008;60(5):1122-1134. doi:10.1002/mrm.21737.
6. T. Romu, M. Borga and O. Dahlqvist, "MANA - Multi scale adaptive normalized averaging," 2011 IEEE International Symposium on Biomedical Imaging: From Nano to Macro, Chicago, IL, 2011, pp. 361-364. doi: 10.1109/ISBI.2011.5872424
7. O. D. Leinhard et al., "Quantitative abdominal fat estimation using MRI," Pattern Recognition, 2008. ICPR 2008. 19th International Conference on, Tampa, FL, 2008, pp. 1-4. doi: 10.1109/ICPR.2008.4761764
8. Karlsson, A., Rosander, J., Romu, T., Tallberg, J., Grönqvist, A., Borga, M. and Dahlqvist Leinhard, O. (2015), Automatic and quantitative assessment of regional muscle volume by multi-atlas segmentation using whole-body water–fat MRI. J. Magn. Reson. Imaging, 41: 1558–1569. doi:10.1002/jmri.24726
Figures