5195
Improving the Noise Propagation Behavior of Different Fatty Acid Quantification Techniques using Spectral Denoising1Pattern Recognition Lab, Department of Computer Science, Friedrich-Alexander-Universität Erlangen-Nürnberg, Erlangen, Germany, 2MR Applications Predevelopment, Siemens Healthcare GmbH, Erlangen, Germany, 3MR R&D Collaborations, Siemens Healthcare, Cary, NC, United States, 4Radiology, Duke University Medical Center, Durham, NC, United States, 5Center for Advanced Magnetic Resonance Development, Duke University Medical Center, Durham, NC, United States
Synopsis
MRI is not only capable of quantifying the fat content, but also the fatty acid composition of human adipose tissue. Especially for low fat fractions, fatty acid quantification is sensitive to image noise. Including prior information or additional parameter approximations into the quantification method helped to improve the noise propagation behavior, but also introduced a systematic bias. Performing spectral denoising in between image reconstruction and fatty acid quantification kept the systematic bias as well as the noise in the parameter maps low, and hence allows for more flexible protocol selection and shorter acquisition times.
Purpose
Recent studies suggest the use of the hepatic fatty acid (FA) composition as a biomarker for distinguishing non-alcoholic steatohepatitis (NASH) and simple steatosis1,2. Quantifying the FA composition of adipose tissue using MRI at clinical field strengths is sensitive to image noise, which is usually addressed by long echo trains and signal averaging3. Thus, in-vivo validation of those methods is so far limited to protocols achieving sufficient SNR, having acquisition times of up to several minutes3,4. The aim of this work was to quantitatively assess three FA quantification methods regarding their systematic bias and noise performance using numerical simulations and in-vivo data. Moreover, we propose to use spectral denoising to improve MR-based fat composition quantification on noisy input images.Methods
Three FA quantification
approaches were considered, which differ in the derivation of the number of
double bonds (ndb), number of methylene-interrupted double bonds (nmidb), and
the chain length (CL). All of them incorporate a heuristic approximation for
the CL5. In the first method (termed “Pinv”), water, fat and two
additional fat contribution parameter maps are calculated using a linear model
as has been previously described4. The second technique (termed
“IneqConst”) additionally adds inequality constraints based on prior FA
composition information ($$$ndb\leq6$$$; $$$nmidb\leq3$$$), and solves the resulting
inequality-constrained linear least-squares problem using quadratic
programming. The third method (termed “Iter”) makes use of an additional
approximation for the nmidb and solves two subsequent non-linear
least-square fits iteratively6. The calculated parameters were used
to determine the fractions of unsaturated FAs (UFAs), saturated FAs (SFAs),
mono-unsaturated FAs (MUFAs), and poly-unsaturated FAs (PUFAs). Every
experiment was conducted twice: once without denoising, and once including a
Dixon water-fat spectral denoising method7 prior to the FA
quantification.
FA compositions that span
symmetrically over typical adipose human tissue values8 (UFA = 72.9±15%, PUFA = 23.4±15%) were taken into account when generating the
synthetic dataset. Fat
fractions (FFs) from 15% to 50% were simulated. For every FA composition and FF
combination, a complex-valued signal was synthesized for 8 different echo times
(TE1 = 1.35ms, ΔTE = 1.25ms). The mean absolute errors and mean standard
deviations of the calculated parameter maps were derived numerically by
employing additive Gaussian noise and repeating the simulation 1000 times.
For in-vivo validation, eight echoes of MR data (2D GRE with 16 slices, TE1 = 1.28ms, ΔTE = 1.19ms, TR = 175ms, flip angle = 10°, spatial resolution: 3.75x3.75x10mm3, bandwidth = 1953Hz/px, bipolar readout) from a clinical trial subject suffering from non-alcoholic fatty liver disease (NAFLD) were acquired on a 3T MR scanner (MAGNETOM Trio, Siemens Healthcare, Erlangen, Germany) under IRB approval. Prior to the FA quantification, complex-valued images were calculated using a prototype, and compensated for field inhomogeneities and eddy current effects. The field map and eddy current-correcting phase were calculated using a variable projection least-squares fit, which employed region growing to enforce spatial smoothness. The phase-corrected complex images were used to estimate T2* relaxation by means of variable projection.
Results and Discussion
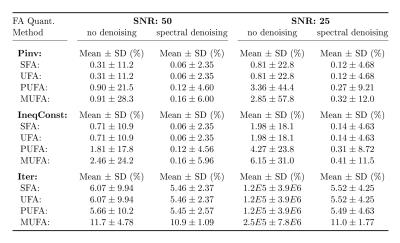
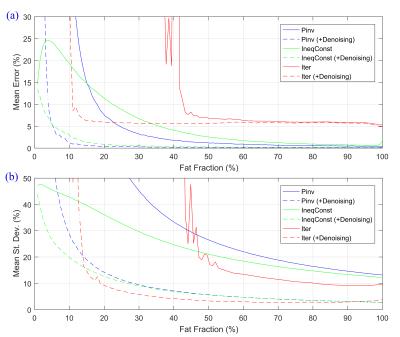
The numerical simulation results are summarized in Table 1. “Pinv” achieved the lowest mean errors. In comparison, adding inequality constraints (method “IneqConst”) led to slightly lower mean standard deviations, while barely increasing the mean errors. The method “Iter” resulted in the lowest standard deviations (especially for the PUFAs and MUFAs), but also introduced a systematic bias. “Pinv” led to uniform standard deviations for all FA combinations (Fig. 1a), whereas “IneqConst” and “Iter” reduced the noise level for some FA values (Fig. 1b-c). The applied spectral denoising method consistently improved the noise propagation behavior of all analyzed methods four- to five-fold. Particularly for small fat fractions, the methods including spectral denoising performed superiorly compared to the unfiltered cases (Fig. 2).
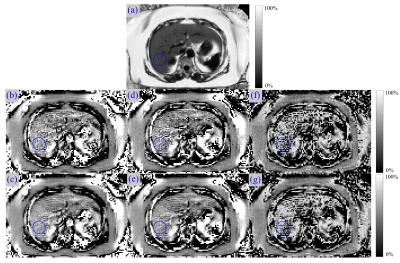
Representative in-vivo UFA maps are depicted in Fig. 3. For the methods “Pinv” and “IneqConst”, the mean UFA values in the ROI were in compliance with previously published results3,8. For these methods the UFA maps from denoised images were more uniform in appearance, and edges were preserved. The method “Iter” (with and without denoising) calculated homogenous UFA values in the subcutaneous tissue (very high FF), but failed to reliably estimate hepatic UFA values.
Conclusion
Including inequality constraints or an approximation of the nmidb parameter in the FA quantification did improve the noise propagation performance, but also increased the mean systematic error. In contrast, applying a spectral denoising algorithm prior to the FA quantification reduced both the systematic error and the noise propagation error. Hence it may be a useful tool to reduce the SNR demand on contrast images and increases the clinical feasibility of MR-based FA quantification.Acknowledgements
No acknowledgement found.References
1. van Werven JR, Schreuder TC, Nederveen AJ, et al. Hepatic unsaturated fatty acids in patients with non-alcoholic fatty liver disease assessed by 3.0 T MR spectroscopy. European Journal of Radiology. 2010;75(2):e102–e107.
2. Flintham
R, Eddowes P, Semple S, et al. Non-Invasive Quantification and Characterisation
of Liver Fat in Non-Alcoholic Fatty Liver Disease (NAFLD) Using Automated
Analysis of MRS Correlated with Histology. In: Proceedings of the 24th
Annual Meeting of ISMRM; 2016. #0357
3. Berglund J, Ahlström H,
Kullberg J. Model-based mapping of fat unsaturation and chain length by
chemical shift imaging – phantom validation and in vivo feasibility. Magnetic
Resonance in Medicine.
2012;68(6):1815–1827.
4. Peterson P, Månsson S. Simultaneous quantification of fat content and fatty acid composition using MR imaging. Magnetic Resonance in Medicine. 2013;69(3):688–697.
5. Bydder M, Girard O, Hamilton G. Mapping the double bonds in triglycerides. Magnetic Resonance Imaging. 2011;29(8):1041–1046.
6. Leporq B, Lambert SA, Ronot M, et al. Quantification of the triglyceride fatty acid composition with 3.0 T MRI. NMR in Biomedicine. 2014;27(10):1211–1221.
7. Lugauer F, Nickel D, Wetzl J, et al. Robust Spectral Denoising for Water-Fat Separation in Magnetic Resonance Imaging. In: Medical Image Computing and Computer-Assisted Intervention - MICCAI. Springer; 2015. p. 667–674.
8. Ren J, Dimitrov I, Sherry AD, et al. Composition of adipose tissue and marrow fat in humans by 1H NMR at 7 Tesla. Journal of Lipid Research. 2008;49(9):2055–2062.
Figures


