5194
Muscular fat fraction using high-resolution imaging – comparison of three T2-based methods and chemical shift-encoded imaging1Medical Radiation Physics, Department of Translational Medicine, Lund University, Skåne University Hospital, Malmö, Sweden
Synopsis
The most common method for fat-water separation nowadays is chemical shift-encoded imaging (CSEI). However, when studying fat accumulation in skeletal muscles and high spatial resolution fat fraction (FF) images are desired, CSEI might be challenging due to the increased inter-echo spacing. Here, three alternative methods based on T2-relaxation times, have been explored and compared to CSEI by calculating the muscular fat fraction of ten healthy volunteers. All T2-based methods resulted in qualitatively improved high-resolution FF images compared to CSEI, while a 2-parameter non-linear least square fit showed best quantitative agreement to low resolution CSEI.
Introduction
Chemical shift-encoded imaging (CSEI) is a common method for fat fraction (FF) estimations in various body parts, such as skeletal muscle.1 As fat infiltration and the distribution of the accumulated fat within the muscle have been related to e.g. insulin resistance,2 it is of interest to acquire high-resolution FF images for the possibility to separate the different muscles compartments, and to distinguish intermuscular from intramuscular fat. Due to the requirement of short inter-echo times,3 high-resolution imaging with CSEI may be challenging and hampered by fat-water swaps. An alternative fat quantification method, utilizing the difference in T2-relaxation times of fat (T2F) and water (T2W), based on non-linear least squares (NLLS) fitting, has been proposed.4 However, NLLS methods are sensitive to noise and have difficulties estimating low FF.5 An alternative fitting algorithm, based on Bayesian probability theory, has been shown to be less sensitive to noise compared to NLLS.6
The aim of this study is to compare three high-resolution T2-based fat quantification methods to CSEI: 1) 2-parameter NLLS, 2) 3-parameter NLLS, and 3) Bayesian probability theory.7 Low-resolution CSEI is used as reference method.
Methods
Transversal images of the left calf of ten healthy volunteers were acquired with informed consent and approval from the Regional Ethical Review Board, using a 3T scanner (Trio, Siemens Healthcare). For the T2-based imaging, 32 high-resolution multi-echo spin echo (MESE) images were acquired with matrix size=512x512, TR=2000ms, and TE1/∆TE=9.2/9.2ms. For CSEI, six multi-gradient echoes were collected with matrix sizes 512x512 and 128x128, keeping a constant field-of-view, TR=500ms, TE1/∆TE=1.11/1.56ms (128x128), TE1/∆TE=2.57/3.92ms (512x512), and flip angle=12˚.
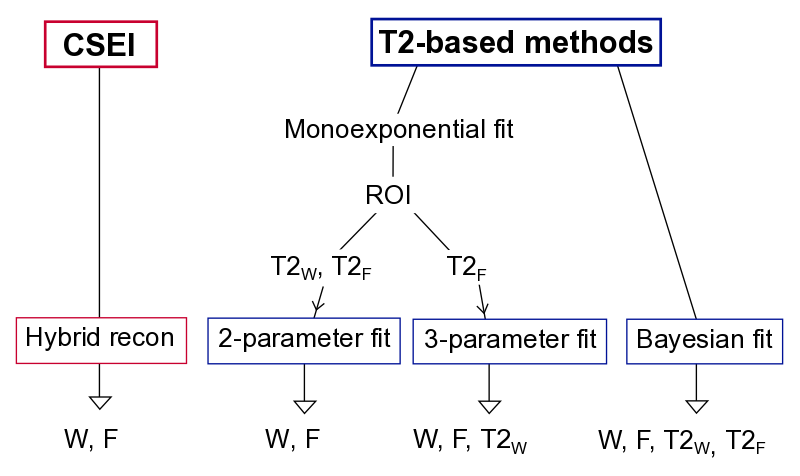
An overview of the methods is presented in Figure 1. For CSEI, a hybrid of magnitude/complex iterative water-fat separation algorithm with joint T2*-correction8 and a multi-peak fat model,9 was used. For the T2-based methods, in the 2-parameter fit, the amplitudes of water W and fat F were estimated in each voxel by keeping the individual T2F and T2W fixed in a biexponential signal model given by $$S=We^{-TE/T2_W}+Fe^{-TE/T2_F}$$ as described previously.4 In the 3-parameter fit, T2F was fixed, estimating W, F and T2W in each voxel. In the Bayesian fit,7 the signal model was given by $$S=S_0\left(\left(1-f\right)e^{-TE/T2_W}+fe^{-TE/T2_F}\right)$$ where S0 is the signal amplitude and f is the fat signal fraction of S0. S0 was obtained from a monoexponential fit before f, T2W, and T2F were estimated using MATLAB's built-in function slicesample.
The 2-parameter and the 3-parameter fit were performed using echoes 2-16, whereas echoes 2-32 were used for the Bayesian fit. To compensate for T1 bias in the MESE data, F and W were corrected using T1 values from literature10 before calculating FF. Individual T2F could not be obtained in one volunteer due to a very thin layer of subcutaneous fat. Instead, mean T2F of the rest of the volunteers was used for the 2-parameter and 3-parameter fit.
Regions-of-interest (ROIs) were drawn in the FF images, following three muscle compartments: gastrocnemius, soleus, and tibialis anterior. Wilcoxon signed-rank tests were performed to compare the high-resolution methods with reference CSEI.
Results
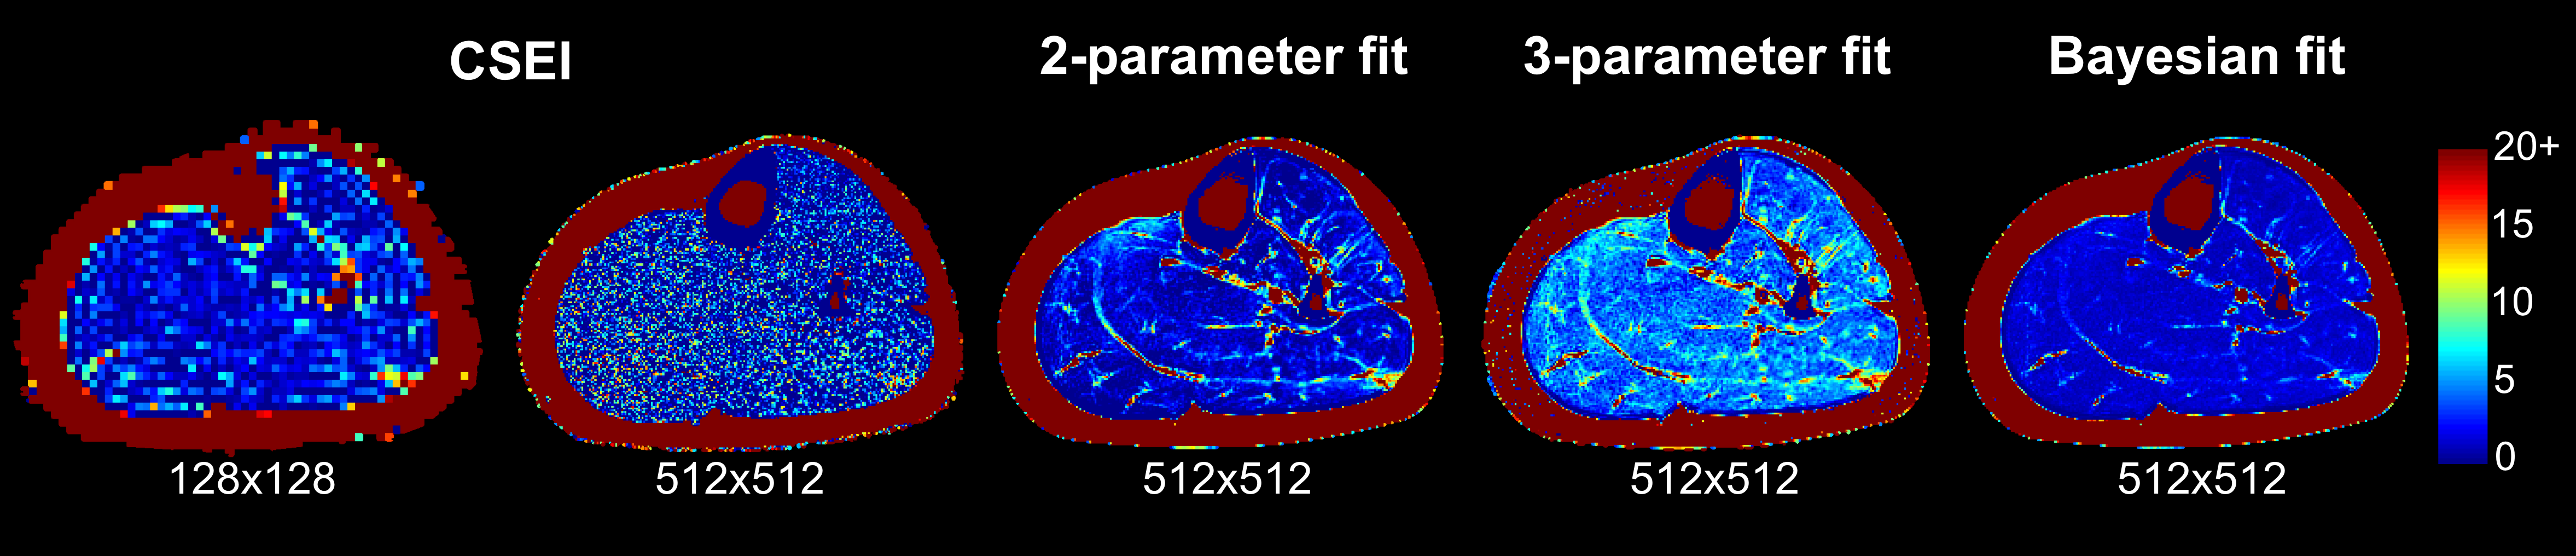
High-resolution CSEI resulted in FF images with very poor SNR, causing anatomical information to be lost (Fig. 2). In addition, results from three volunteers were excluded due to fat-water swaps. In contrast, all T2-based methods resulted in FF maps in which the separate muscle compartments are visible and the fat distribution is detectable (Fig. 2).
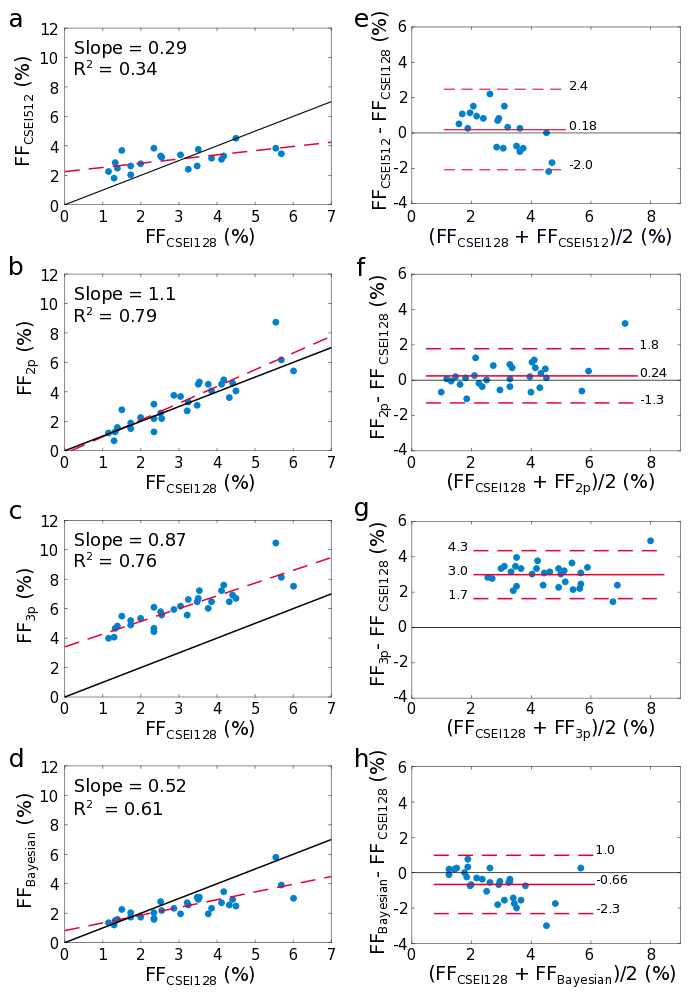
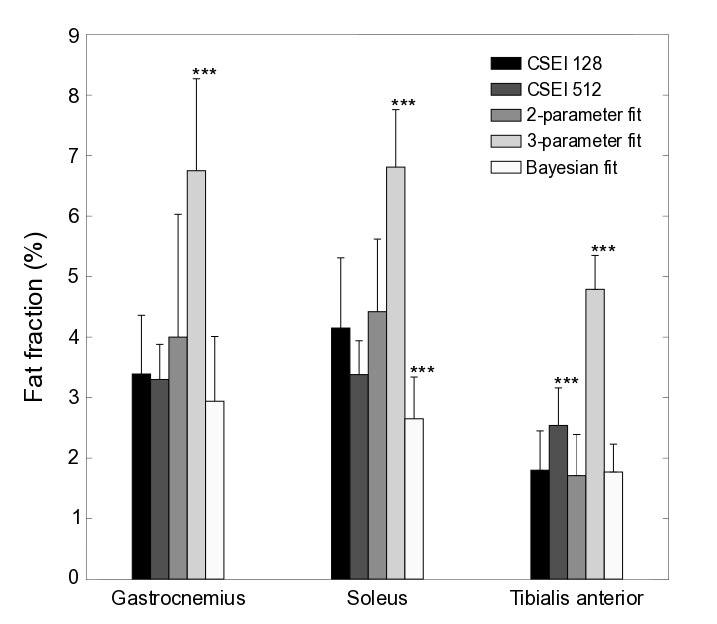
Scatter and Bland-Altman plots (Fig. 3) show that the 2-parameter fit agrees well with the reference CSEI method, the 3-parameter fit consistently overestimates the FF, and the Bayesian fit increasingly underestimates FF as FF increases, in the range of FF studied here. The 2-parameter fit shows best correspondence to the reference method while the Bayesian significantly (P≤0.001) underestimates FF in soleus, and 3-parameter fit significantly (P≤0.001) overestimates FF in all ROIs (Fig. 4).
Discussion
All T2-based methods produced qualitatively improved FF images compared to CSEI. The 2-parameter fit showed best quantitative agreement to the reference method. However, its usefulness in patient groups with edema or fat infiltration is limited due to potential difficulties obtaining unbiased ROIs for the estimation of T2F and T2W. A Bayesian probability approach is independent of ROIs and overcomes this limitation. Additional benefits are the possibility of obtaining T2W maps, which relates to disease activity,11 and that it is fully automated.Conclusion
The 2-parameter fit showed best quantitative agreement with the reference CSEI method for low FFs in the range 1-5%. This method can therefore be a useful alternative to CSEI when the latter method fails to produce high-resolution images due to low SNR or fat-water swaps.Acknowledgements
This research was supported by Magnus Bergvalls stiftelse and Direktör Albert Påhlssons stiftelse.References
1. Nardo L, Karampinos DC, Lansdown DA, et al. Quantitative Assessment of Fat Infiltration in the Rotator Cuff Muscles Using Water-Fat MRI. Journal of Magnetic Resonance Imaging 2014;39(5):1178-1185.
2. Goodpastor BH, Thaete FL, and Kelley DE. Thigh adipose tissue distribution is associated with insulin resistance in obesity and in type 2 diabetes mellitus. American Journal of Clinical Nutrition 2007;71(4):885-892.
3. Månsson S, Peterson P, Johansson E. Quantification of low fat contents: A comparison of MR imaging and spectroscopy methods at 1.5 and 3 T. Magn. Reson. Imaging 2012;30(10):1461–1467.
4. Kan HE, Scheenen TWJ, Wohlgemuth M, et al. Quantitative MR imaging of individual muscle involvement in fascioscapulohumeral muscular dystrophy. Neromuscular Disorders 2009;19(5):357- 362.
5. Kamman RL, Bakker CJG, van Dijk P, et al. Multi-exponential Relaxation Analysis with MR Imaging and NMR Spectroscopy Using Fat-Water Systems. Magnetic Resonance Imaging 1987;5(1):381-392.
6. Neil JJ and Bretthorst GL. On the Use of Bayesian Probability Theory for Analysis of Exponential Decay Data: An Example Taken from Intravoxel Incoherent Motion Experiments. Magnetic Resonance in Medicine 1993;29(5):642-647.
7. Barbieri S, Donati OF, Froehlich JM, et al. Impact of the Calculation Algorithm on Biexponential Fitting of Diffusion-Weighted MRI in Upper Abdominal Organs. Magnetic Resonance in Medicine 2016;75(5):2175-2186.
8. Yu H, Shimakawa A, Hines CDG, et al. Combination of Complex-Based and Magnitude-Based Multiecho Water-Fat Separation for Accurate Quantification of Fat-Fraction. Magnetic Resonance in Medicine 2011;66(1):199-206.
9. Ren J, Dimitrov I, Sherry AD, et al. Composition of adipose tissue and marrow fat in humans by 1H NMR at 7 Tesla. Journal of Lipid Research 2008;49(9):2055-2062.
10. Gold GE, Han E, Stainsby J, et al. Musculoskeletal MRI at 3.0 T: Relaxation Times and Image Contrast. American Journal of Roentgenology 2004;183(2):343-351.
11. Carlier PG, Marty B, Scheidegger O, et al. Skeletal Muscle Quantitative Nuclear Magnetic Resonance Imaging and Spectroscopy as an Outcome Measure for Clinical Trials. Journal of Neuromuscular Diseases 2016;3(1):1-28.
Figures