5193
Noise Properties of Proton Density Fat Fraction Estimated using Chemical Shift Encoded MRI1Radiology, University of Wisconsin - Madison, Madison, WI, United States, 2Electrical & Computer Engineering, University of Wisconsin - Madison, Madison, WI, United States, 3Medical Physics, University of Wisconsin - Madison, Madison, WI, United States, 4Medicine, University of Wisconsin - Madison, Madison, WI, United States, 5Emergency Medicine, University of Wisconsin - Madison, Madison, WI, United States, 6Biomedical Engineering, University of Wisconsin - Madison, Madison, WI, United States
Synopsis
The purpose of this work was to characterize the noise distribution of proton density fat fraction estimation and provide alternatives to averaging for unbiased estimation. Monte-Carlo simulations and phantom experiments were used to validate the theoretically derived noise distribution. Results demonstrated that at low SNR, median and Nelder-Mead fitting algorithm estimators have reduced bias compared to the mean estimator.
Introduction
Proton density fat fraction (PDFF) estimated using chemical shift-encoded MRI (CSE-MRI) is an emerging quantitative biomarker of tissue triglyceride content1,2. Further, clinically relevant PDFF thresholds are on the order of 3-6%3. Quantifying liver fat concentration with low bias and variability is of high clinical and research importance. While the noise on the MR signal and separated water and fat signals is zero mean Gaussian4, the noise distribution of PDFF, and its impact on bias and variability of PDFF estimates remains unknown. Emerging empirical evidence has demonstrated noise dependent PDFF bias in low signal-to-noise (SNR) acquisitions5. Therefore, the purpose of this work is to characterize the PDFF noise distribution and provide alternatives for its unbiased estimation.Theory
PDFF can be written as $$PDFF=\frac{F}{F+W}\quad{}\quad{}\quad{}\quad{}[1]$$ where F and W are correlated Gaussian random variables representing noisy signals from fat and water with correlation coefficient ρFW, means μF and μW, and standard deviations σF and σW, respectively. Extending on the work of Fieller-Hinkley6, we have determined that the noise distribution of PDFF estimation, from equation 1, has the form$$Pr(PDFF=z)=\frac{b(z)d(z)}{\sqrt{2\pi}\sigma_F\sigma_Ya^3(z)}[\Phi(\frac{b(z)}{a(z)\sqrt{1-\rho_{FY}^2}})-\Phi(\frac{-b(z)}{a(z)\sqrt{1-\rho_{FY}^2}})]+\frac{\sqrt{1-\rho_{FY}^2}}{\pi\sigma_F\sigma_Ya^2(z)}e^{\frac{-c}{2(1-\rho_{FY}^2)}}\quad{}\quad{}\quad{}\quad{}[2]$$where$$a(z)=\sqrt{\frac{z^2}{\sigma_F^2}-\frac{2z\rho_{FY}}{\sigma_F\sigma_Y}+\frac{1}{\sigma_Y^2}}\\b(z)=\frac{z\mu_F}{\sigma_F^2}-\frac{\rho_{FY}(\mu_F+\mu_{Y}z)}{\sigma_F\sigma_Y}+\frac{\mu_Y}{\sigma_Y^2}\\c=\frac{\mu_F^2}{\sigma_F^2}-\frac{2\mu_F\mu_Y\rho_{FY}}{\sigma_F\sigma_Y}+\frac{\mu_Y^2}{\sigma_Y^2}\\d(z)=e^{\frac{b^2(z)-ca^2(z)}{2(1-\rho_{FY}^2)a^2(z)}}\\\Phi(\lambda)=\frac{1}{\sqrt{2\pi}}\int_{-\infty}^{\lambda}e^{-\frac{\tau^2}{2}}d\tau\\$$and$$\mu_Y=\mu_F+\mu_W\\\sigma_Y=\sqrt{\sigma_F^2+\sigma_W^2+2\sigma_F\sigma_W\rho_{FW}}\\\rho_{FY}=\frac{\sigma_F^2+\sigma_F\sigma_W\rho_{FW}}{\sigma_F\sqrt{\sigma_F^2+\sigma_W^2+2\sigma_F\sigma_W\rho_{FW}}}.\\$$
Methods
Numerical, physical phantom and in vivo studies were performed to validate the theoretical noise distribution of PDFF estimation. Further, we used these experiments to evaluate the performance of two estimators, median and Nelder-Mead fitting algorithm7 (NMFA), to minimize noise related bias, compared to the mean estimator. In each experiment, the mean, median and NMFA estimates were compared to a known reference PDFF value (simulated truth or high-SNR acquisition).
Phantom Experiment:
Sequential 3D-CSE-MRI acquisitions of a water phantom (PDFF=0%) on a 1.5T MRI (HDxt, GE Healthcare) were acquired with decreasing SNR (adjusted empirically).
Numerical Simulations:
First, Monte-Carlo simulations of CSE-MRI (#TE=6, TE1=1.2ms, ΔTE=2ms, B0=1.5T) based on the signal model proposed by Yu et al8, were performed to generate 10,000 simulated PDFF values over a range (0-100%) of PDFF and SNR (1-30).
In a second numerical experiment, Monte-Carlo simulations of CSE-MRI, with identical parameters, were performed to generate 200 simulated PDFF maps. ROIs were drawn in 20 regions of varying PDFF (0-100%) and PDFF estimates were made. These simulations were performed with SNR=3 and 5.
Phantom Experiments:
In an agar-based phantom of varying PDFF concentration (0-100%)9 one hundred repeated 2D-CSE-MRI acquisitions were performed on a 1.5T MRI (450W, GE Healthcare) with a single-channel head coil. Scan parameters were adjusted empirically to obtain approximate SNR of 3(5), with the following parameters: in-plane resolution=0.9x0.9mm, slice=4(8)mm, #TE=6, TE1=2.1(2)ms, ∆TE=2.5(2.4)ms, flip angle=5o, BW=±125kHz. A reference acquisition with SNR=70 was acquired by averaging 100 acquisitions with similar parameters.
Next, a confounder-corrected CSE-MRI algorithm10 was used to estimate PDFF maps from the acquired data. Estimates from ROIs drawn within each of the 11 vials of the PDFF maps were taken and compared to the SNR=70 case.
In Vivo Experiments:
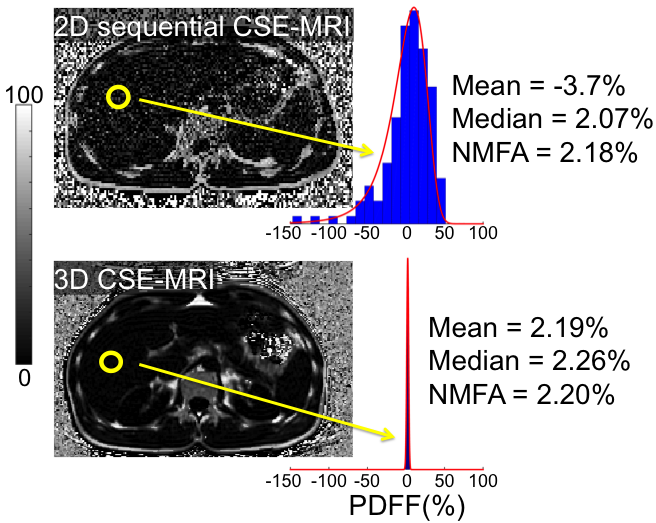
At 3T MRI (MR750, GE Healthcare), low-SNR images of a healthy liver were acquired using a 2D-sequential CSE-MRI acquisition11 and compared to a high-SNR 3D-CSE-MRI acquisition. PDFF estimates from ROIs in the high and low-SNR PDFF maps were compared.
Results
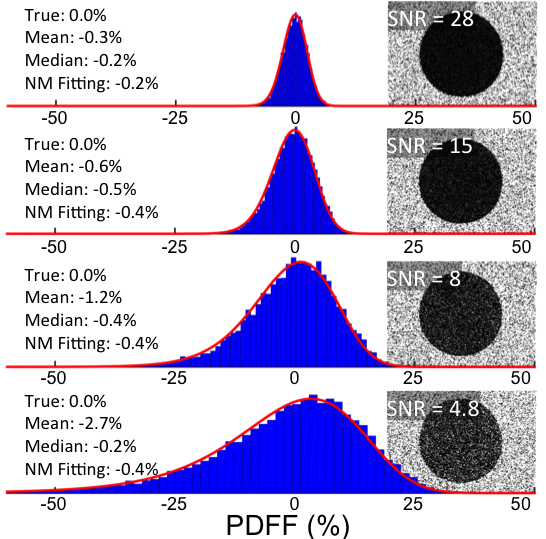
Results from the water phantom experiment (Figure 1) verified the presence of the asymmetric PDFF noise distribution obtained theoretically.
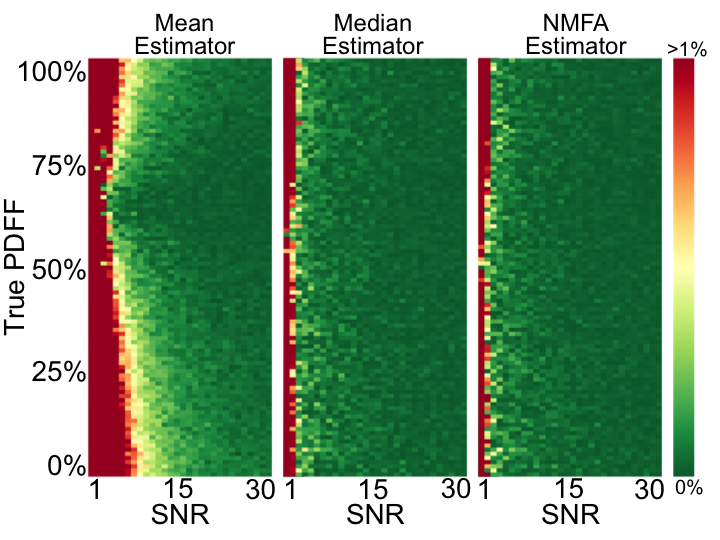
Results from the first Monte-Carlo simulation (Figure 2), demonstrate how estimating PDFF from the mean of pixels in an ROI leads to bias. However, significantly reduced bias can be achieved by using median or NMFA estimators.
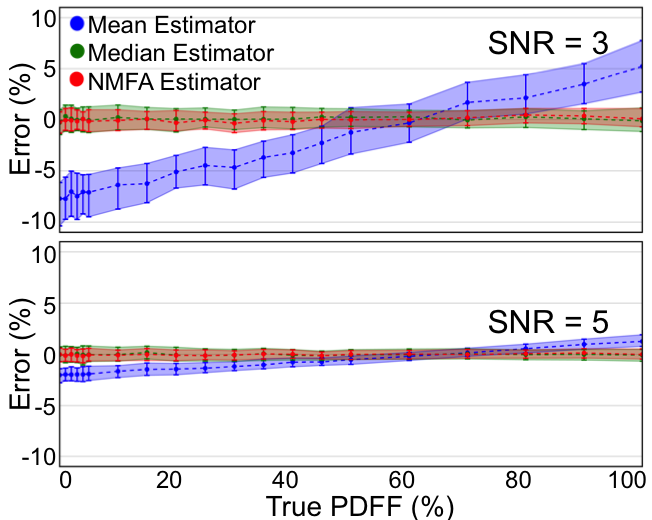
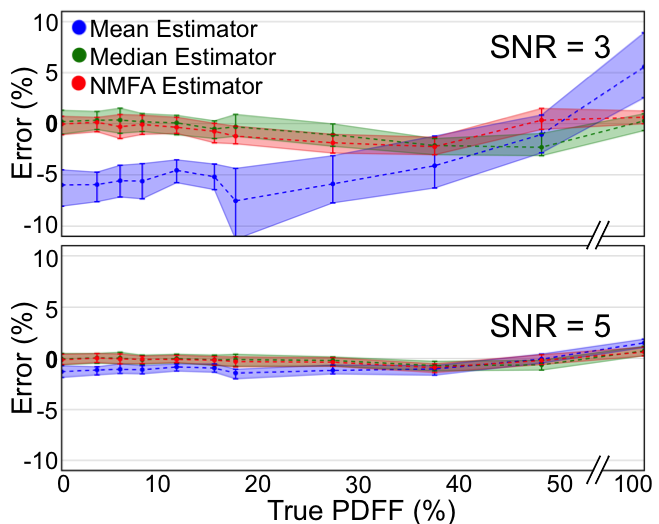
Results from the second Monte-Carlo simulation (Figure 3) further demonstrate significant PDFF dependent bias of the mean estimator in a PDFF map ROI. Again, this bias is mitigated when using the median or NMFA estimators. Experiments in the agar-based PDFF phantom (Figure 4) confirm the Monte-Carlo simulation results, over a wide range of PDFF values.
Finally, an in vivo example from a healthy subject demonstrates that both the median and NMFA estimators reduce noise-related bias on PDFF estimation (Figure 5).
Discussion
In this work, we successfully derived the noise distribution of PDFF in the presence of Gaussian noise. We validated this derivation with both numerical and phantom experiments.
Further, we demonstrated that the mean estimator from an ensemble of PDFF values (eg. from within an ROI) is biased at low-SNR. One obvious solution is to set scan parameters to ensure high-SNR performance. However, since some emerging applications are inherently low-SNR (eg: motion-robust fat quantification or in the presence of iron overload), we demonstrated that using a median estimator or fitting the data to the derived PDFF noise distribution using the NMFA significantly reduces noise-related bias, even at low-SNR. Further work is needed to determine the utility of these strategies in vivo.
Acknowledgements
The authors wish to acknowledge support from the NIH (UL1TR00427, R01 DK083380, R01 DK088925, R01 DK100651, K24 DK102595), as well as GE Healthcare.
References
1. Szczepaniak, L. S., P. Nurenberg, D. Leonard, J. D. Browning, J. S. Reingold, S. Grundy, H. H. Hobbs and R. L. Dobbins (2005). "Magnetic resonance spectroscopy to measure hepatic triglyceride content: prevalence of hepatic steatosis in the general population." Am J Physiol Endocrinol Metab 288(2): E462-468.
2. Rehm, J. L., P. M. Wolfgram, D. Hernando, J. C. Eickhoff, D. B. Allen and S. B. Reeder (2015). "Proton density fat-fraction is an accurate biomarker of hepatic steatosis in adolescent girls and young women." Eur Radiol 25(10): 2921-2930.
3. Tang, A., A. Desai, G. Hamilton, T. Wolfson, A. Gamst, J. Lam, L. Clark, J. Hooker, T. Chavez, B. D. Ang, M. S. Middleton, M. Peterson, R. Loomba and C. B. Sirlin (2015). "Accuracy of MR imaging-estimated proton density fat fraction for classification of dichotomized histologic steatosis grades in nonalcoholic fatty liver disease." Radiology 274(2): 416-425.
4. Yu, H., Reeder, S. B., Shimakawa, A., Gold, G. E., Pelc, N. J., & Brittain, J. H. (2004). Implementation and noise analysis of chemical shift correction for fast spin echo Dixon imaging. In The International Society of Magnetic Resonance 12th Meeting (p. 2686).
5. Holmes JH, Hernando D, Wang K, Shimakawa A, Roberts N, Reeder SB. Analysis of Bias with SNR in Multi-echo Chemical Shift Encoded Fat Quantification. International Society for Magnetic Resonance in Medicine Annual Meeting 2016. Singapore, Asia. May 7, 2016.
6. Hinkley, D. V. (1969). On the ratio of two correlated normal random variables. Biometrika, 56(3), 635-639.
7. Nelder, J. A., & Mead, R. (1965). A simplex method for function minimization. The computer journal, 7(4), 308-313.
8. Yu, H., A. Shimakawa, C. A. McKenzie, E. Brodsky, J. H. Brittain and S. B. Reeder (2008). "Multiecho water-fat separation and simultaneous R2* estimation with multifrequency fat spectrum modeling." Magn Reson Med 60(5): 1122-1134.
9. Hines, C. D., Yu, H., Shimakawa, A., McKenzie, C. A., Brittain, J. H., & Reeder, S. B. (2009). T1 independent, T2* corrected MRI with accurate spectral modeling for quantification of fat: Validation in a fat-water-SPIO phantom. Journal of Magnetic Resonance Imaging, 30(5), 1215-1222.
10. Hernando, D., C. D. Hines, H. Yu and S. B. Reeder (2012). "Addressing phase errors in fat-water imaging using a mixed magnitude/complex fitting method." Magn Reson Med 67(3): 638-644.
11. Ruby JA, Hernando D, Campo C, Shimakawa A, Vigen K, Holmes JH, Wang K, Reeder SB. Motion Insensitive Quantification of Liver Proton Density Fat-Fraction Using a Single-Shot Sequential 2D Technique. E-Poster. International Society for Magnetic Resonance in Medicine Annual Meeting 2016. Singapore, Asia. May 11, 2016. Program Number 3836.
Figures