5190
How accurately can fat be quantified? A Bayesian View1Philips Healthcare, Beijing, People's Republic of China, 2Department of Radiology, Beijing Jishuitan Hospital
Synopsis
An error analysis was carried, under frame work of Bayesian probability theory, for fat quantification using multiple gradient echo sequences to separate water and fat content in MRI signal. The results confirm that this method is accurate when protocols are carefully designed; this analysis also provides guideline in designing parameter settings to achieve optimal accuracy in fat quantification measurements.
Introduction
Several major MRI system vendors are providing sequences and reconstruction technology for liver fat quantification, such as mDIXON quant[1]. These MRI methods acquire images using multiple gradient refocusing sequence[2]. The technology is based on DIXON fat-water separation method[1,2,3], which takes consideration of water and fat’s Larmor frequency difference in MRI signal. Accuracy studies have been carried by experiments as well as Monte-Carlo simulations since the beginning of this technology development [3, 4,5] . Less than 3% (roughly) error in measuring liver fat are claimed by each MRI vendor, and is approved by FDA. Still the question of fat quantification accuracy remains due to the frustrative experience in MR spectroscopy (MRS) among radiologists.
Herein we use the Bayesian theory based on joint posterior probability [6] to exam the accuracy in mDIXON quant and related methods. Based on the guidance of accuracy study, we can further optimize sequence for fat quantification in other applications and researches.
Methods and Simulation
The basic quantity in Bayesian approach for parameter fitting (error) estimation is the joint posterior probability. Multiple gradient echo sequence acquisition scheme is restricted to evenly spaced echo times only. In this study we assumed noise level the same (SNR = 50 for 1st echo images) for images acquired at each gradient echo time. To avoid unnecessary complexity and arguments, we also assume noise level doesn’t change with different echo spacing (ΔTE). Least square fitting methods based on signal models depicting complex data as well as magnitude data are both tested.
Then we exam the how do the key parameters - TE's and TR(reflected by number of echoes) - impact fat fraction accuracy.
Results
The fitting error is found to be smaller with bigger fat fraction as shown in Figure 1. The fitting algorithm based on complex number indicates that echo spacing should not be close to 2.3ms (and multiples of 2.3ms) to avoid cycling of in-phase and out-phase phenomenon (Fig.1 a). Similarly, TE for the first echo shall be around 1.2ms for least error (Fig.1 2a). The fitting method using magnitude data model shows a local minimum around 1.5ms for echo spacing (Fig.1 1b). There is another trough value with echo spacing longer than 2.5ms, however, this might come from the Bayesian kernel where complex analytical functions were generated to mimic magnitude signal model derivatives. Also we observed a optimal accuracy when 1st echo TE is set 1.3ms (Fig.1 2b).
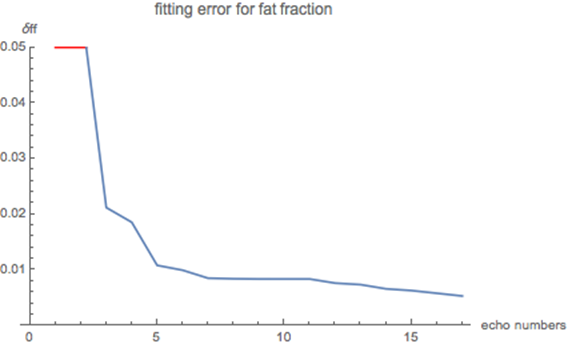
The error in fat quantification reduces fast until number of gradient echoes increased to about 7. Thus long scan time with more gradient echoes are unnecessary; for studies to finish fat quantification scan within one breath, less than 8 echoes shall do very well.
Conclusion and discussion
Indeed we found that, with proper scanning protocol the fat quantification methods have error less than 3%, which agrees with other studies and researches. However, careful protocol settings are critical in applying this method to achieve good measurements. Complex number fitting result shows smaller fitting error than magnitude fitting under this Bayesian analysis framework, this is due to same SNR was assumed for both input data. However, B0 artifacts due to susceptibility jeopardize the effective SNR when phase of complex data has to be taken account. The magnitude fitting shall still be a superior option in most clinical applications.Acknowledgements
No acknowledgement found.References
[1]. Kukuk, GM. et al., Comparison between modified Dixon MRI techniques, MR spectroscopic relaxometry, and different histologic quantification methods in the assessment of hepatic steatosis. Eur Radiol. 2015 Oct;25(10):2869-79
[2]. Yu H. et al, Multiecho water-fat separation and simultaneous R2* estimation with multifrequency fat spectrum modeling. Magn Reson Med. 2008 Nov;60(5):1122-34.
[3]. Nozaki T, et al. Quantification of Fatty Degeneration Within the Supraspinatus Muscle by Using a 2-Point Dixon Method on 3-T MRI. Ajr American Journal of Roentgenology. 2015; 205(1):116-122.
[4]. Kijowski, R., et al., Improved fat suppression using multipeak reconstruction for DEAL chemical shift fat-water separation: Application with fast spin echo imaging. Journal of Magnetic Resonance Imaging, 2009. 29(2): p. 436-442.
[5]. Tang A. et al., Accuracy of MR imaging-estimated proton density fat fraction for classification of dichotomized histologic steatosis grades in nonalcoholic fatty liver disease. Radiology. 2015 Feb;274(2):416-25
Figures