5189
Using a general model or measuring the intramuscular lipid spectrum: impact on the fat infiltration quantification in skeletal muscle1NMR Laboratory, Institute of Myology, Paris, France, 2CEA, DRF, I²BM, MIRCen, Paris, France
Synopsis
The purpose of this work was to study the impact of fat model on the quantification of fatty infiltration in skeletal muscle. To this end, we acquired multi-echo 1H-NMRS from 23 subjects affected by an inflammatory myopathy and measured the lipid spectrum of each subject. We also acquired 3D gradient echo volumes at different TEs. Fat and water maps were reconstructed in two cases: (i) with a unique mean fat model (ii) with a fat model specific to each subject. The results of comparison showed a good agreement between both methods and the difference never exceeded 4%.
Purpose
In neuromuscular disorders, fatty infiltration constitutes one of the major chronic degenerative changes that can develop as an end-stage remodeling of a diseased muscle. Robust quantification of fatty infiltration by NMRI was made possible through the development of quantitative fat/water imaging methods that rely on the chemical shift differences between both components. Beyond the standard Dixon1 technique which relies on the assumption that the lipid spectrum is composed of one resonance, many modern variants take into account the multi-resonance lipid spectrum2,3. In practice and to reduce acquisition time, a unique pre-calibrated lipid spectrum can be used. The purpose of this abstract is to investigate the inter-subject differences in lipid spectra and the consequences of the use of a pre-calibrated lipid spectrum on the fat quantification outcome.METHOD
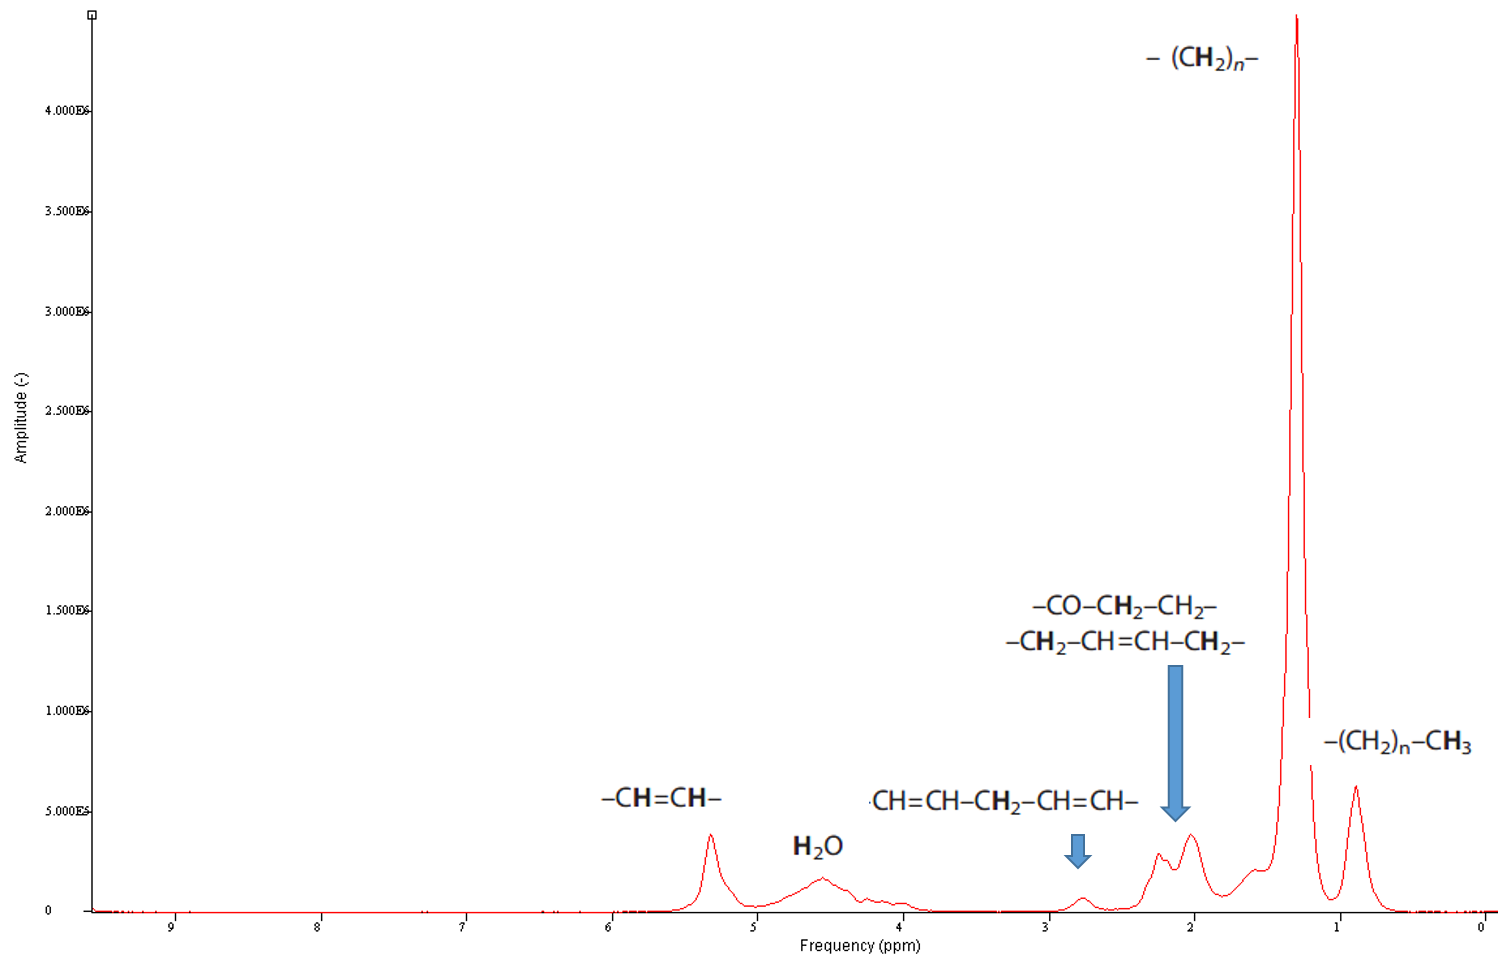
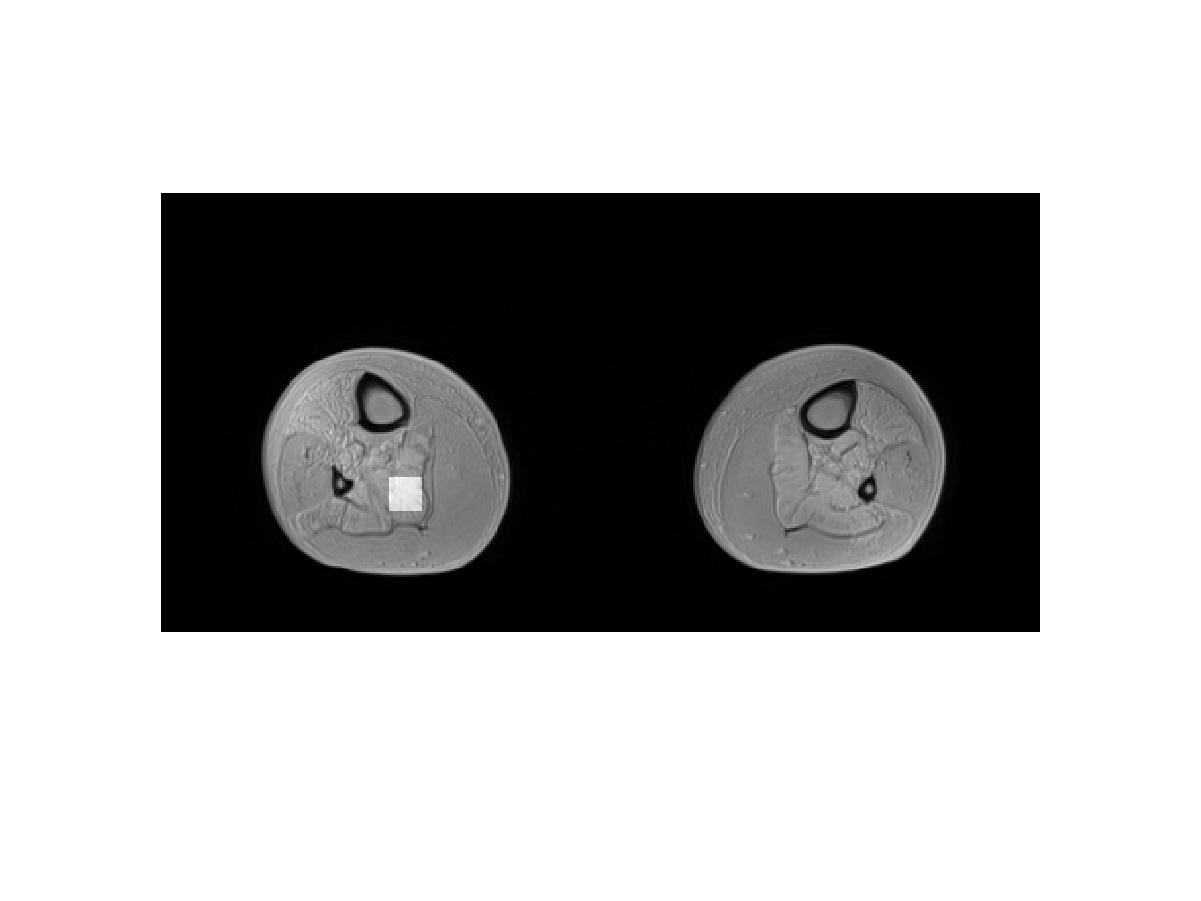
Data acquisition : We scanned the lower limbs of 23 patients with an inflammatory myopathy. The NMR protocol included (1) 1H-NMRS single voxel STEAM acquisition (14 TEs, TR=6500 ms, NA=4) in different muscles in the lower and upper legs (an example of a lipid spectrum is given in Fig.1) (2) 3D gradient echo volumes with (TR=10ms, TE=2.75/3.95/5.15 ms, flip angle=3°) and with Field-of-View equal to 224x448x320 mm3 and a voxel size of 1x1x5 mm3. Data reconstruction: First, using the AMARES algorithm (jMRUI)4, we quantified the frequency and the amplitude of the water and all lipid resonances at each echo time. Water and lipid resonances were corrected for T2 effects by mono-exponential fit of each resonance. Then, we derived a spectral model as well as a fat fraction (FF) for each patient. We also computed a mean lipid spectrum as a weighted mean of each individual spectrum value using the spectroscopic FF as a weighting factor. Fat and water maps were reconstructed from the 3D gradient echo volumes using the technique based on restricted field maps5. For each subject, the reconstruction was run twice: (i) with the mean fat model and (ii) with the fat model specific to the subject. Data analysis: Region of interests were drawn on the fat maps at the position where 1H-NMRS was performed (Fig.2) and mean FF value was computed. FF obtained with 1H-NMRS and FF obtained by imaging (with both fat models) were correlated. FF obtained with the two reconstruction strategies were also compared.RESULTS
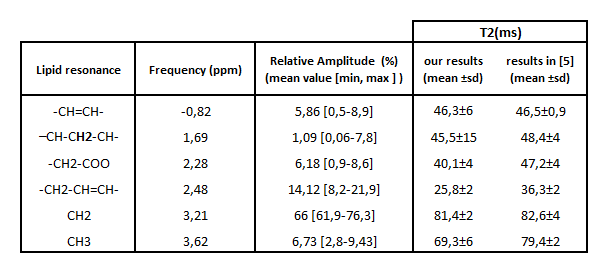
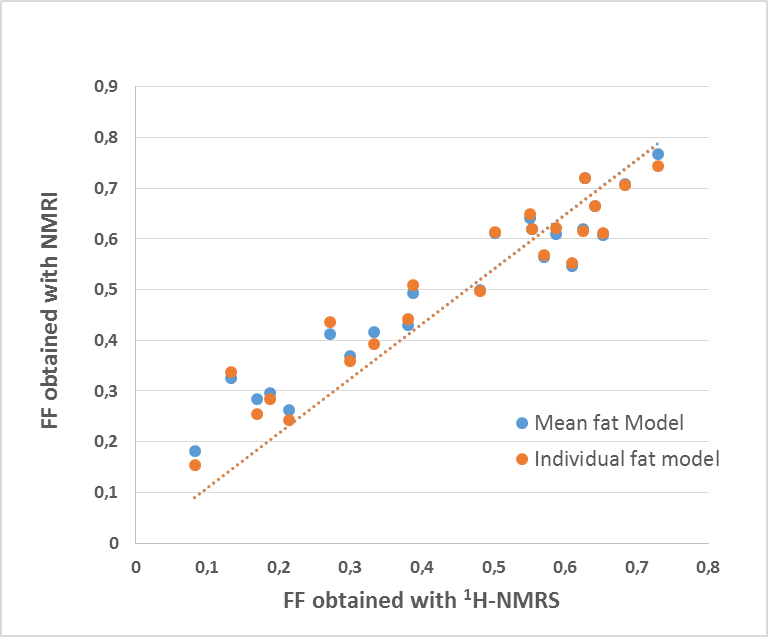
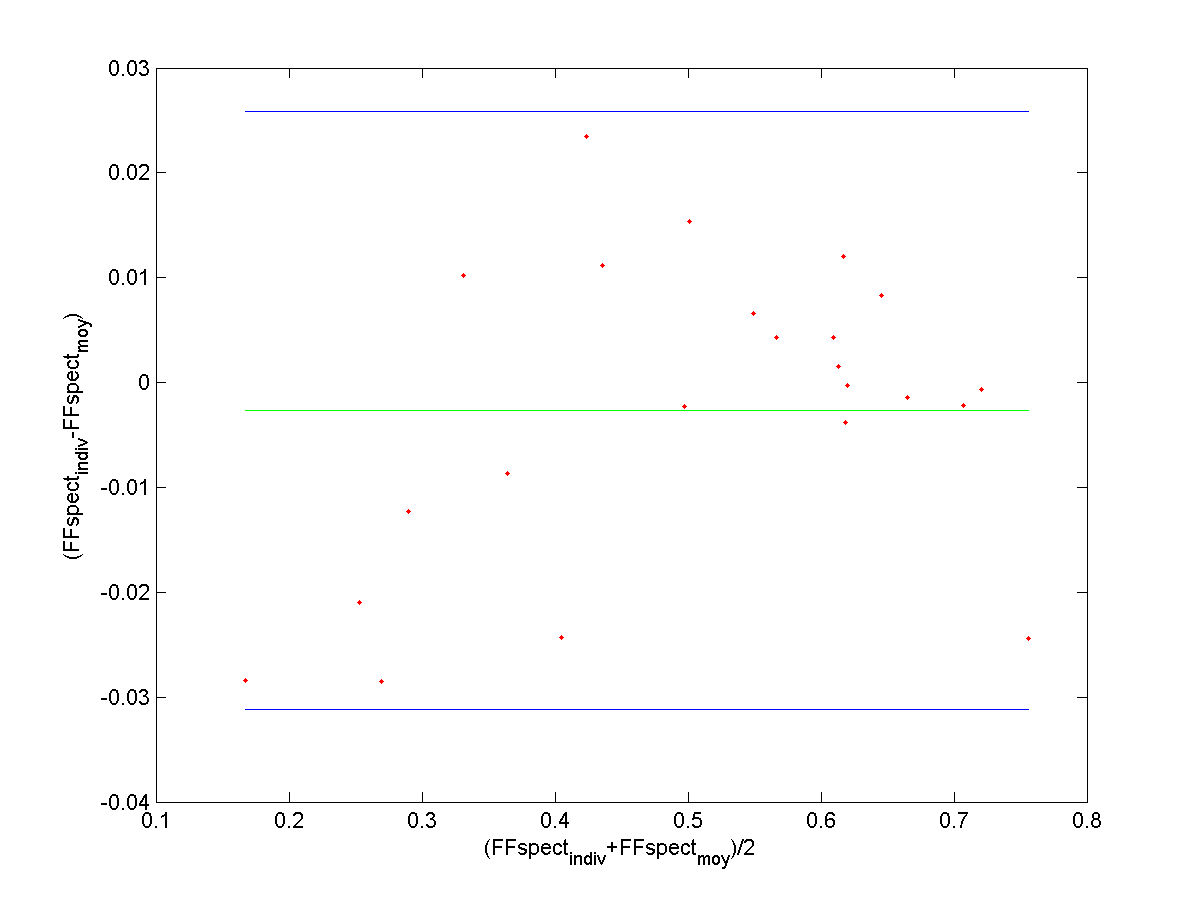
In Table 1, T2 values and the relative amplitudes of each fat resonance are reported. Fig.3 shows the relation between the FF derived from 1H-NMRS and the one from NMRI. They were highly correlated with a slope close to 1. To evaluate the impact of differences in lipid spectrum composition, we built Bland-Altman plots (Fig.4). Agreement limits are in the order of 3%.Discussion
T2 values for all lipid resonances were in agreement with the values obtained with 1H- NMRS in the subcutaneous fat of healthy volunteers6 except for the resonances at 2.48 and 3.62 ppm. These components are hard to quantify, which may explain the discrepancy between results. The agreement between FF obtained with NMRI and 1H-NMRS was an additional proof that imaging is a reliable tool to access the fatty infiltration. Regarding the impact of the fat model on the quantification, it is important to note that to obtain a specific fat model for each subject, one has to acquire additional 1H-NMRS data or more than three images at different echoes times (7 echoes for 6 resonance). The two options will result in longer acquisition times. Our results showed that the difference between FF resulting from the use of a unique fat and the one resulting from the use of a specific fat model for each subject is small. This difference might be accepted in practice mainly to avoid additional acquisitions. Similar results were reported for the liver7. The discrepancy between the two methods for muscles with little amount of fat may be explained by the fact that it is hard to quantify the amplitude of each lipid resonance in these cases.Conclusion
FF computed using a mean fat model was in a close agreement with the FF obtained with a fat model specific to each subject as well as FF obtained with 1H-NMRS. These findings suggest that in most applications fatty infiltration can be accurately assessed using only a three echoes acquisition.Acknowledgements
No acknowledgement found.References
1. Glover GH, Schneider E. Three-point Dixon technique for true water/fat decomposition with B0 inhomogeneity correction. Magn. Reson. Med. 1991;18(2):371-83.
2. Hernando D, Liang Z-P, Kellman P. Chemical shift-based water/fat separation: a comparison of signal models. Magn. Reson. Med. 2010;64(3):811-822.
3. Yu H, McKenzie C a, Shimakawa A, et al. Multiecho reconstruction for simultaneous water-fat decomposition and T2* estimation. Magn. Reson. Imaging 2007;26(4):1153-1161.
4. Vanhamme L, van den Boogaart A, Van Huffel S. Improved method for accurate and efficient quantification of MRS data with use of prior knowledge. Magn. Reson. Imaging 1997;129(1):35-43.
5. Sharma SD, Hu HH, Nayak KS. Accelerated water-fat imaging using restricted subspace field map estimation and compressed sensing. Magn. Reson. Med. 2012;67(3):650-659.
6. Peterson P, Månsson S. Simultaneous quantification of fat content and fatty acid composition using MR imaging. Magn. Reson. Med. 2013;69(3):688-97.
7. Reeder SB, Robson PM, Yu H, et al. Quantification of hepatic steatosis with MRI: the effects of accurate fat spectral modeling. Magn. Reson. Imaging 2009;29(6):1332-1339.
Figures