5186
Quantitative Liver Fat Measurements in Obese Adolescents: Comparison between using MR Spectroscopy and Chemical-shift Water-fat Fat-fraction Techniques1Department of Imaging and Interventional Radiology, The Chinese University of Hong Kong, Hong Kong, Hong Kong
Synopsis
Liver fat contents measured by magnetic resonance spectroscopy and chemical-shift water-fat separation imaging were compared in a group of obese adolescents. Distribution of fat in left and right liver lobes was also compared. Results demonstrated that fat contents obtained from both MR modalities were highly correlated and agreed to each other. In obese adolescents with non-alcoholic fatty liver disease, fat distribution was non-uniform between left and right lobes. This study supports the use of fat-fraction map to measure liver fat, which can shorten the scanning time by acquiring information about body adipose tissue and liver fat within a single sequence.
PURPOSE
Non-alcoholic fatty liver disease (NAFLD) is associated with obesity and it increases the risk of insulin resistance, dyslipidemia, and other cardiovascular diseases (1). Steatosis of liver is the most common presentation of NAFLD and the current gold standard of steatosis diagnosis is conducted by percutaneous liver biopsy followed by histological imaging (2). Magnetic resonance spectroscopy (MRS) is an alternative approach to non-invasively measure liver fat and is widely accepted as an accurate method (3-5). The main objective of this study was to compare liver fat contents measured by MRS and chemical-shift water-fat MRI, and the second objective was to compare liver fat contents between left and right hepatic lobes to verify whether there was heterogeneity in liver fat distribution.METHODS
RESULTS
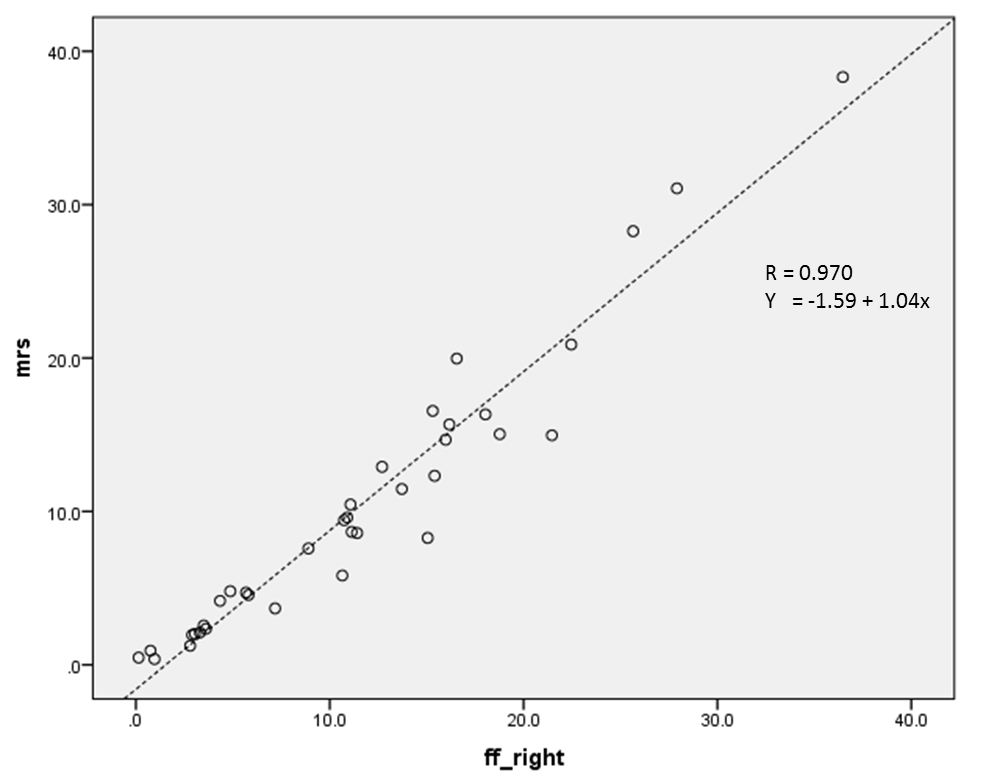
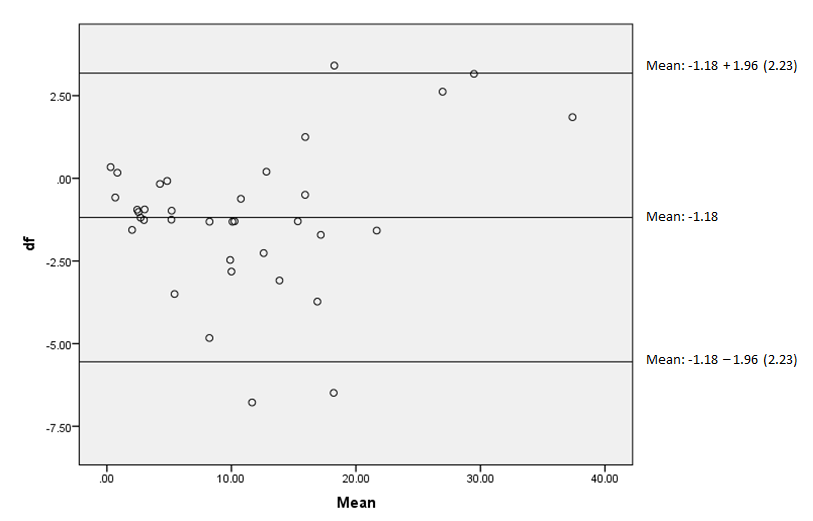
Average liver fat content of all volunteers obtained from MRS and chemical-shift water-fat imaging were 10.4% ± 9.0% and 11.5% ± 8.4%, respectively. Twenty-two out of thirty-six volunteers had NAFLD based on MRS results. Pearson correlation coefficient indicated both measurements were significantly correlated (p<0.01) with R = 0.97 (Figure 2). Bland-Altman plot indicated majority of the results laid within the 95% limit of agreement (Figure 3).
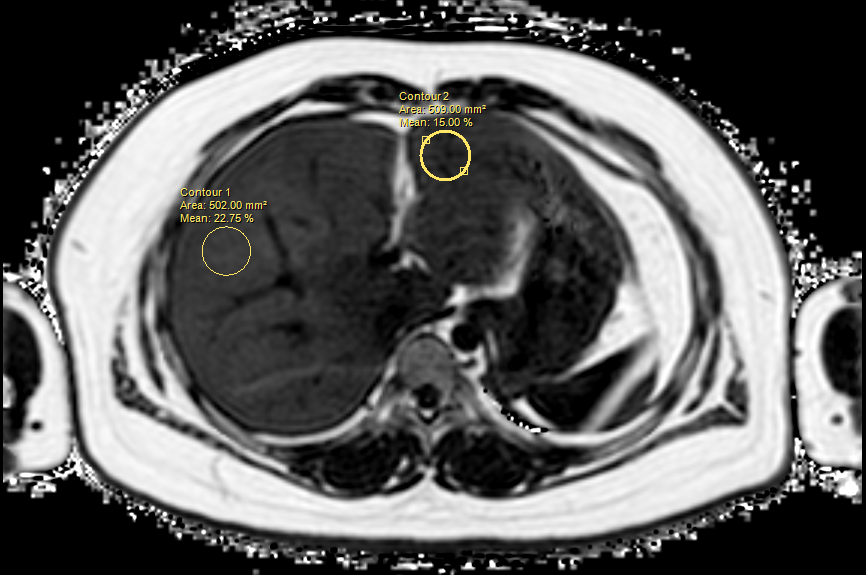
Liver fat comparison between left and right liver lobes was conducted in the NAFLD group of 22 volunteers and the non-NAFLD group of 14 volunteers based on MRS results. In the NAFLD group, the difference of liver fat between left lobe (12.6% ± 5.3%) and right lobe (16.7% ± 6.7%) was significant (p=0.034) but not in the non-NAFLD group (p=0.114).
DISCUSSION
Results from this study confirmed that liver fat
contents could be accurately measured using fat-fraction map from the gradient
multi echo-based MRI. It would be beneficial to volunteers by shortening
scanning time and researchers to collect images from one single sequence that
could be used to assess body fat volume and liver fat contents. Results also
indicated that liver fat contents measured from fat-fraction map would be
overestimated by 1.18% compared to MRS as shown in figure 3. Furthermore, in
patients with NAFLD, non-uniform distribution of liver fat was observed as
right lobe accumulated higher fat contents. One potential explanation would be
the preferential distribution of blood to the right hepatic lobe, via the
portal vein preceded by superior mesenteric vein which received blood rich in
nutrients from the gastrointestinal tract.
CONCLUSION
Liver fat contents can be accurately measured fat-fraction map obtained from water-fat separation sequence. In NAFLD group, non-uniform liver fat distribution was observed between left and right liver lobes.
Acknowledgements
No acknowledgement found.References
1. Fabbrini E, Sullivan S, Klein S. Obesity and nonalcoholic fatty liver disease: biochemical, metabolic, and clinical implications. Hepatology 2010;51(2):679-689.
2. Reeder SB, Cruite I, Hamilton G, Sirlin CB. Quantitative assessment of liver fat with magnetic resonance imaging and spectroscopy. J Magn Reson Imaging 2011;34(4):729-749.
3. Thomsen C, Becker U, Winkler K, Christoffersen P, Jensen M, Henriksen O. Quantification of liver fat using magnetic resonance spectroscopy. Magnetic resonance imaging 1994;12(3):487-495.
4. Rehm JL, Wolfgram PM, Hernando D, Eickhoff JC, Allen DB, Reeder SB. Proton density fat-fraction is an accurate biomarker of hepatic steatosis in adolescent girls and young women. European radiology 2015;25(10):2921-2930.
5. Szczepaniak LS, Nurenberg P, Leonard D, Browning JD, Reingold JS, Grundy S, Hobbs HH, Dobbins RL. Magnetic resonance spectroscopy to measure hepatic triglyceride content: prevalence of hepatic steatosis in the general population. American journal of physiology Endocrinology and metabolism 2005;288(2):E462-468.
6. Neuschwander-Tetri BA, Caldwell SH. Nonalcoholic steatohepatitis: summary of an AASLD Single Topic Conference. Hepatology 2003;37(5):1202-1219.
7. Tolman KG, Dalpiaz AS. Treatment of non-alcoholic fatty liver disease. Therapeutics and clinical risk management 2007;3(6):1153-1163.
Figures