5182
Fat tissue mimics for validation of magnetic resonance thermometry1Physical Measurement Laboratory, National Institute of Standards and Technology, Boulder, CO, United States, 2High Precision Devices Inc., Boulder, CO, United States, 3Department of Radiology, University of Colorado School of Medicine, Denver, CO, United States, 4Applied Chemicals and Materials Division, National Institute of Standards and Technology, Boulder, CO, United States
Synopsis
Phase-based magnetic resonance thermometry is used for monitoring minimally invasive ablation therapies like focused ultrasound therapy. MRT is prone to errors when applied in tissues with high fat content (e.g. breast tissue, fatty liver) due to heat-induced susceptibility changes. Therefore, there is a need for developing well characterized adipose tissue mimics that could serve as standards for validation of MRT techniques. In this study we showed that all measured adipose tissue mimics are representative of human adipose tissue with similar chemical spectra and thermal dependence of susceptibility shift and are reproducible standards for human adipose tissue validation MRI techniques.
PURPOSE
Heat-induced susceptibility changes occur when MR-thermometry (MRT) is applied to tissues with high fat content resulting in errors in the temperature measurement.1 To improve accuracy of MRT in the human tissues, reliable knowledge of fat temperature dependence is a prerequisite. There is a need for well-characterized fat tissue standards with chemical and MR properties similar to human fat tissue (human-Fat).2 This study aims to evaluate several potential human-Fat mimics, specifically examining the thermal dependence of their chemical spectra and magnetic susceptibility.METHODS
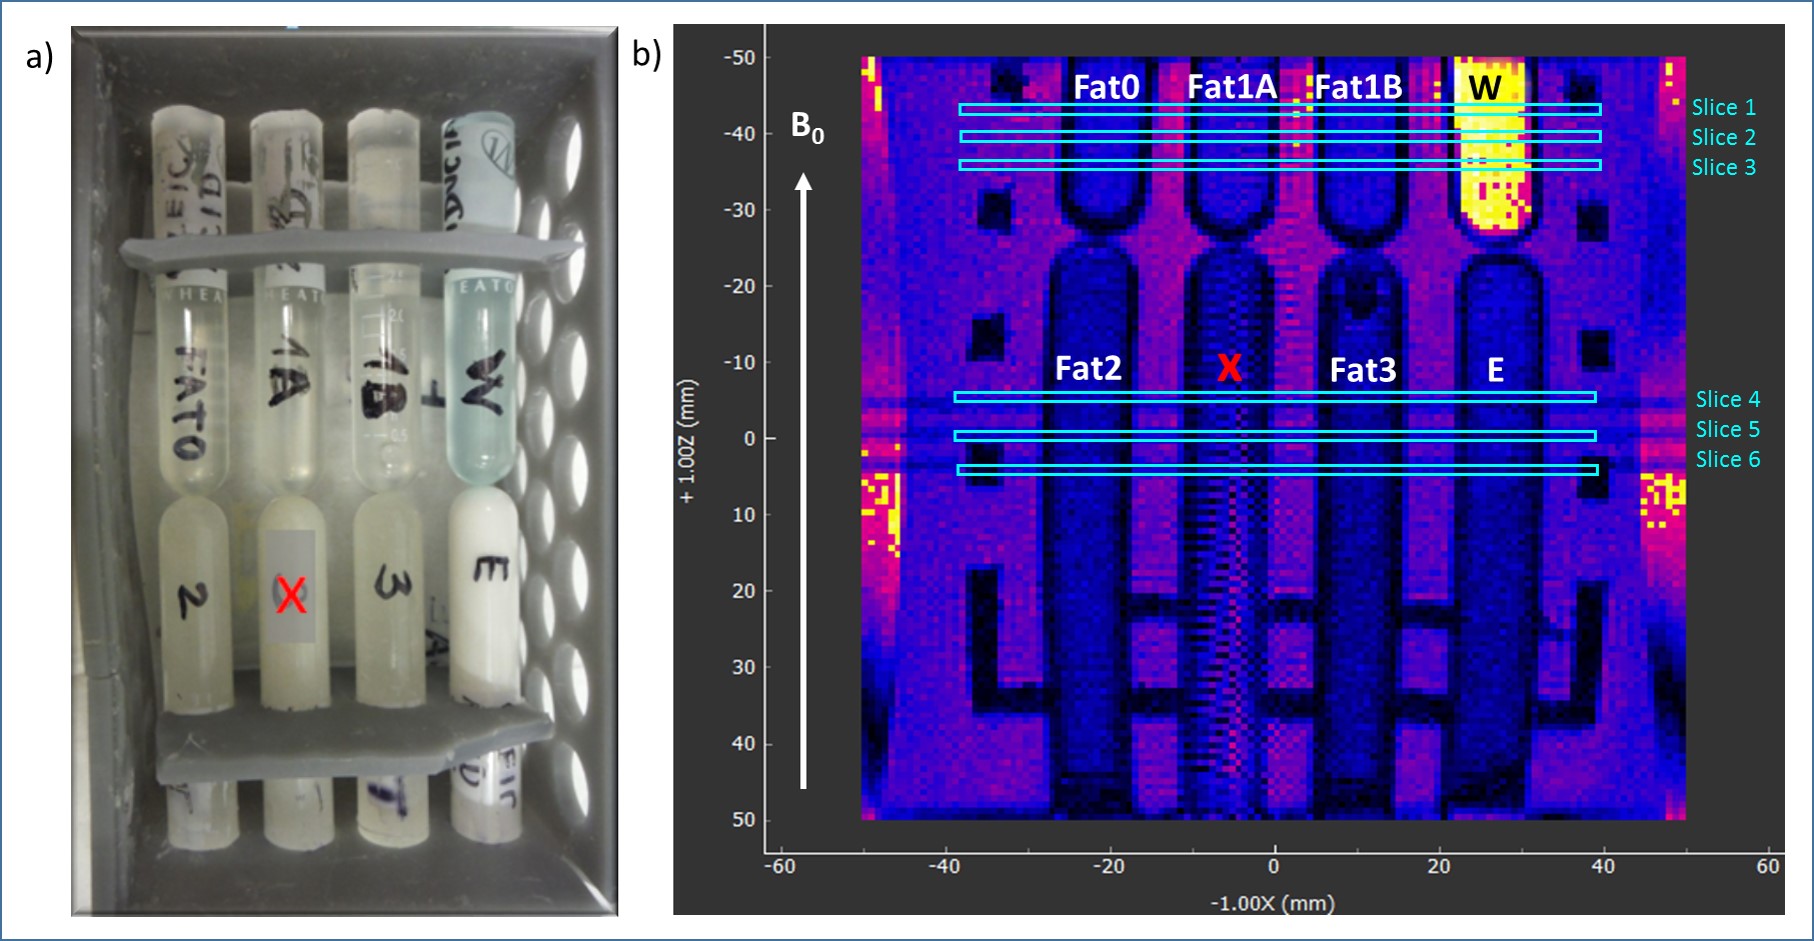
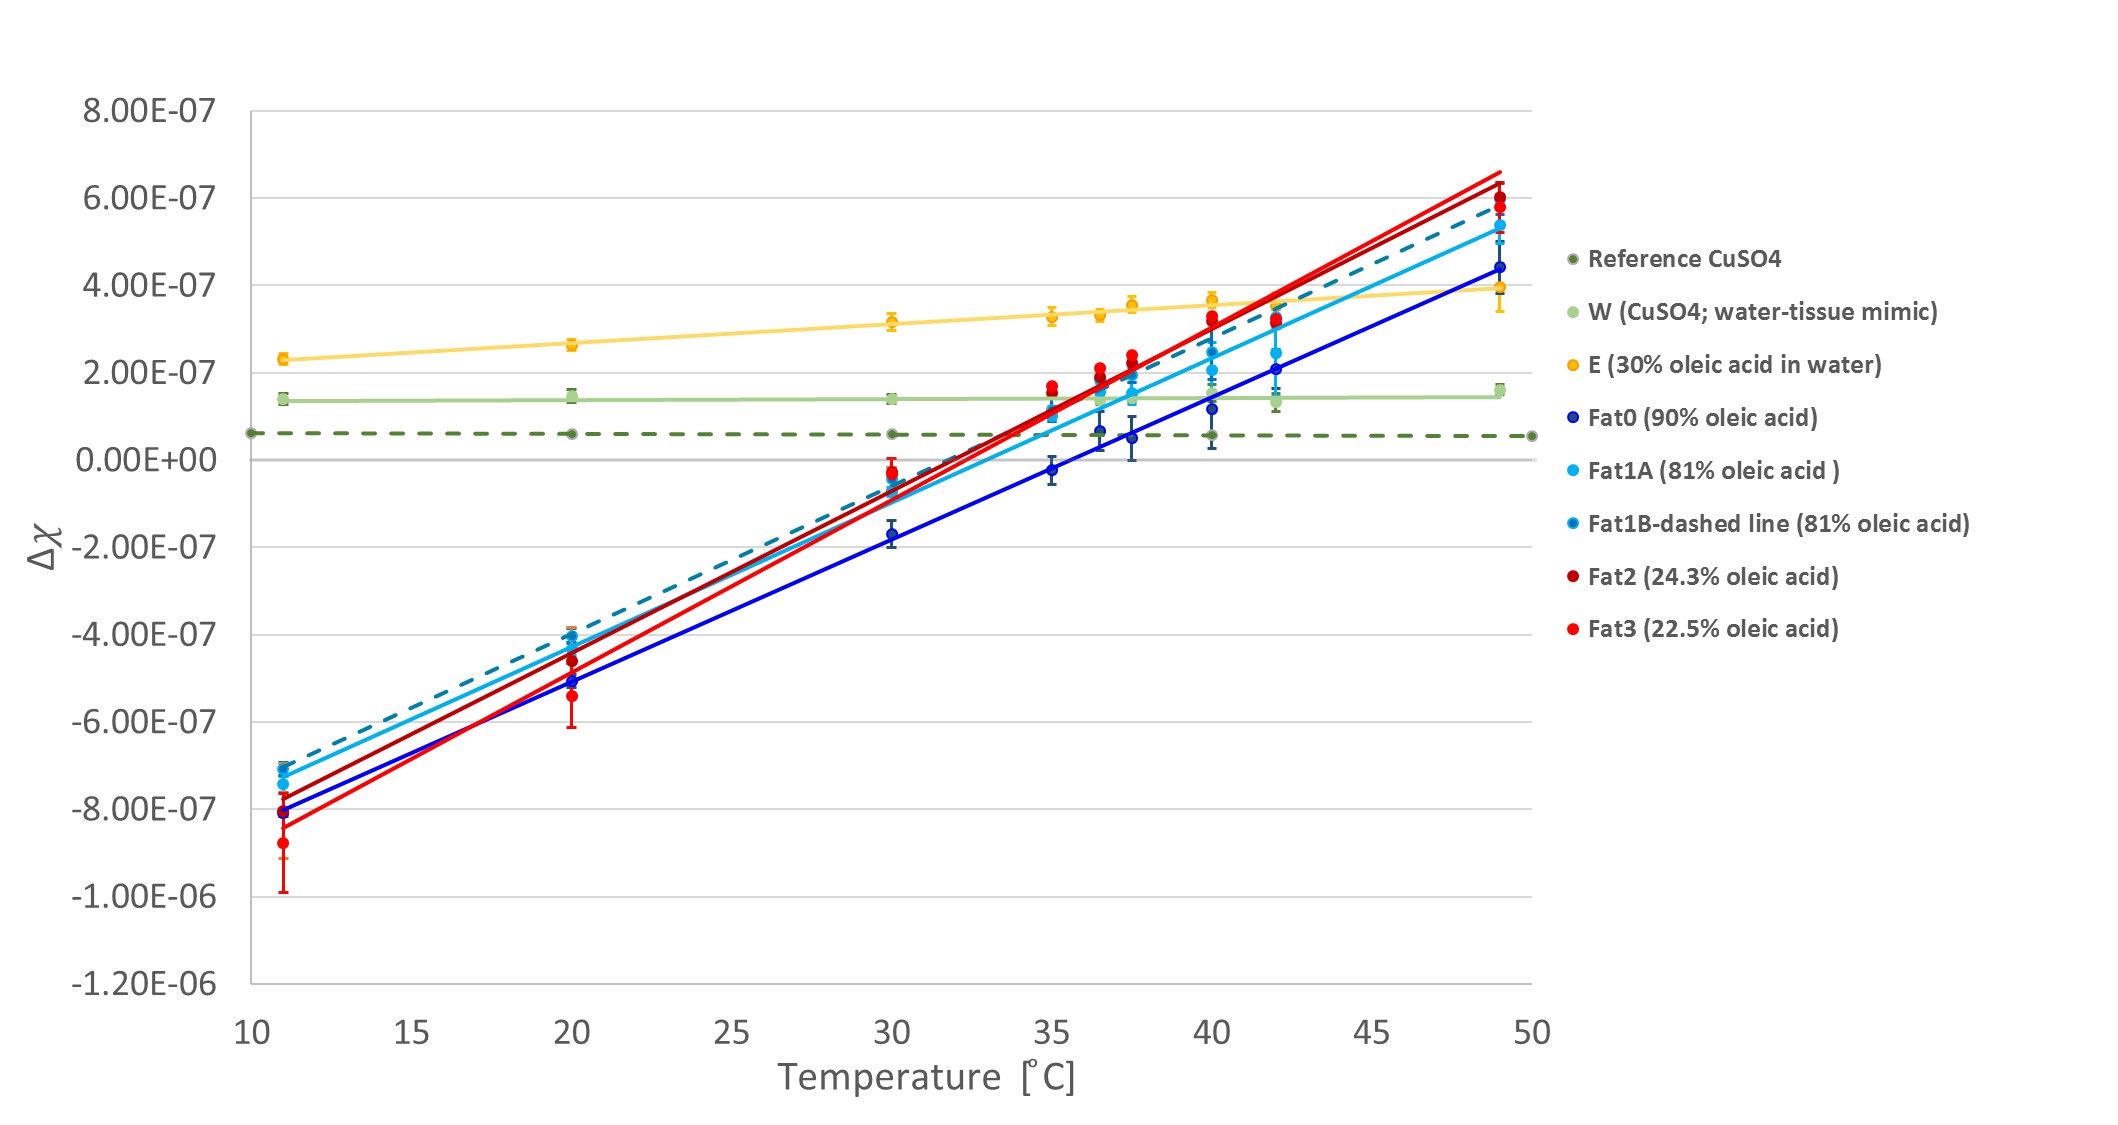
1H-NMR spectra of several human-Fat mimics, particularly oleic acid (Fat0; most abundant fatty acid in human-Fat), three fat mimic samples with different Fat0 content (High Precision Devices, Inc.; Fat 1;2;3;4), and their emulsions were measured at 20°C,37°C and 42°C. Absolute value of magnetic susceptibility for all fat mimic samples was calculated from magnetic moments measured on a SQUID magnetometer at 7 and -7 Tesla with a temperature range of 3–55°C.Volume magnetic susceptibility, $$$\chi$$$, of Fat0 was calculated using sample density (vibrating tube densitometer) at temperatures from 20–70°C. Data for density were not obtained for samples Fat 1;2;3 due to their high viscosity, mass magnetic susceptibility were calculated instead of $$$\chi$$$. Volume susceptibility shift ($$$\Delta\chi$$$) with temperature was calculated from MR phase images (3T; preclinical MRI scanner). Water/fat phantom with eight vials containing samples Fat1A;1B;2;3;4, Fat1-emulsion (E) and water-tissue mimic (W; 3.2 mM CuSO4) oriented parallel to $$$B_0$$$ (Fig.1) were imaged, using a gradient echo sequence with TE from 10 to 80ms (ΔTE=10ms) at several temperatures (11–49°C). Subsequently, MRI phase ($$$\phi$$$) images were used to calculate $$$\Delta\chi$$$ relative to water for each temperature, according to the following equation: $$$\Delta\chi=3\delta\phi/\gamma_pB_0TE$$$, where $$$\gamma_p$$$ is proton gyromagnetic ratio and $$$\delta\phi$$$ is the phase difference inside relative to outside the vials. Fat1 was included in the phantom twice, and Fat4 was excluded from analysis due to artifacts in the images.RESULTS
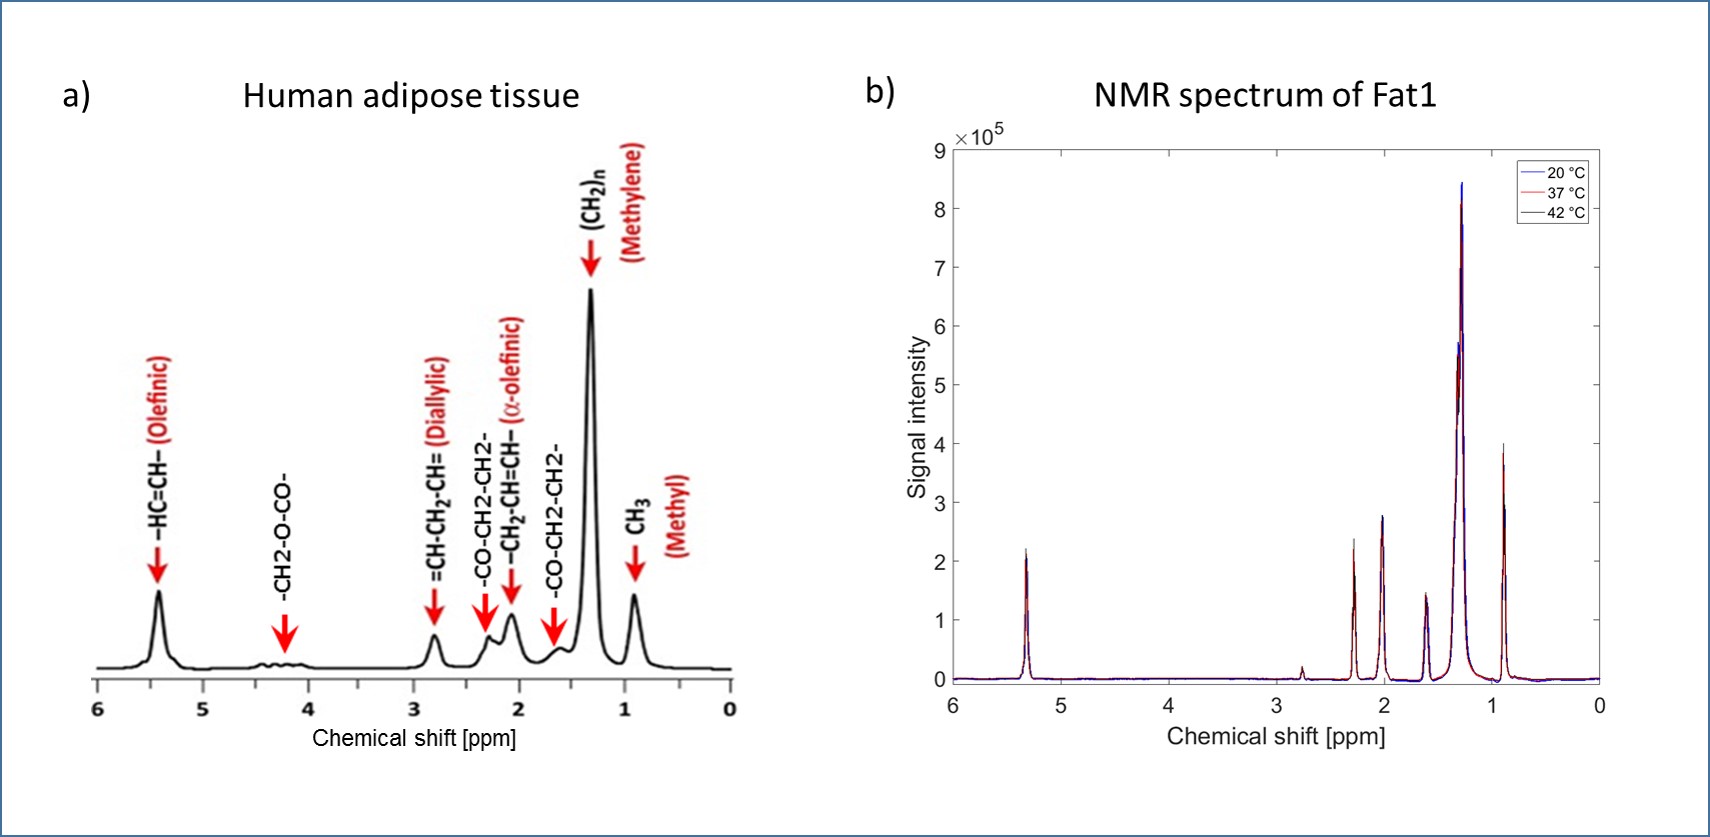
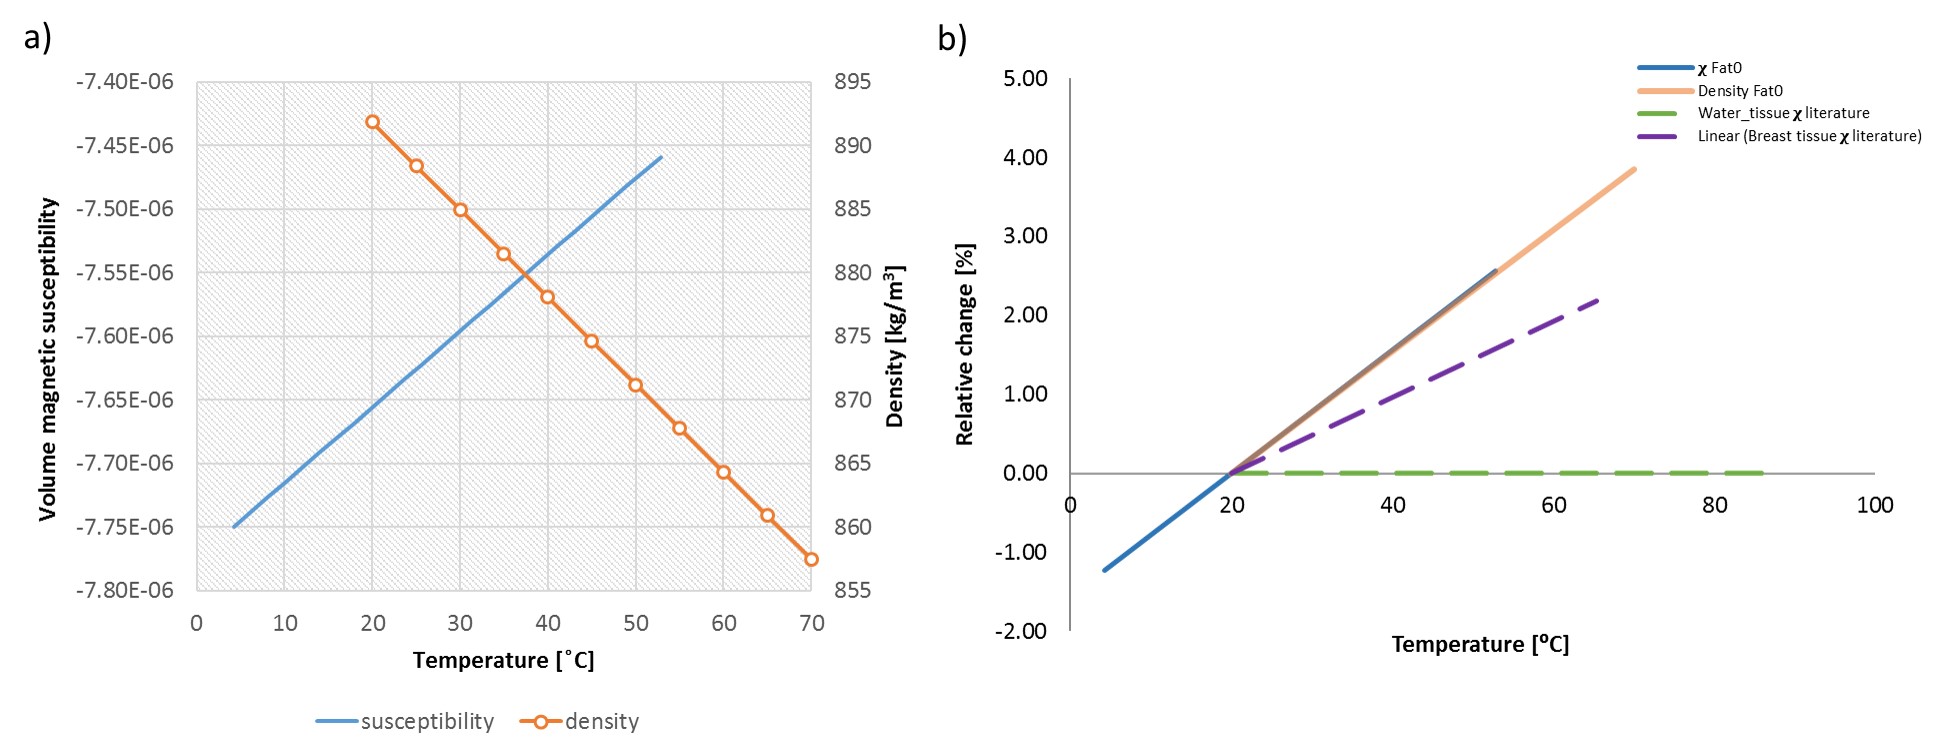
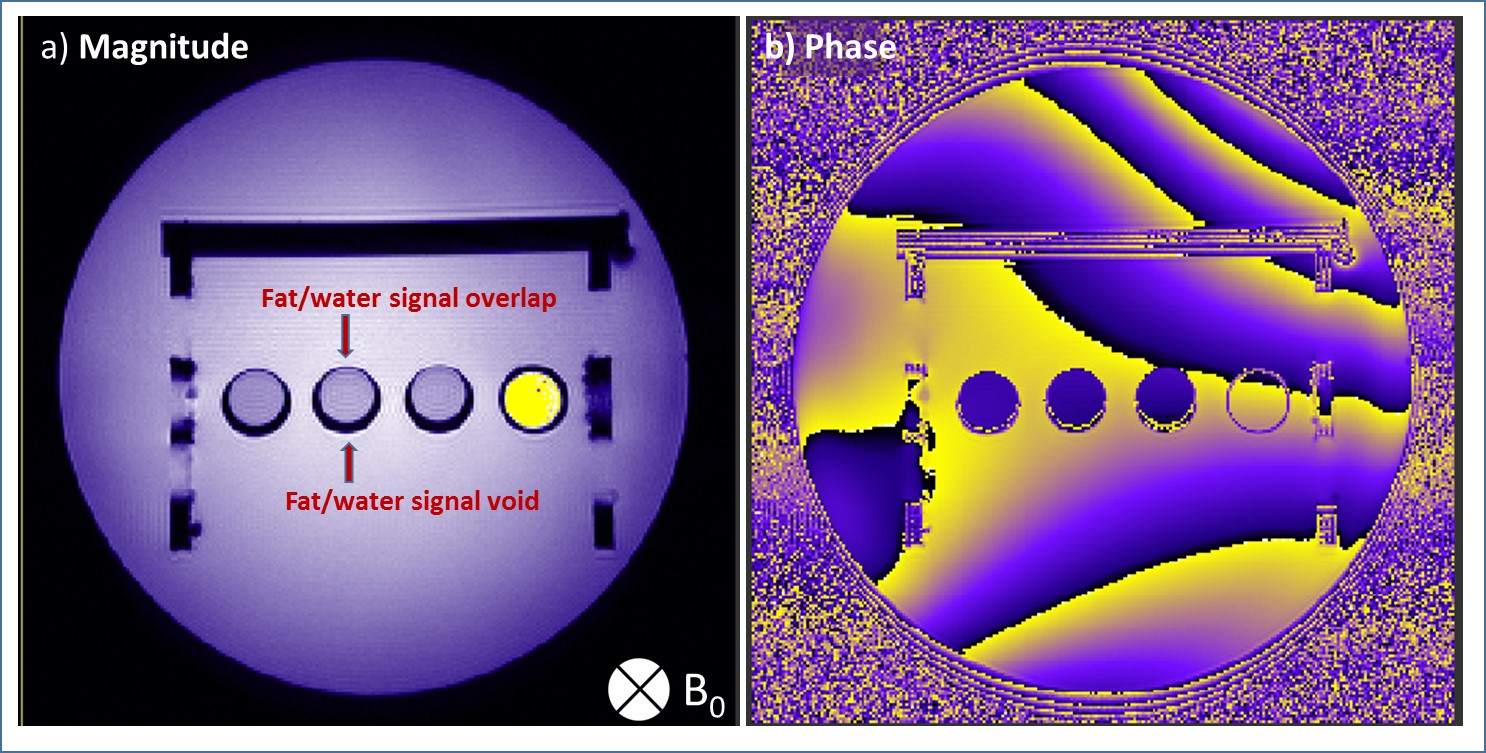
Chemical spectra of fat mimics and their emulsions were compared to human-Fat spectra. All fat mimics have spectra similar to reference human-Fat (Fat1 spectra shown in Fig.2).3 The locations of the fat peaks do not change with temperature. The density and SQUID measured $$$\chi$$$ of Fat0 are temperature dependent (Fig.3a), similar to human-Fat (Fig.3b).4 MRI measurements revealed significant differences in thermal dependence of fat mimics $$$\Delta\chi$$$ and W solution $$$\Delta\chi$$$ (Fig.5). $$$\Delta\chi$$$ of fat samples rises with increasing temperature, while $$$\Delta\chi$$$ of water-tissue remained constant.The change in $$$\chi$$$ in all fat samples correlated to oleic acid content. MR properties are similar to human-Fat values (Fig.3b). A chemical shift artifact in the MR image is visible for fat samples (Fig.4), but not W solution.DISCUSSION
NMR spectra of all fat mimics are representative of human-Fat with similar chemical spectra and thermal dependence of $$$\Delta\chi$$$ (Fig.2). Although, samples Fat1;2;3;4 reproduced human spectra more accurately than Fat0, small discrepancies between proton resonant frequency peaks are within the range of variability of human-Fat composition.5 Locations of fat peaks do not change with temperature, indicating that the resonant frequencies of fat do not changing with temperature. Absolute value of $$$\chi$$$ of Fat0 is decreasing with temperature, indicating that fat becomes less diamagnetic with temperature. Relative change in $$$\chi$$$ of Fat0 in our SQUID measurements is 0.00598ppm/°C, in agreement with reported $$$\Delta\chi$$$ in human-Fat, ranging from 0.0039 to 0.0076ppm/°C.1 Relative change in susceptibility has the same trend as relative change in density (Fig.3a) and can be attributed to thermal expansion of the fat. Mass susceptibility of all fat samples was temperature dependent, indicating temperature dependence of their $$$\chi$$$.To confirm this, additional density measurements are planned in future. MRI-measured $$$\Delta\chi$$$ increased with temperature for all fat samples and E. W solution had a nearly constant $$$\Delta\chi$$$, in agreement with the theory, which predicts a weak Curie-law decrease in susceptibility with temperature.The weak temperature dependence of the susceptibility of the W is similar to that measured in water-based tissue.1 Temperature dependence of $$$\Delta\chi$$$ for all fat samples was related to their oleic acid content. There were limitations in our study: $$$\Delta\chi$$$ of repeated sample Fat1A and Fat1B had similar slopes, but the lines do not overlap as expected. This is most likely due to partial volume distortion, observed in vials Fat0 and Fat1A (the vials were on an angle with respect to $$$B_0$$$).CONCLUSION
The studied fat mimics are representative of human-Fat, both in their spectral signature and temperature dependent susceptibility, and can be used as standards for validation of MRT. Our results indicate that the impact of heat-induced susceptibility changes of fat during thermal therapy in the water/fat tissues cannot be neglected.Acknowledgements
No acknowledgement found.References
1. Sprinkhuizen SM, Konings MK, van der Bom MJ, et al. Temperature-Induced Tissue Susceptibility Changes Lead to Significant Temperature Errors I PRFS-Based MR Thermometry during thermal interventions. Mag Res Med. 2010;64:1360-1372.
2. Keenan KE, Wilmes LJ, Aliu SO, et al. Design of a breast phantom for quantitative MRI. J Magn Reson Imaging. 2016;44: 610–619.
3. Heymsfield SB, Hu HH, Shen W, at al. Emerging Technologies and their Applications in Lipid Compartment Measurement. Trend Endocrin Met. 2015;26(12):688–698.
4. Sprinkhuizen SM, Bakker ChJG, Ippel JH, et al. Temperature dependence of the magnetic volume susceptibility of human breast fat tissue: an NMR study. Magn Reson Matter Phy. 2012; 25: 33-39.
5. Malcom GT, Bhattacharyya AK, Velez-Duran M, et al. Fatty acid composition of adipose tissue in humans: differences between subcutaneous sites. Am J Clin Nutr. 1989;50(2):288-91.
6. Haynes WM. CRC Handbook of Chemistry and Physics, 96th Edition
Figures