5181
A Generalized Formulation for Parameter Estimation in MR Signals of Multiple Chemical Species1Department of Diagnostic and Interventional Radiology, TUM Technical University of Munich, Munich, Germany, 2Department of Diagnostic and Interventional Radiology, Technical University of Munich, Munich, Germany
Synopsis
The purpose of this work is to develop a generalized formulation to study the parameter estimation of complex MR signals and its multi-species components.
Introduction
Many emerging MR techniques that are not only using magnitude but also phase information of the complex MR signal, such as quantitative susceptibility mapping1 and water-fat imaging2. The phase carries various information; one of them is the presence of multiple chemical species. As in general imaging of human tissue includes several chemical species in a voxel, a detailed understanding of the signal behavior is favorable. Therefore, the purpose of this work is to develop a generalized formulation to study the parameter estimation of complex signals and its multi-species components.Generalized Formulation
The MR signal evolution of $$$M$$$ chemical species can be written as$$s(t)=\sum_{m=1}^M\rho_m e^{i\phi_m}e^{i(\omega_m+ir_m)t_n}$$ where $$$\rho_m,\phi_m\in\mathrm{R}$$$ are the amplitude and the phase and $$$\omega_m,r_m\in \mathbb{R}$$$ the chemical frequency shift and the transverse relaxation rate of the $$$m$$$-th species, respectively. For a multi-echo sampling with $$$N$$$ points we can write$$\vec{s}=AP\vec{\rho},$$where we introduced$$\vec{s}_{N\times1}=[s(t_1),s(t_2),...,s(t_N)]^T$$
$$A_{N \times M}=\begin{pmatrix}e^{i(\omega_1+ir_1)t_1}&...&e^{i(\omega_M+ir_M)t_1}\\\vdots& &\vdots \\e^{i(\omega_1+ir_1)t_N} &...&e^{i(\omega_M+ir_M)t_N}\\\end{pmatrix}$$
$$\rho_{M\times 1}=\begin{pmatrix}\rho_1 \\\vdots \\\rho_M \\\end{pmatrix}.$$
These equations can be thought of as the signal model of $M$ species where all model parameters $$\vec{\beta}=[\vec{\rho}^T, \vec{\phi}^T, \vec{\omega}^T, \vec{r}^T]^T \in \mathbb{R}^{4M}$$ are unknowns and no constrains linking different species are introduced. Most often such a model is practically unfeasible in MRI and parameters are fixed by a priori assumptions and constrains, which reduce the number of unknowns and allows to fit the model to real experimental data where $N$ is typically not very large. Such constrains can be conveniently introduced on the level of derivatives describing how the model behaves for varying parameters. These form the full model Jacobian
$$J=\left[ d\vec{s}/d\vec{\rho},d\vec{s}/\vec{\phi},d\vec{s}/d\vec{\omega},d\vec{s}/\vec{r}\right]$$
$$d\vec{s}/d\vec{\rho}=APC_{\rho}$$
$$d\vec{s}/d\vec{\phi}=iAP(\vec{\rho}\vec{u}^T\circ C_{\phi})$$
$$d\vec{s}/d\vec{\omega}=iTAP(\vec{\rho}\vec{u}^T\circ C_{\omega})$$
$$d\vec{s}/d\vec{r}=-TAP(\vec{\rho}\vec{u}^T\circ C_r)$$
with $$$T=\diag(t_1,...,t_N)$$$, $$$\vec{u}^T=[1,1,...,1]_{M\times 1}$$$, and $$$\circ$$$ being element-wise multiplication.
Cramer-Rao Analysis
In the case of complex white Gaussian noise with variance $$$\sigma^{2}$$$, it can be shown that the Fisher information matrix of the model6 with given constrains $$$\{C_{\rho},C_{\phi},C_{\omega},C_r\}$$$ is given by $$$F=\frac{1}{\sigma^{2}}J^{\dagger}J$$$. Together with Equation above there is thus a general expression of the Cramer-Rao lower bound for each chosen signal model, as$$\text{CRLB}\leq F^{-1}.$$
Algorithm
Note that Equation above also allows to develop a parameter estimation algorithm that is independent of an a priori choice of the signal model and iteratively solves for the unknown parameters $$$\vec{\beta}'$$$ via the variable projection method (VARPRO)5 using a Gauss–Newton update
$$\vec{\beta}^{'(k)}_{\text{nonlinear}}= (J^{\dagger}J)^{-1}J^{\dagger} (\vec{s}_{\text{measured}}-\vec{s}(\vec{\beta}^{'(k-1)}_{\text{nonlinear}})),$$
for the nonlinear parameters $$$\vec{\beta}_{\text{nonlinear}}$$$. A fast MATLAB mex implementation of this algorithm, together with methods to estimate the noise behavior of different signal models via Equation above will be made available.
Results
In the following we demonstrate the flexibility of the model-open formulation in deriving a known result from literature in chemical-shift encoded water–fat imaging and show one new application in a different, less well-studied water–fat model.
Single-$$$T_2^{*}$$$ Multi-peak Water--Fat Separation
A widely used class of water--fat models2,3 use an a priori fixed $M$-peak fat spectrum with frequencies shifts $$$\{\Delta f_m\}$$$ and relative peak amplitudes $$$\{\alpha_m\}$$$, with $$$\sum_m^M \alpha_m=1$$$, which is often written as
$$s_n=(W+c_nF)e^{i2\pi f_Bt_n}e^{-R_2^*t_n},\qquad c_n=\sum_m^M\alpha_me^{2\pi i(\Delta f_m)t_n},$$
where each multiple species obeys a common $$$R_2^{*}$$$-decay and the frequency of the water peak $$$f_B$$$ is named "field map", which governs also the phase behavior of all fat peaks. Such a model can be derived by setting the $$$M\times M$$$ constraining matrices as given in Figure 1. The NSA of each model parameter based on the theoretical AA is also depicted in Figure 1, where 6 echos with an echo spacing of 1ms were assumed. Figure 2 shows an in vivo result of estimating the model parameters in an invivo thigh scan with the same echo times that was reconstructed with an algorithm using the generalized formulation.
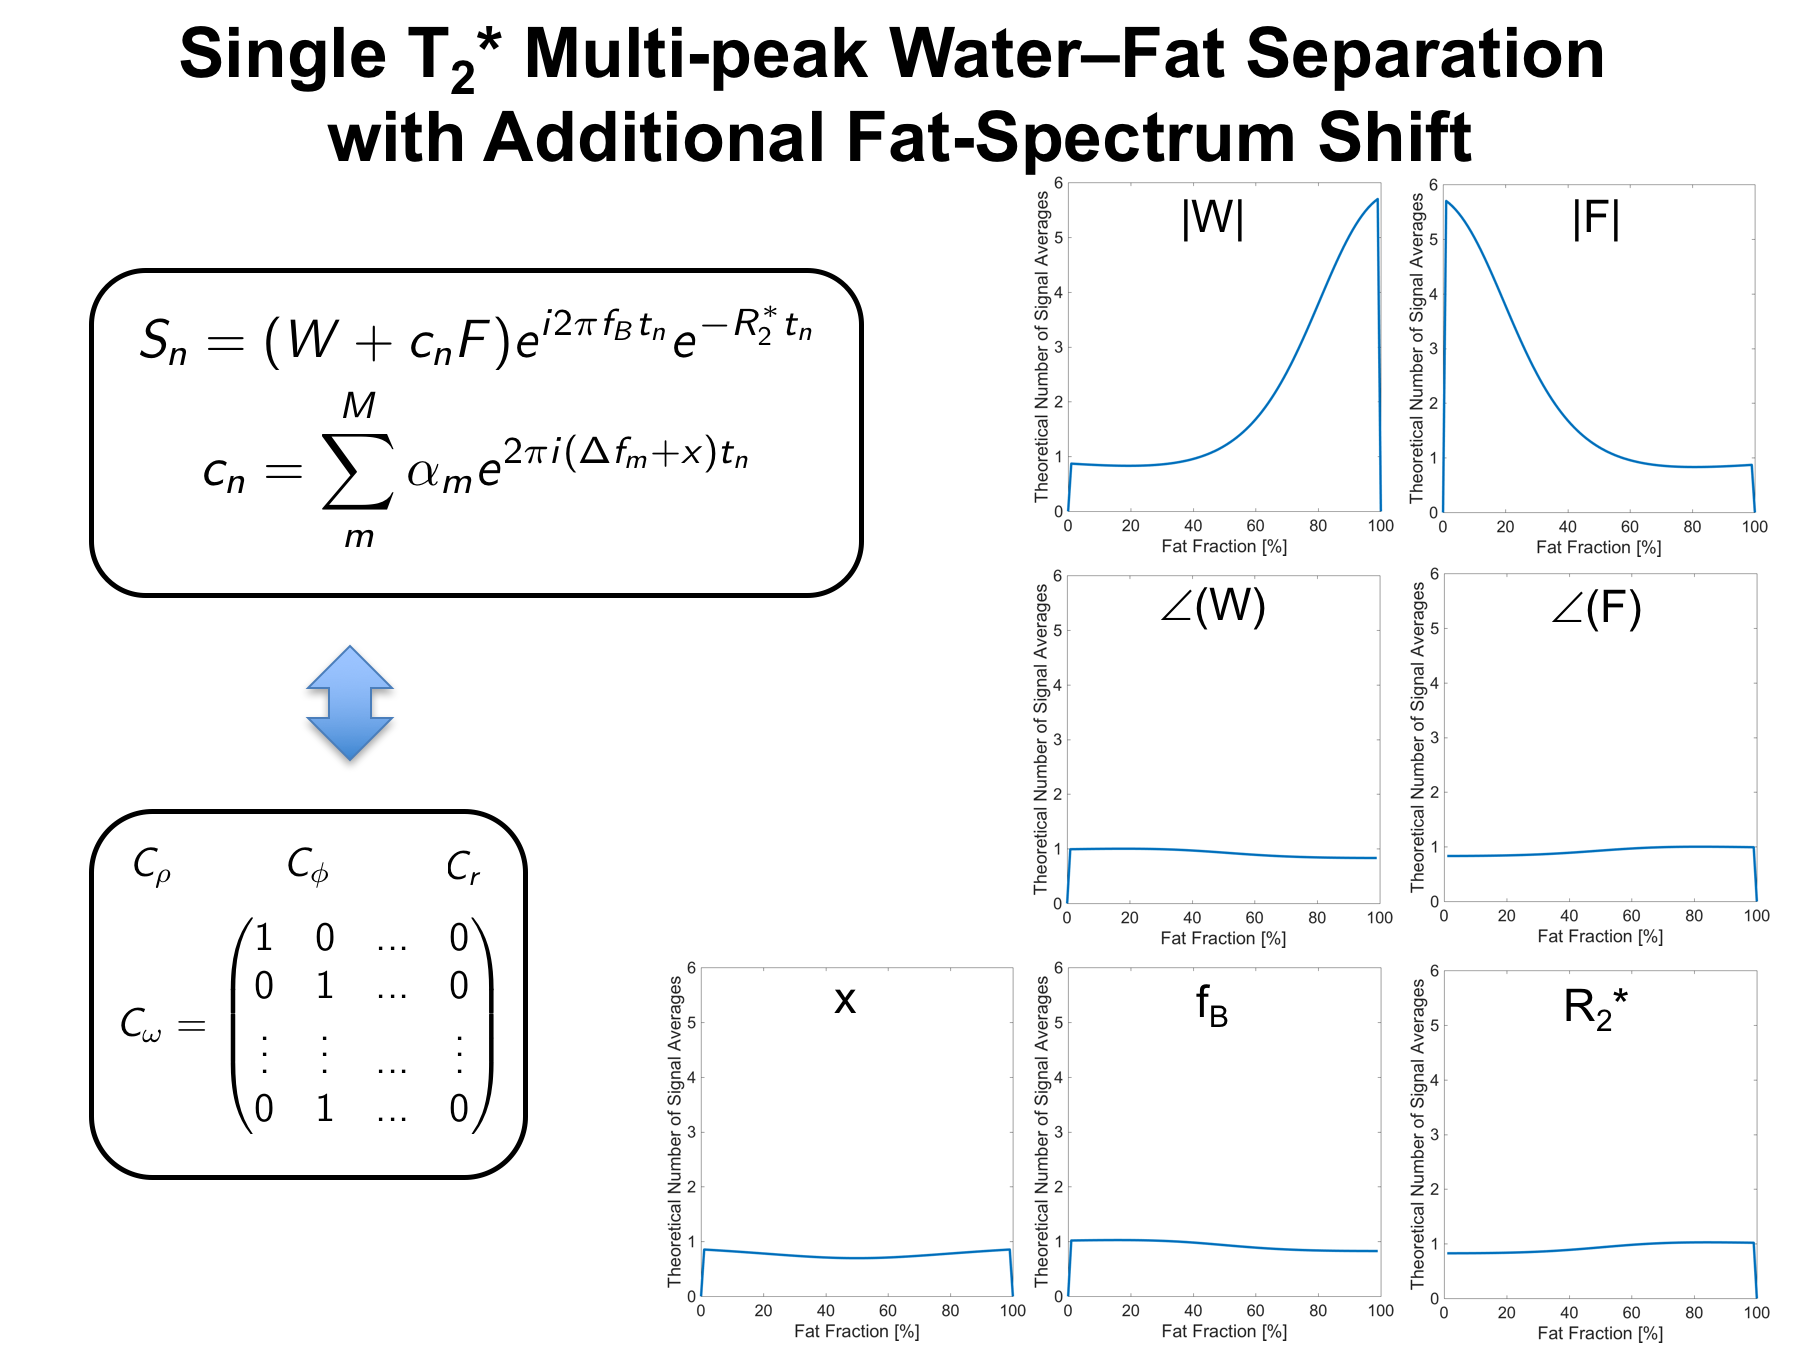
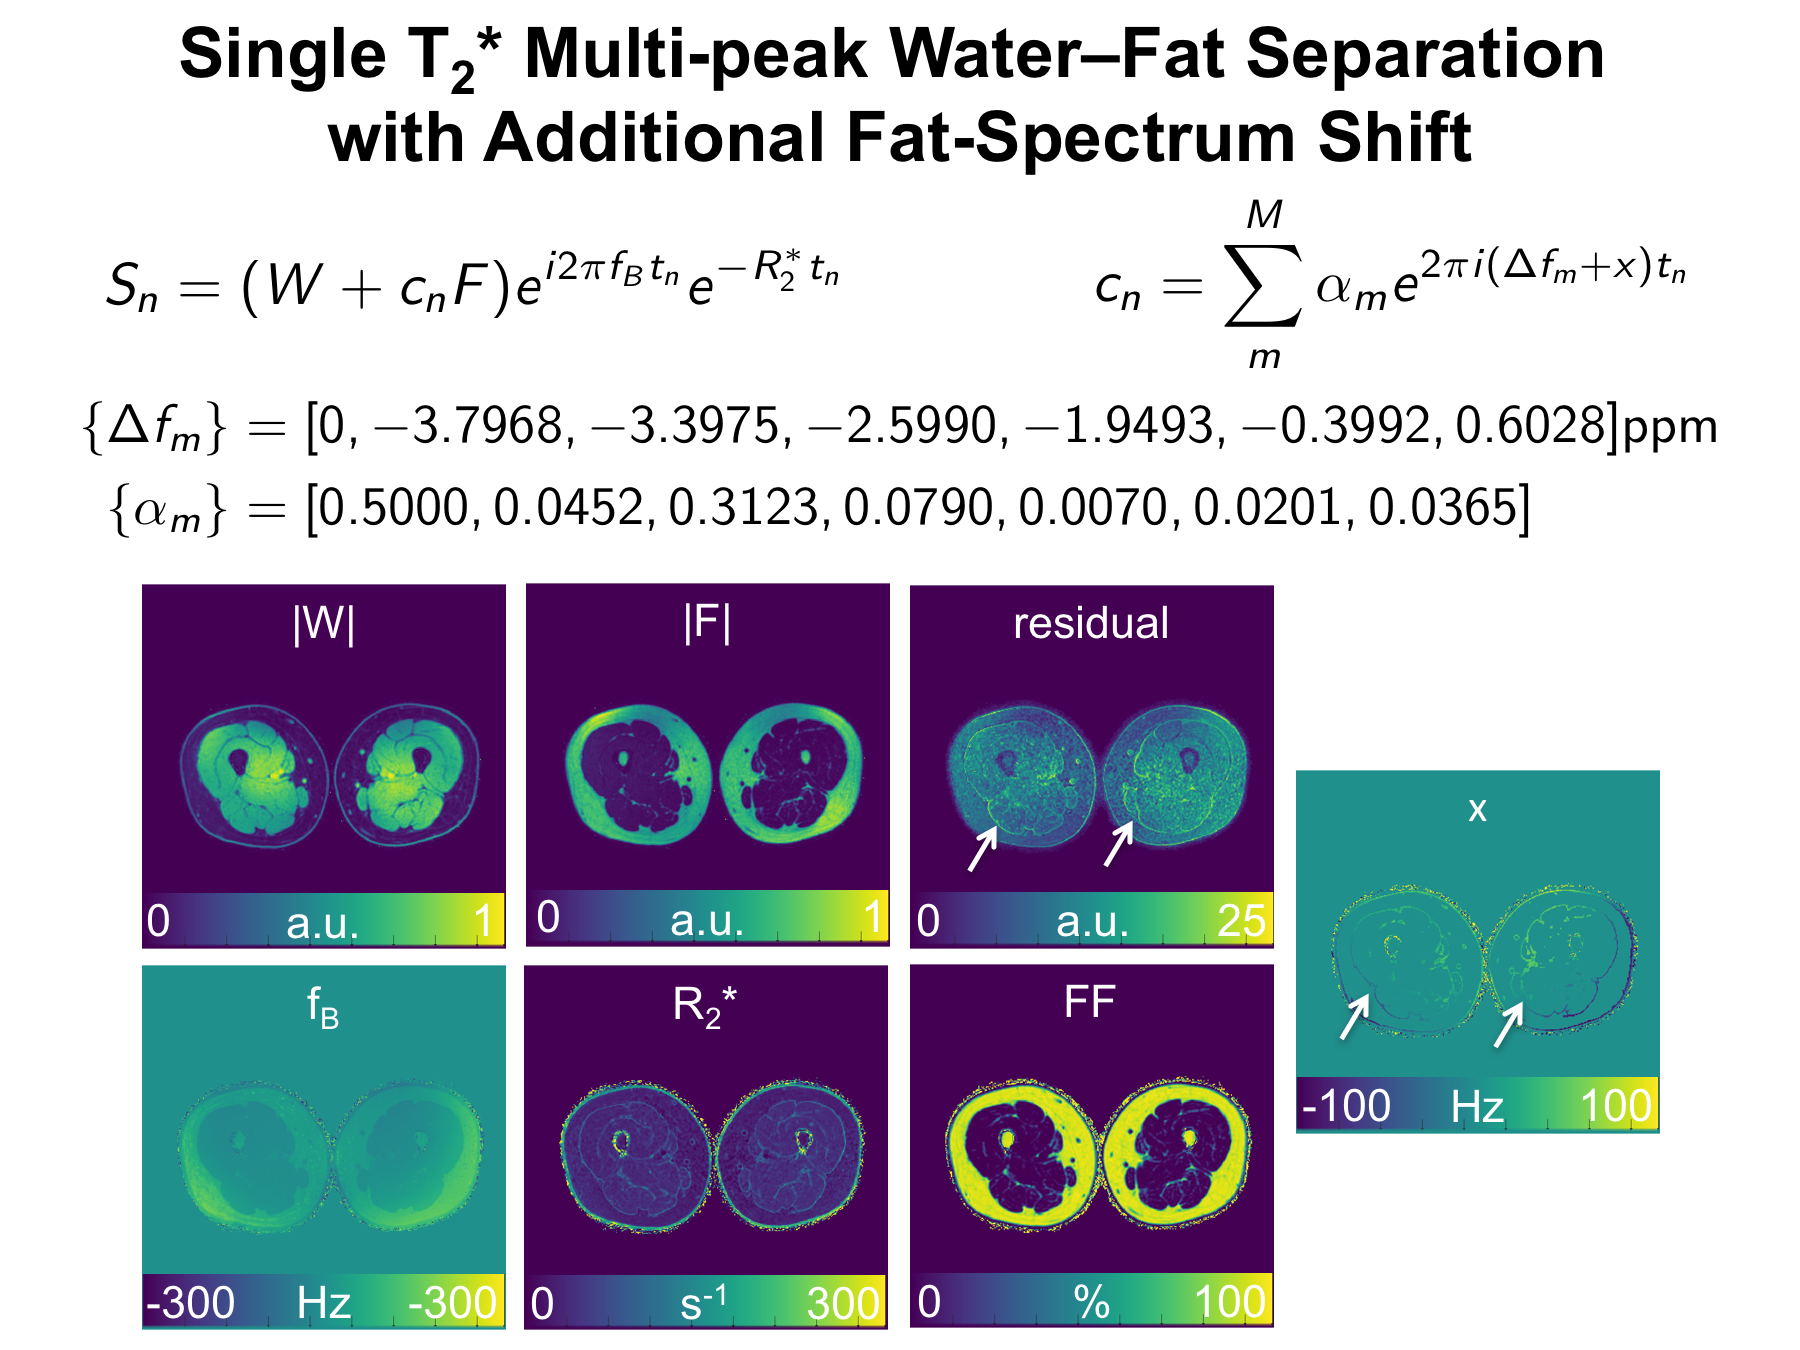
Single-$$$T_2^{*}$$$ Multi-peak Water--Fat Separation in the Presence of an Additional Fat-Spectrum Shift
Previously a water–fat model with an additional parameter was reported4 that models a variable shift $$$x$$$ of the whole fat spectrum with respect to the water peak like
$$s_n=(W+c_nF)e^{i2\pi f_Bt_n}e^{-R_2^*t_n}, \qquad c_n=\sum_m^M\alpha_me^{2\pi i(\Delta f_m+x)t_n}.$$
In the generalized formulation this can comfortably implemented with switching only two subcolumns in the matrix $$$C_{\omega}$$$. Figure 3 shows in the same CRLB analysis that noise performance is only reduced in the phases of the water and fat signal and not in the other parameters, while effectively increasing the model match as the residual of the parameter estimation fit is reduced compared to the model above.
Discussion & Conculsion
In this work we presented a general formulation to study parameter estimation with MRI signals of multiple chemical species. The description of a specific model in terms of its constraining matrices allows to derive general equations for the noise behavior of such signals as well as the development of flexible algorithmic solversAcknowledgements
The present work was supported by Philips Healthcare and the European Research Council (grant agreement No 677661, ProFatMRI).References
[1] Wang, Y., & Liu, T. (2015). Quantitative susceptibility mapping (QSM): Decoding MRI data for a tissue magnetic biomarker. Magnetic Resonance in Medicine, 73(1), 82–101. http://doi.org/10.1002/mrm.25358
[2] Ma, J. (2008). Dixon techniques for water and fat imaging. Journal of Magnetic Resonance Imaging, 28(3), 543–558. http://doi.org/10.1002/jmri.21492
[3] Hernando, D., Kellman, P., Haldar, J. P., & Liang, Z. P. (2010). Robust water/fat separation in the presence of large field inhomogeneities using a graph cut algorithm. Magnetic Resonance in Medicine, 63(1), 79–90. http://doi.org/10.1002/mrm.22177
[4] Karampinos, D. C., Yu, H., Shimakawa, A., Link, T. M., & Majumdar, S. (2012). Chemical shift-based water/fat separation in the presence of susceptibility-induced fat resonance shift. Magnetic Resonance in Medicine, 68(5), 1495–1505. http://doi.org/10.1002/mrm.24157
[5] O’Leary, D. P., & Rust, B. W. (2013). Variable projection for nonlinear least squares problems. Computational Optimization and Applications, 54(3), 579–593. http://doi.org/10.1007/s10589-012-9492-9
[6] Pineda, A. R., Reeder, S. B., Wen, Z., & Pelc, N. J. (2005). Cramer-Rao bounds for three-point decomposition of water and fat. Magnetic Resonance in Medicine, 54(3), 625–635. http://doi.org/10.1002/mrm.20623
Figures
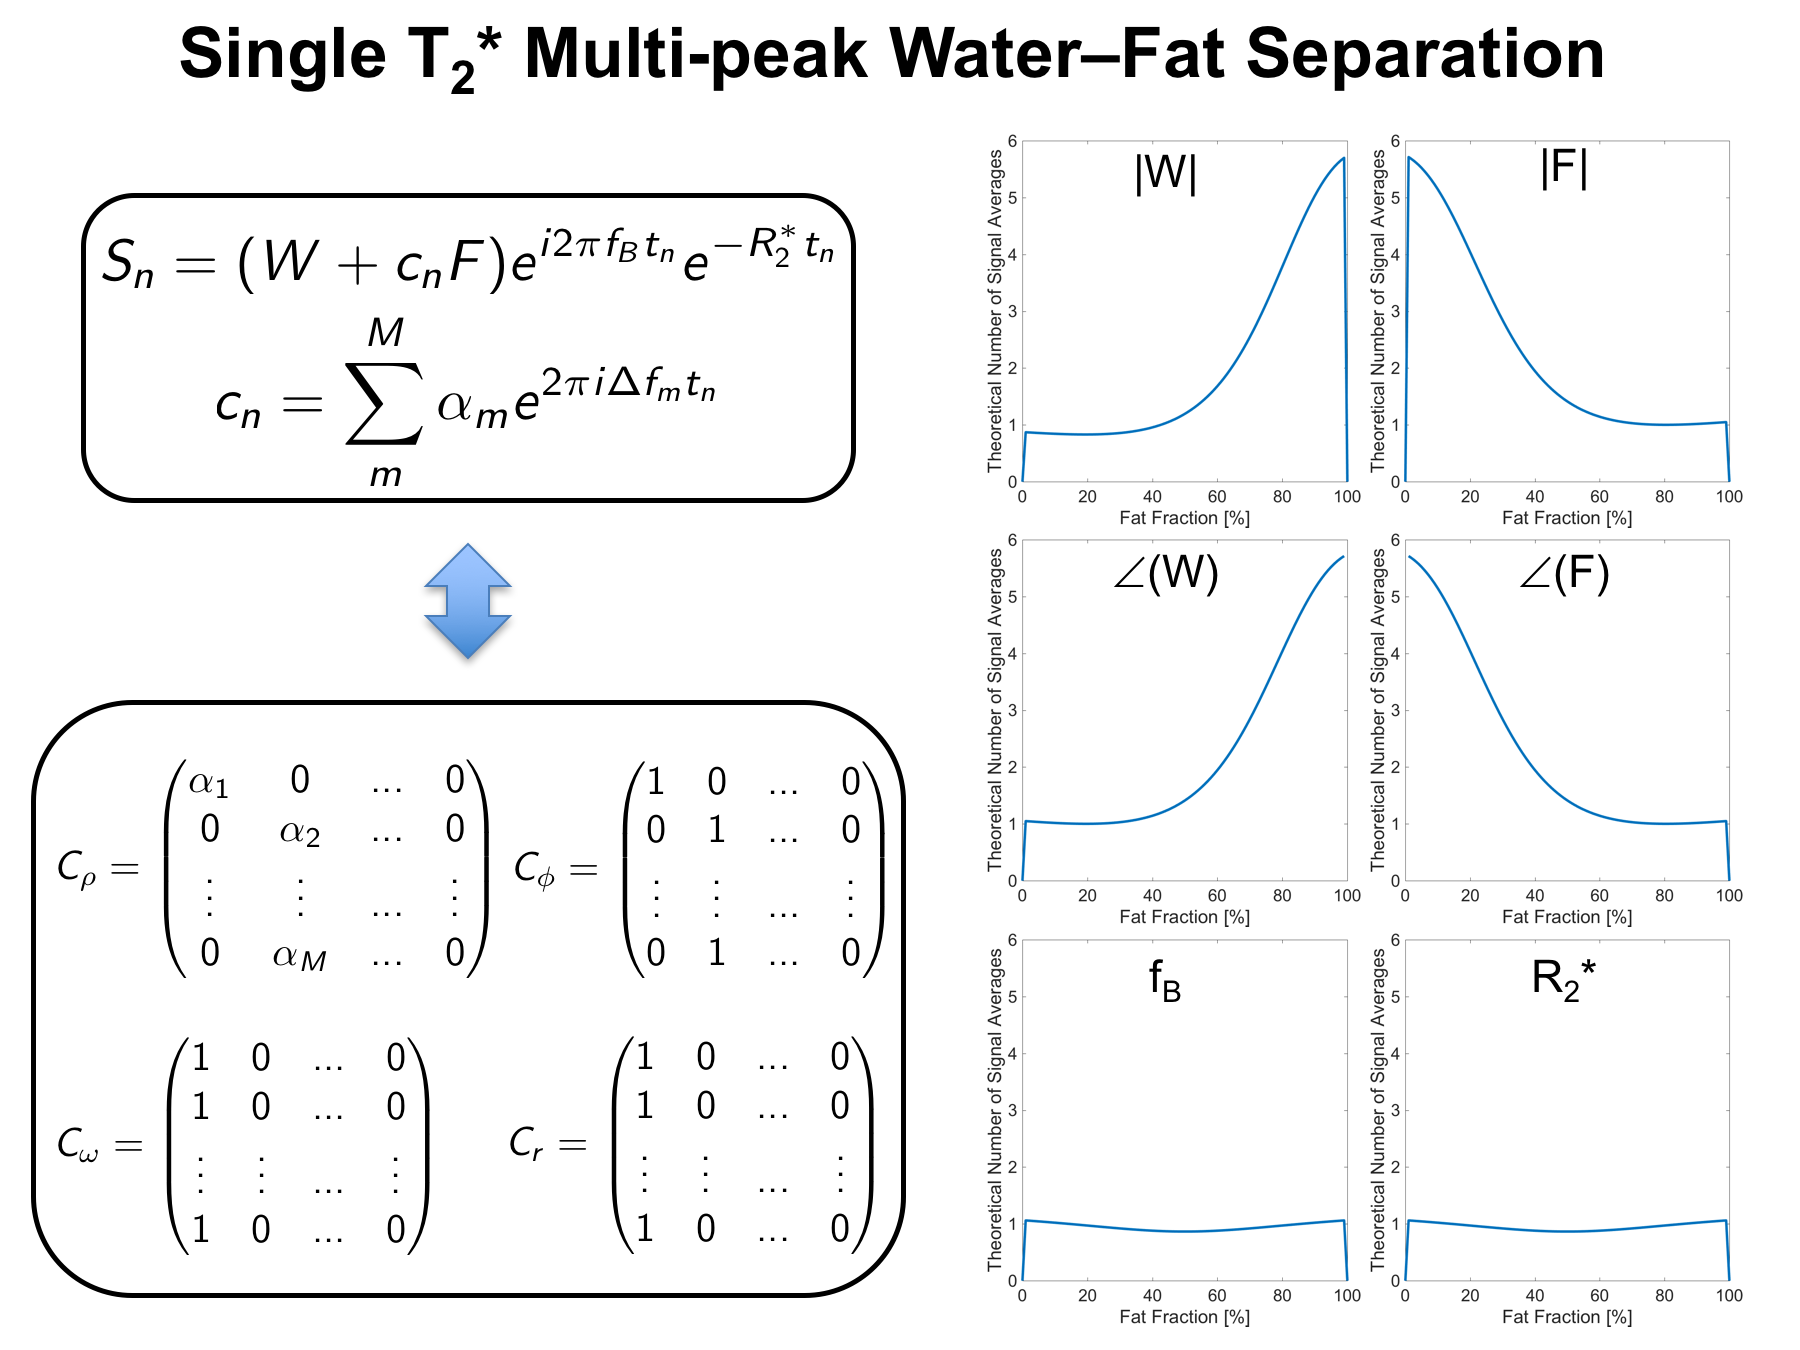
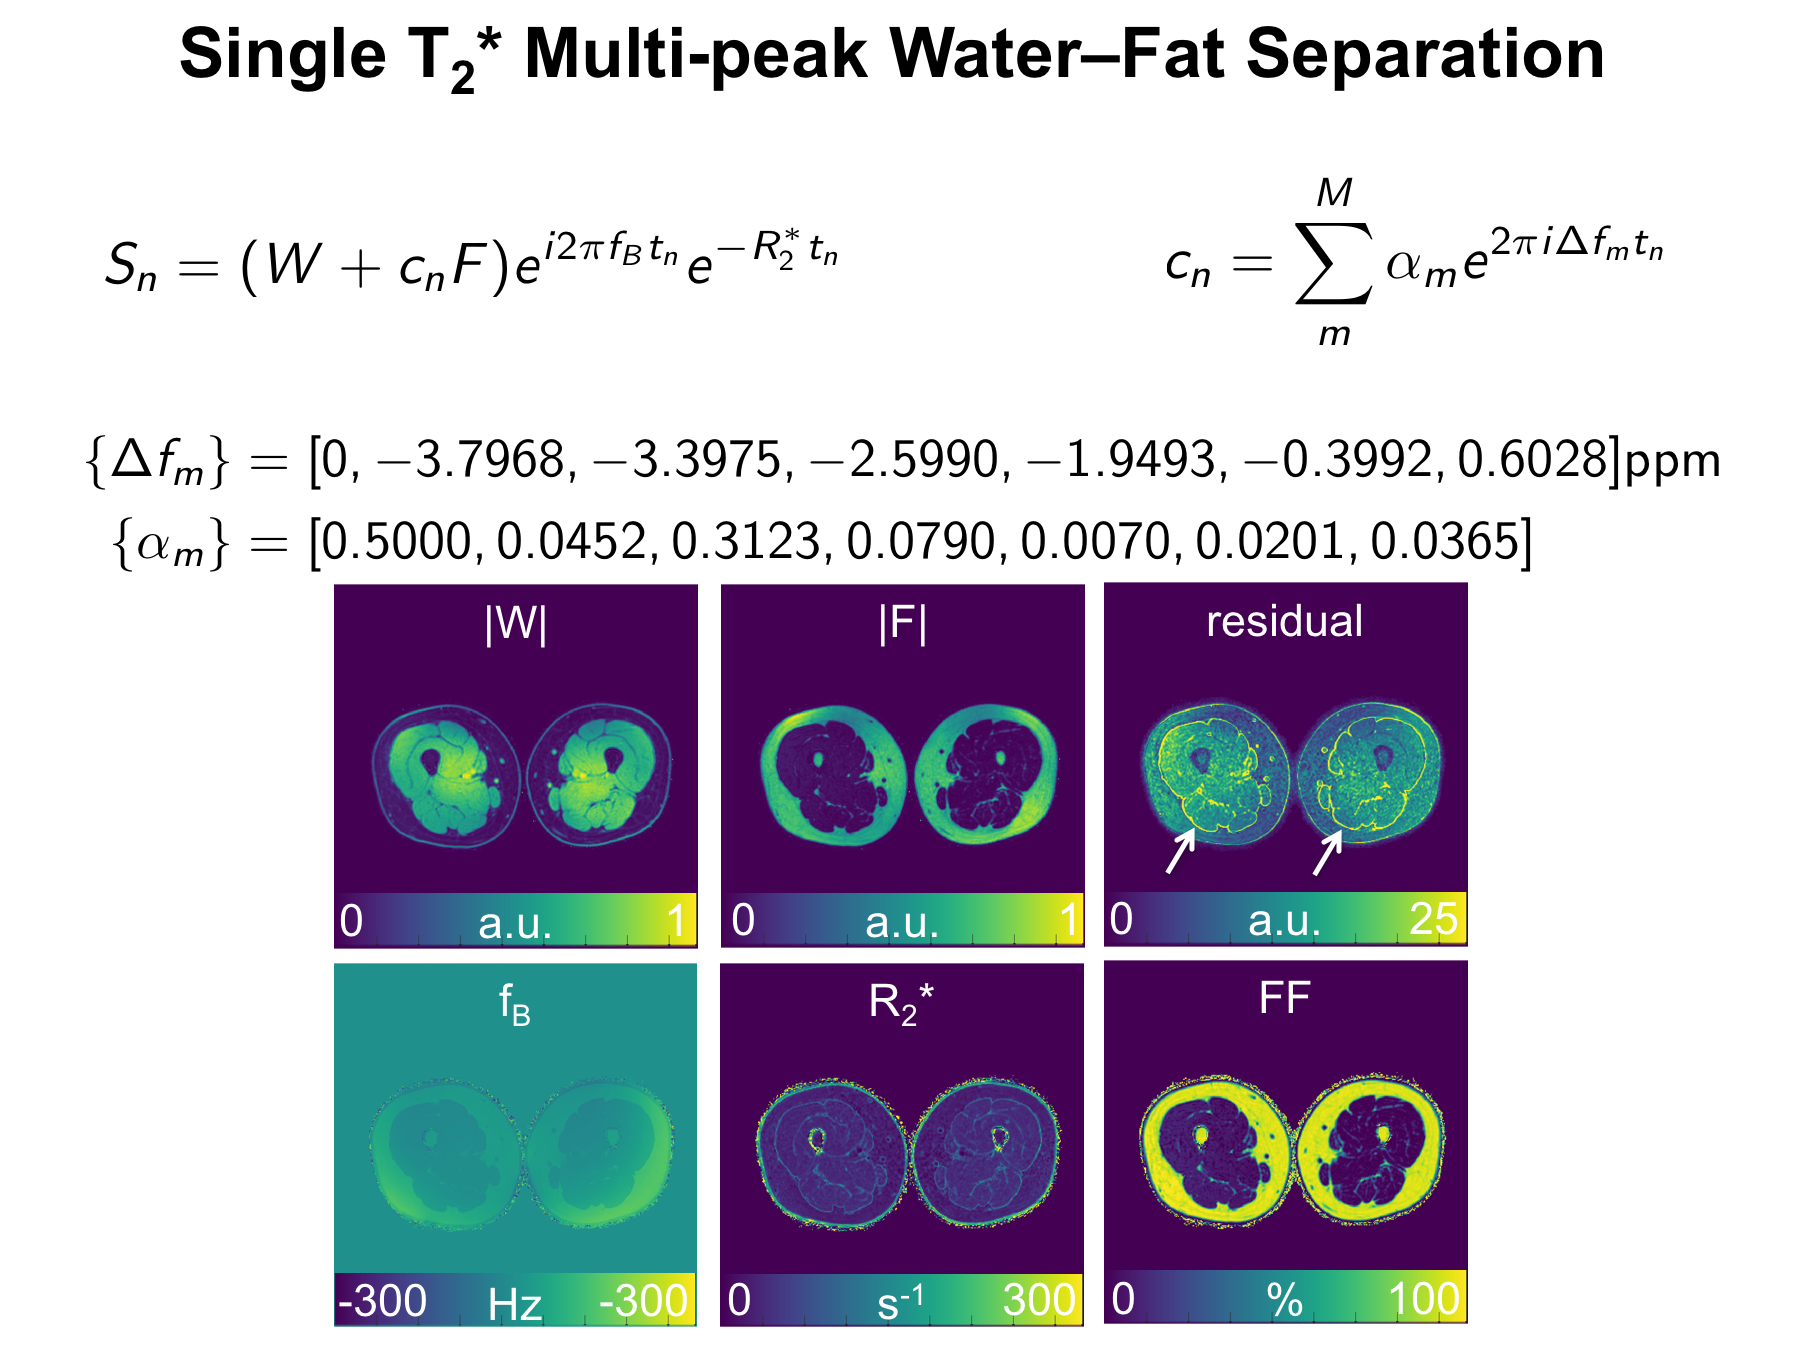
Fig. 2: In vivo parameter estimation of single T2* corrected 6-peak fat spectrum water–fat model.