5176
Influence of temporal resolution on liver perfusion using golden-angle radial sparse parallel MRI1Leeds Institute of Biomedical and Clinical Sciences, University of Leeds, Leeds, United Kingdom, 2School of Medicine, New York University, New York, NY, United States, 3Siemens AG Healthcare MR, Erlangen, Germany, 4Leeds Institute of Cardiovascular and Metabolic Medicine, University of Leeds, Leeds, United Kingdom
Synopsis
Golden-angle radial sparse parallell (GRASP) MRI uses temporal regularization in the reconstruction, which risks distorting temporal profiles and reducing DCE-MRI parameter accuracy and precision. The aim of this study is to investigate this issue for liver DCE-MRI by measuring kinetic parameters on data reconstructed at variable temporal resolution. The results depend on temporal resolution according to well-known patterns also observed in simulations and fully sampled data. A systematic error remains at the highest temporal resolution, but this is more likely due to well-known issues of signal saturation. Image reconstruction at lower temporal resolution risks degrading diagnostic image quality due to the mixing of images with different contrast. We conclude that: (1) temporal regularization in GRASP is unlikely to induce significant error in kinetic parameters; (2) images should be reconstructed at high temporal resolution around 2-4s.
Introduction
The highly-accelerated dynamic MRI technique iGRASP (Golden-angle RAdial Sparse Parallel)1, allows DCE-MRI image reconstruction with different temporal resolutions. The advantage is that accurate kinetic parameters (which require high temporal resolution) and diagnostic quality images (which require temporal averaging) can be derived from one dataset. On the other hand there is a risk that accuracy/precision of kinetic parameters is compromised due to temporal distortions caused by temporal regularization.
The aim of this study is to identify potential errors caused by temporal regularization in liver DCE-MRI, by investigating the effect of temporal resolution on reconstructed kinetic parameters.
Methods
DCE·MRI
DCE-MRI was performed at 1.5T (Siemens Avanto) in a healthy volunteer using a radial stack-of-stars 3D-FLASH sequence with golden-angle ordering (slice thickness 3mm; FA 12°; FOV 385x385mm2; matrix 256x256; resolution 1.5x1.5x3mm3; TR/TE 4.27/1.88ms; 64 partitions). Data were acquired in free-breathing during injection of 8mL Gd-DTPA (Magnevist, Bayer) and a 20mL saline flush. GRASP reconstructions were performed off-line on a multicore server using Yarra2. 11 sets of images were reconstructed by grouping a variable number of spokes (8-233) into temporal frames, producing sampling times (TS) of 1.3s to 37s.
Post-processing
Post-processing was performed with the open-source software PMl3. ROls were drawn manually on a single slice to generate concentration-time curves in aorta (Arterial Input Function-AIF) and portal vein (Venous Input Function-VIF). Additionally ten identical size (176mm2) ROIs were selected in liver parenchyma in close proximity to each other (Fig.1). The dual-input two-compartment uptake model4 was used to determine liver perfusion metrics for each ROI, assuming a linear relationship between signal and concentration. SNR and CNR5 were determined for each TS as illustrated in figure 1.
Data analysis
Parameter accuracy is assessed by comparing the medians across all 10 liver ROls against reference values6, and precision is assessed by their interquartile range (IQR) - assuming physiological heterogeneity is negligible. The effect of increasing TS is investigated by visual comparison of AIF's at different TS - assuming that temporal distortions are most apparent in the most rapidly changing signals. Image quality is evaluated subjectively and quantitatively through CNR and SNR measurements to identify any trade-offs of accuracy/precision vs. image quality.
Results
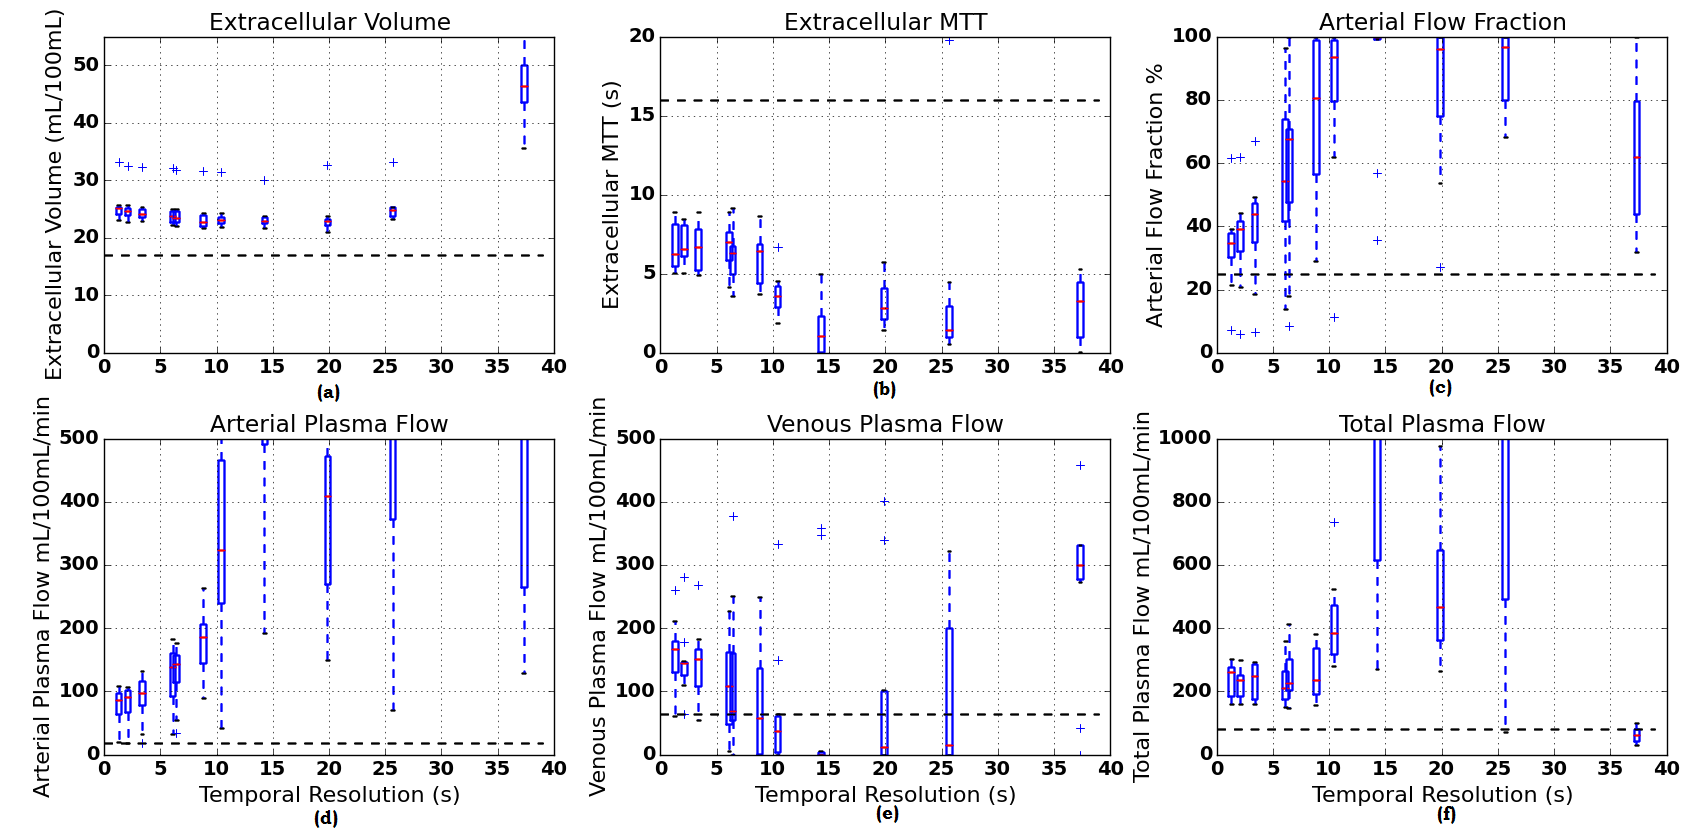
All parameters show increased accuracy and precision at shorter TS and converge near the shortest TS in the study (Fig.2). However the median values for all parameters are significantly different from reference values in this range.
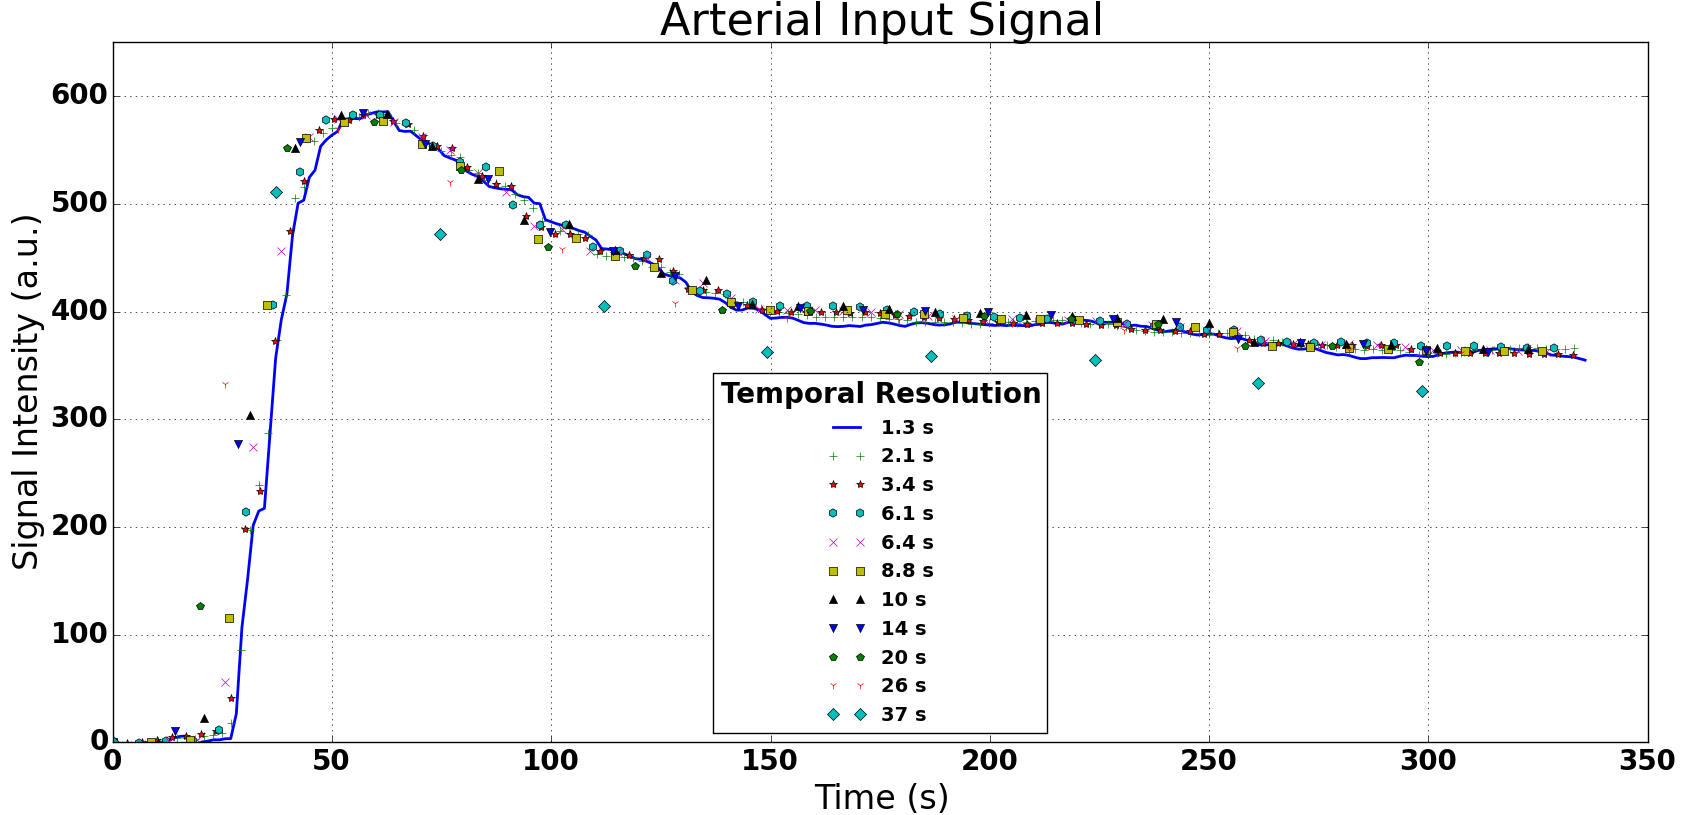
Generally the temporal profile is not affected by changes in TS (Fig.3): all data measured at longer TS are on or near the reference curve at shortest TS. The exception is the data from the longest TS=37s, where a systematic error is observed.
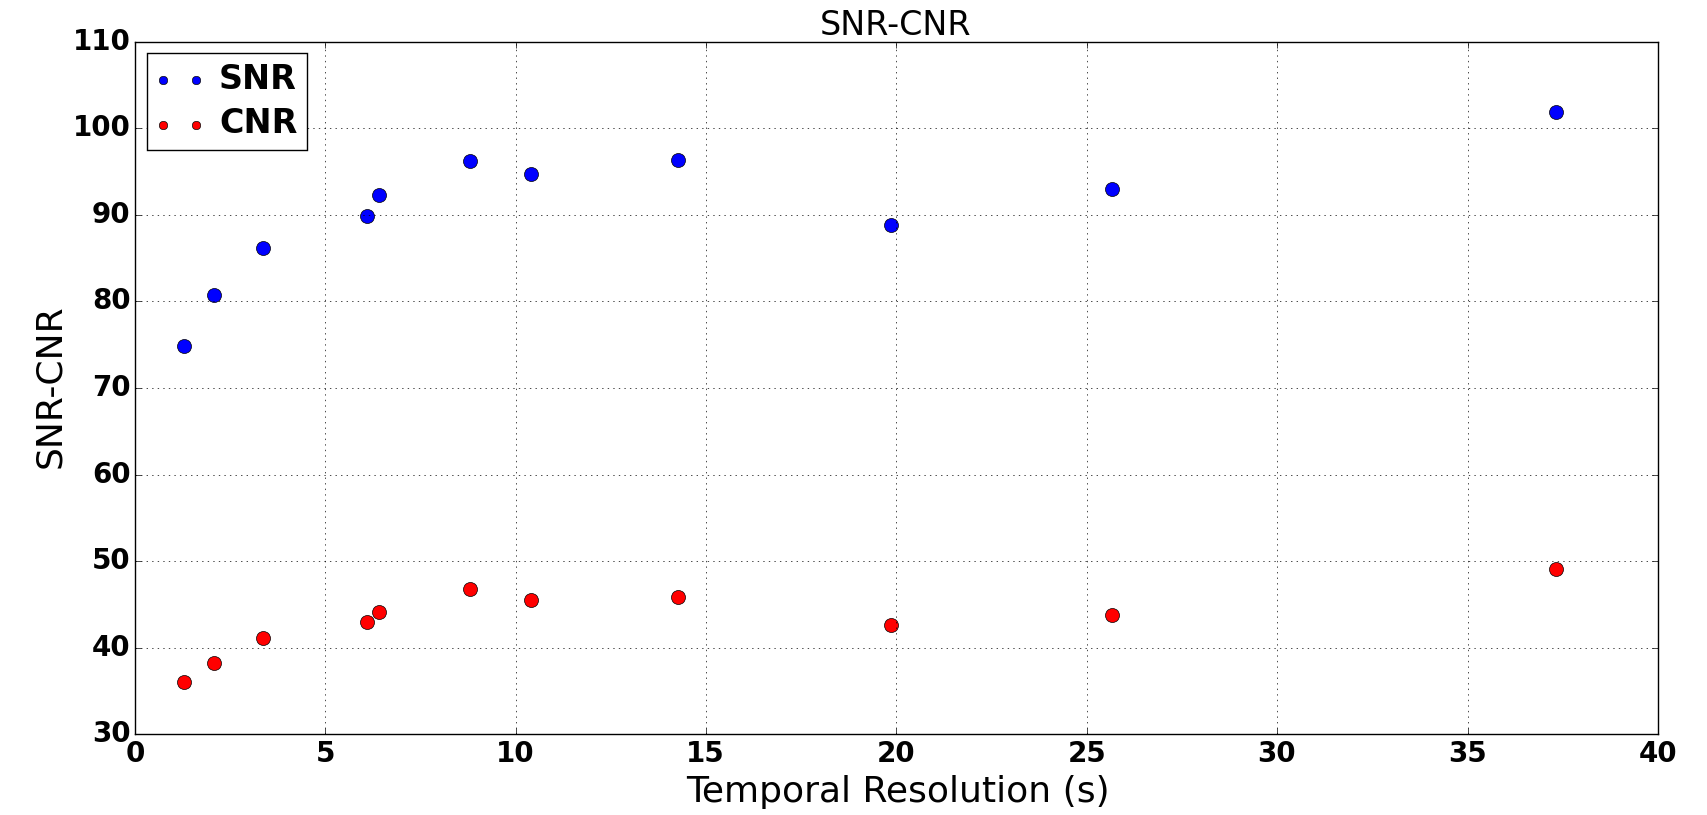
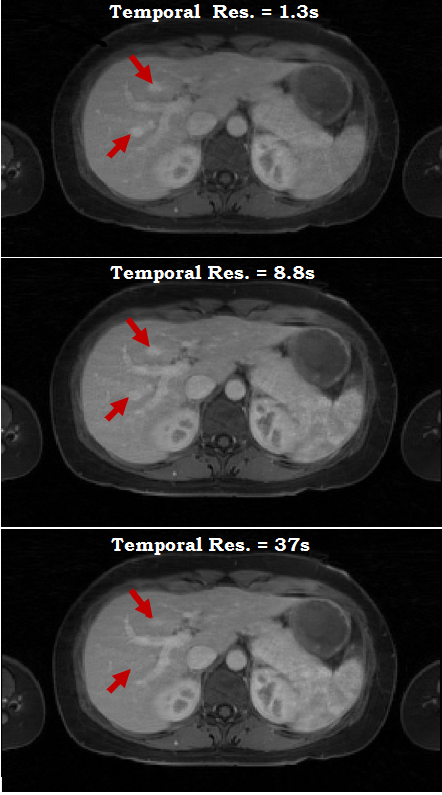
Visual inspection demonstrated subtle increases in streaking artifacts at short TS (Fig.5), which agrees with an observed reduction in SNR (Fig.4). The overall CNR also reduces at short TS (Fig.4), however visual inspection shows that the contrast in some smaller structures is in fact reduced at long TS (Fig.5).
Discussion
The dependence of kinetic parameters on temporal resolution is as expected from previous simulations and studies in fully-sampled data7,8. Specifically, accuracy and precision improve with temporal resolution, with no improvements beyond a parameter-dependent physiological limit that agrees quantitatively with known values.
On the other hand, the data also show a significant systematic error in all parameters. While in theory this could be due to a fixed systematic offset caused by an overregularized temporal signal, the observation is consistent with the effect of signal saturation in the AIF due to the use of a lower flip angle. The absence of a strong first-pass in the AIF signal also points to this effect.
The reduced delineation of small lesions at low temporal resolution is clinically significant and could be due to either averaging of breathing motion or the effect of mixing data acquired during rapidly changing image contrast. In this case the latter is more likely, as motion in this well-trained volunteer was minimal.
Conclusion
This study indicates that temporal regularization inherent in the GRASP technique has little effect on the accuracy and precision of the kinetic parameters, and that known limitations such as signal saturation are more significant. Interestingly, the study also indicates that there is little benefit in reconstructing data at low temporal resolution: this does not translate in a precision trade-off and in fact risks confounding the diagnosis by the reduced contrast in small structures due to temporal averaging.
Acknowledgements
No acknowledgement found.References
1. L. Feng, R. Grimm, K. T. Block, et al, "Golden-angle radial sparse parallel MRI: Combination of compressed sensing, parallel imaging, and golden-angle radial sampling for fast and flexible dynamic volumetric MRI" Magnetic Resonance in Medicine, 2014; vol. 72, pp. 707-717.
2. Yarra Team at CAI²R, Yarra framework, https://yarra.rocks/doc/, Accessed November 7, 2016.
3. University of Leeds, PMI, https://sites.google.com/site/plaresmedima/downloads, Accessed November 7, 2016.
4. S. Sourbron, W. H. Sommer, M. F. Reiser, et al, "Combined quantification of liver perfusion and function with dynamic gadoxetic acid–enhanced MR imaging", Radiology, 2012; vol. 263, pp. 874-883.
5. V. A. Magnotta, L. Friedman, FIRST BIRN, "Measurement of signal-to-noise and contrast-to-noise in the fBIRN multicenter imaging study", 2006; Journal of Digital Imaging, vol. 19, pp. 140-147.
6. P. V. Pandharipande, G. A. Krinsky, H. Rusinek, et al, "Perfusion imaging of the liver: current challenges and future goals", Radiology, 2005; vol. 234, pp. 661-673.
7. H. J. Michaely, S. P. Sourbron, C. Buettner, et al, "Temporal constraints in renal perfusion imaging with a 2-compartment model", Investigative Radiology, 2008; vol. 43, pp. 120-128.
8. A. B. Gill, R. T. Black, D. J. Bowden, et al, "An investigation into the effects of temporal resolution on hepatic dynamic contrast-enhanced MRI in volunteers and in patients with hepatocellular carcinoma", Physics in Medicine and Biology, 2014; vol. 59, p. 3187.
Figures