5174
GRAPPA Reconstructed Wave-CAIPI MPRAGE at 7 Tesla1German Center for Neurodegenerative Diseases (DZNE), Bonn, Germany
Synopsis
In this work, a GRAPPA-based reconstruction for wave-CAIPI acquisitions is presented. 16-fold accelerated full brain MPRAGE images with 1 mm isotropic resolution and high image quality are measured in 45 seconds and a clear improvement compared to Cartesian CAIPIRINHA sampling can be observed. It is demonstrated that optimization of the gradient waveforms further improves image quality.
Introduction
Recently, the wave-CAIPI1 method has been proposed for highly accelerated 3D imaging. As GRAPPA2 is a well-established and robust parallel imaging reconstruction method, the aim of this project was to implement a GRAPPA-based reconstruction algorithm for wave-CAIPI acquisitions. This alleviates the necessity for additional Cartesian reference scans which are usually acquired to determine the coil sensitivities. Highly accelerated wave-CAIPI MPRAGE3 images with good image quality and low g-factors are achieved at a 7 Tesla scanner.Methods
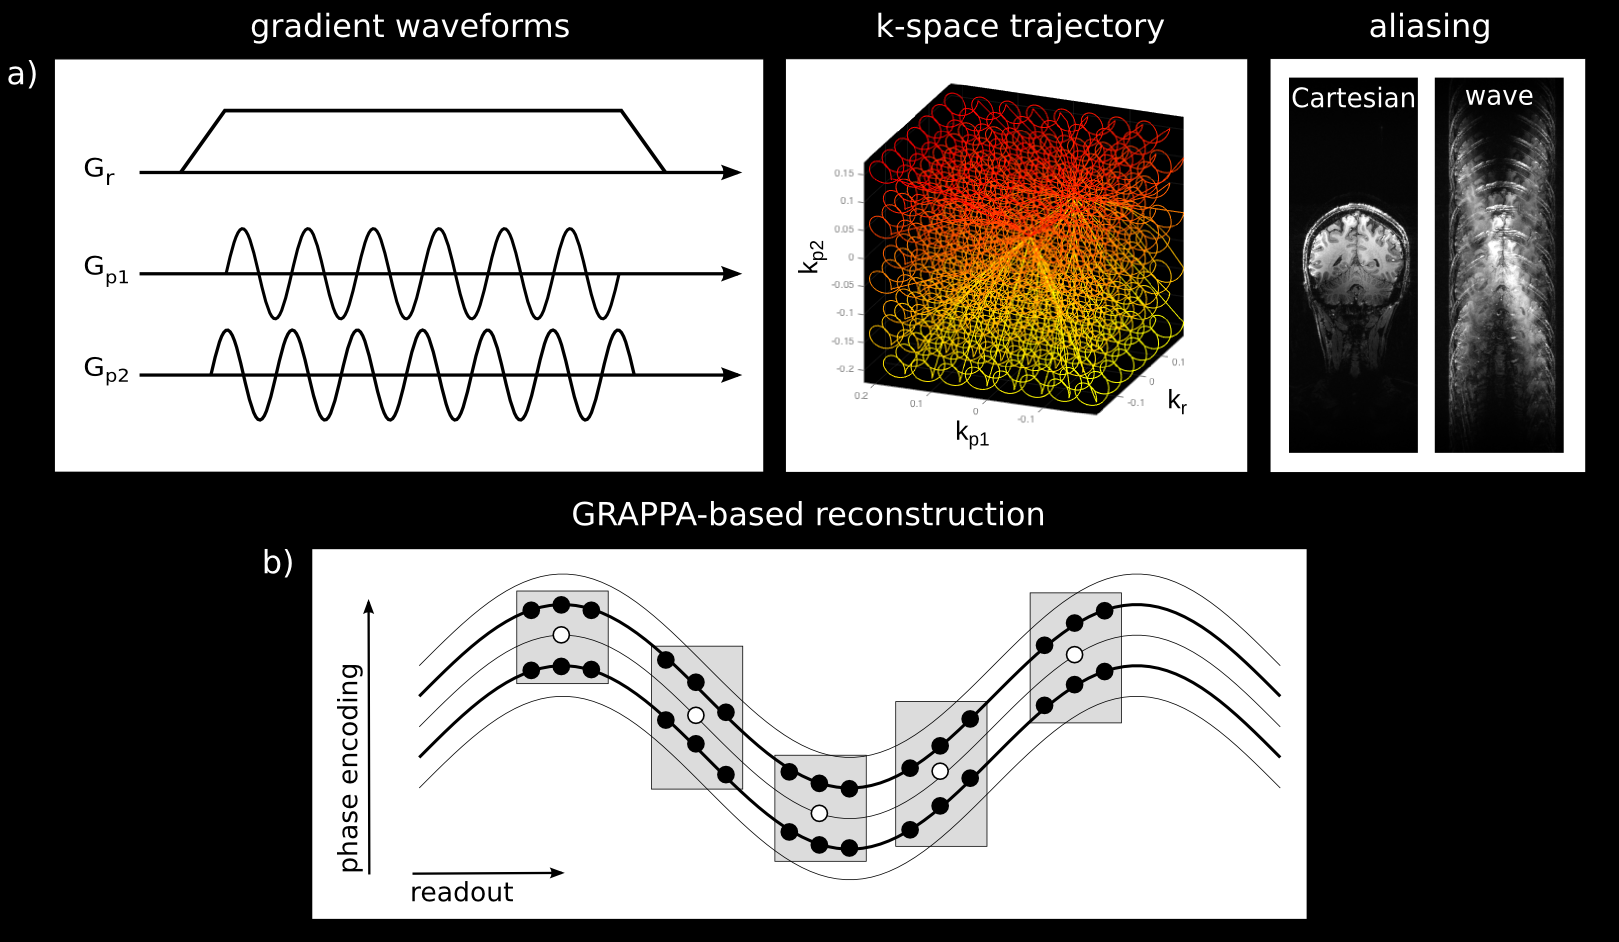
By combining corkscrew k-space trajectories with CAIPIRINHA4 sampling, wave-CAIPI fully exploits the 3D coil sensitivity variations (see Figure 1a) and thereby reduces artifacts and limits reconstruction induced localized noise enhancement.
In this work, a GRAPPA-based wave-CAIPI algorithm was developed for the parallel imaging reconstruction. Compared to Cartesian GRAPPA, multiple GRAPPA reconstruction kernels5 are needed for the reconstruction of the wave-CAIPI dataset as schematically shown in Figure 1b. After the GRAPPA reconstruction, the image still shows aliasing in readout direction due to the non-Cartesian wave trajectory (Figure 1a, right). The remaining aliasing is removed by convolution with a point spread function1 that depends on the k-space trajectory and the spatial location in the two phase encoding directions. The actual corkscrew k-space trajectory was measured using 16 NMR field probes6 (Skope, Zurich, Switzerland). 3D MPRAGE in vivo imaging experiments were performed on a MAGNETOM 7T scanner (Siemens Healthineers, Erlangen, Germany) utilizing a 32-channel head coil (Nova Medical, Wilmington, USA).
Fully sampled data with 1mm isotropic resolution were acquired using different k-space trajectories:
1) Cartesian sampling
2) 32 oscillations/readout and wave amplitudes A=1.5·Δk (in both phase encoding directions)
3) 32 oscillations/readout, A=2.6·Δk
CAIPIRINHA-type accelerated data (R=4x4 with shift 2) were simulated by retrospectively removing phase encoding steps from the fully sampled measurement. A central dataset of size 512x32x32 served as autocalibration signal (ACS). The undersampled data were reconstructed using an in-house developed python toolbox for image reconstruction. A 3D reconstruction kernel of size 3x3x3 was chosen and Tikhonov regularization was used for the calculation of the GRAPPA weights. The ACS lines were included in the GRAPPA reconstruction resulting in an effective acceleration of Reff=11.7.
After image reconstruction, the brain was extracted using BET (FSL7). The root mean square error with regard to the fully sampled data was calculated in a region of interest (ROI). G-factor maps were determined from 200 pseudo multiple replicas8 and the maximum and mean g-factor were evaluated in the ROI.
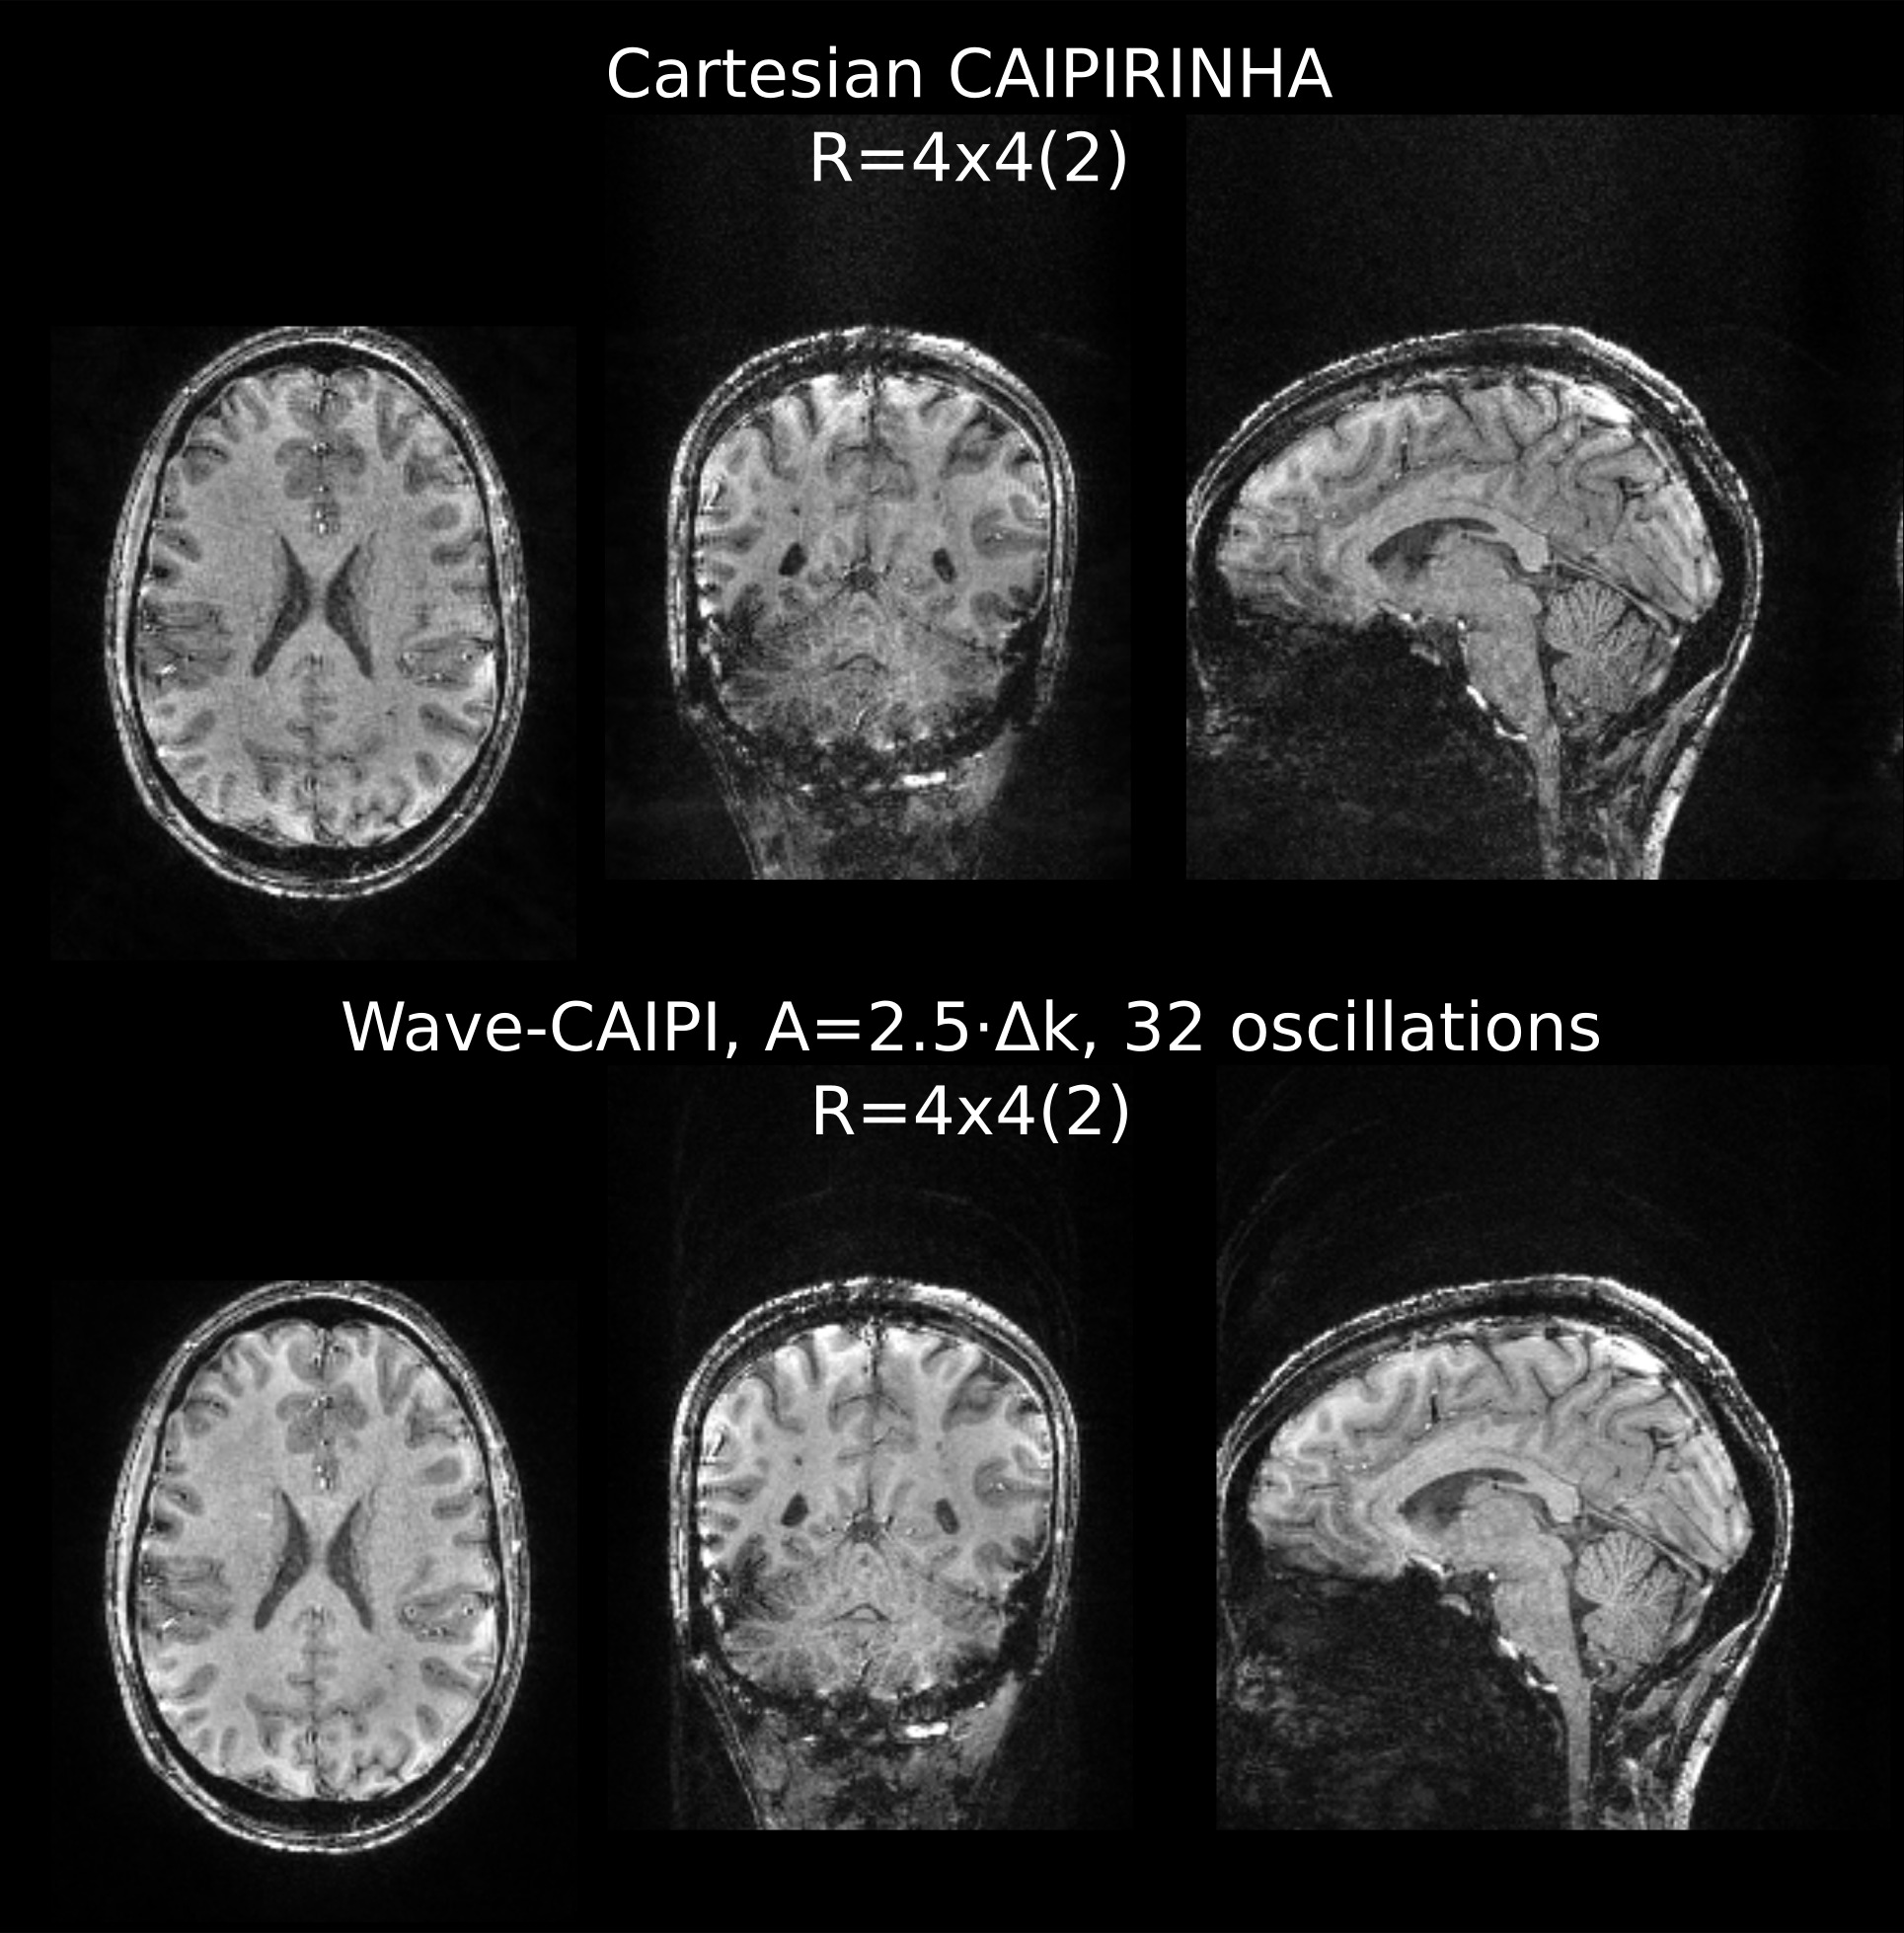
Additionally, 1mm isotropic CAIPIRINHA-type accelerated measurements (R=4x4 with shift 2) utilizing elliptical scanning9 were performed. The data were acquired for Cartesian k-space and wave sampling (32 oscillations/readout, A=2.5·Δk). The total scan time for the full brain image was 45 seconds.
Furthermore, we acquired wave-CAIPI MPRAGE images with 0.6mm and 0.8mm isotropic resolution employing 2x2(1), 3x3(1) and 4x4(2) acceleration, respectively. Total acquisition times were 4:50, 2:18 and 1:25 minutes for the 0.6mm³ resolution data and 2:50, 1:35 and 1:00 minutes for the scans with 0.8mm isotropic resolution.
Results:
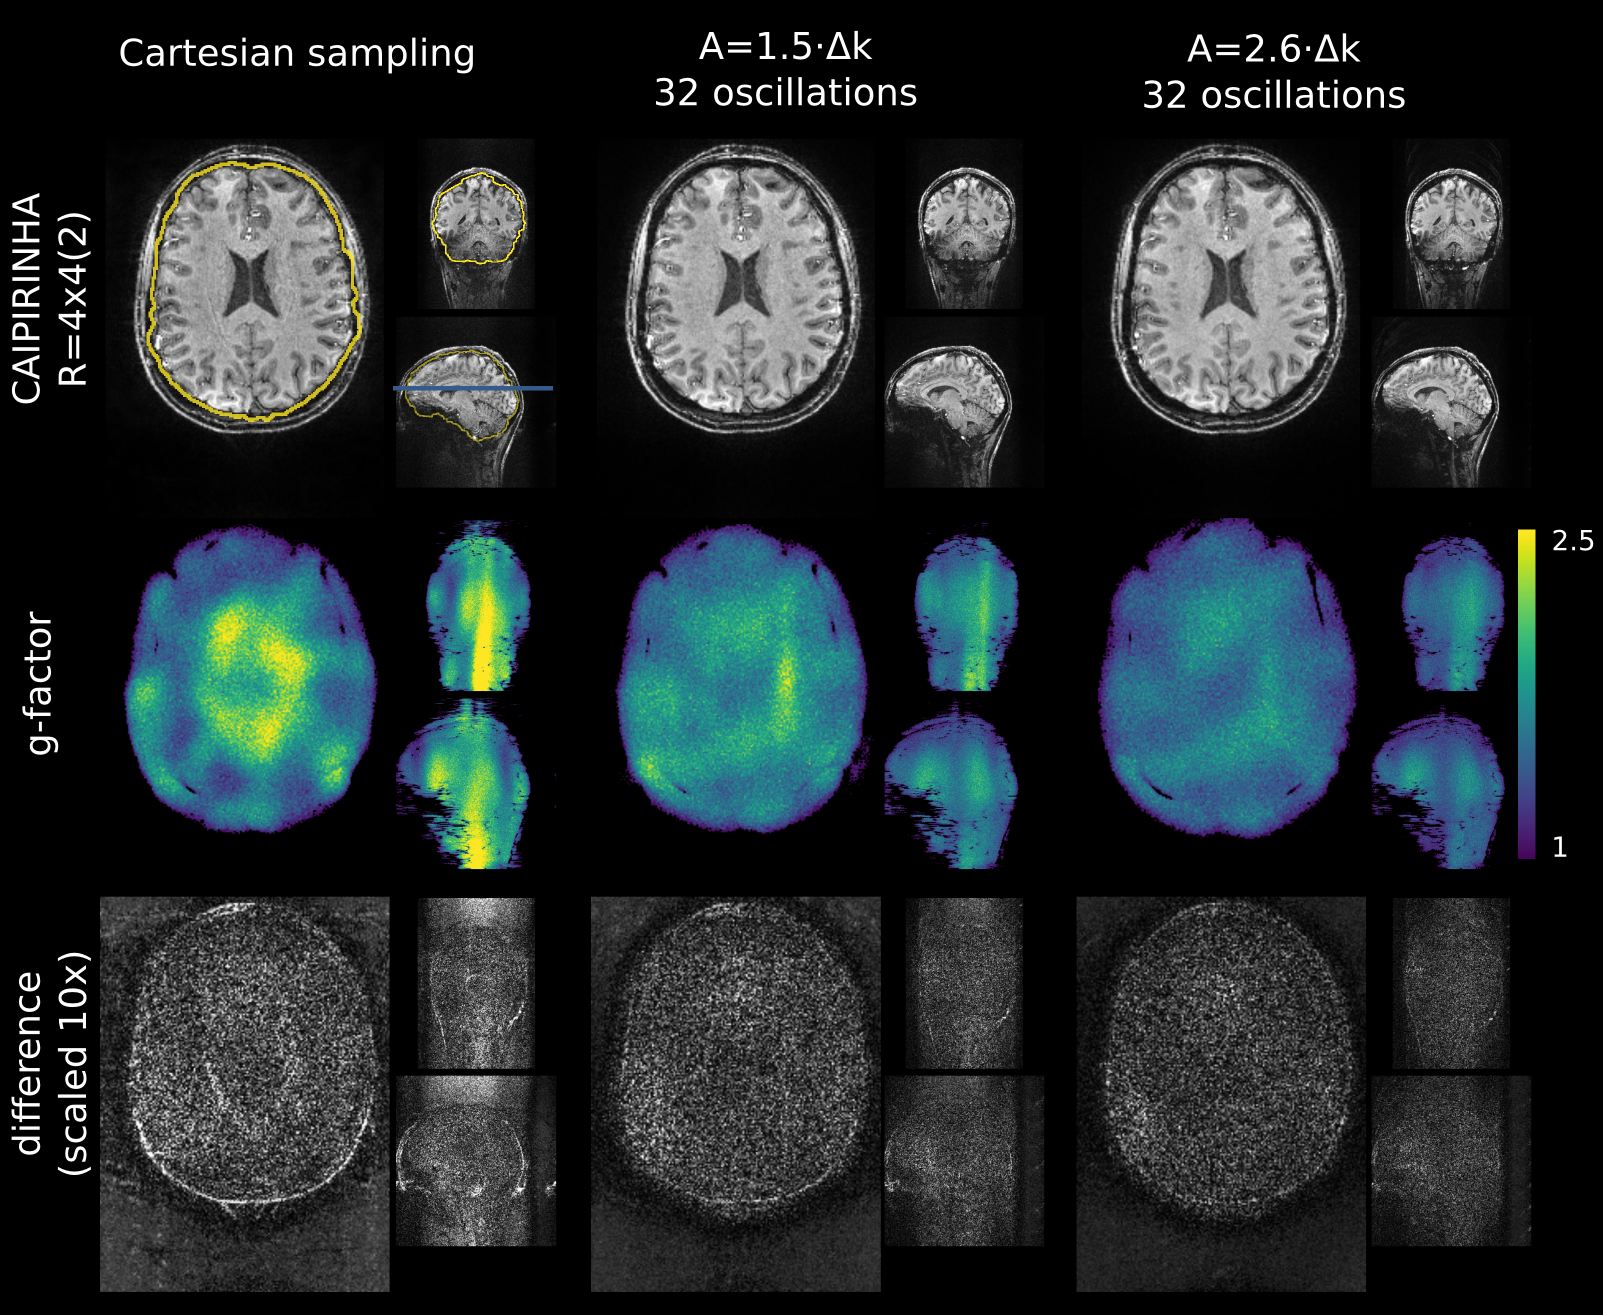
The reconstructed images for simulated 16-fold CAIPIRIHNA and wave-CAIPI are shown in Figure 2. The noise amplification and reconstruction artifact level are quantified with g-factor maps and the difference to the fully sampled image. While aliasing artifacts are visible in the CAIPIRINHA images, the wave-CAIPI images are free of those. Further, the g-factor is reduced.
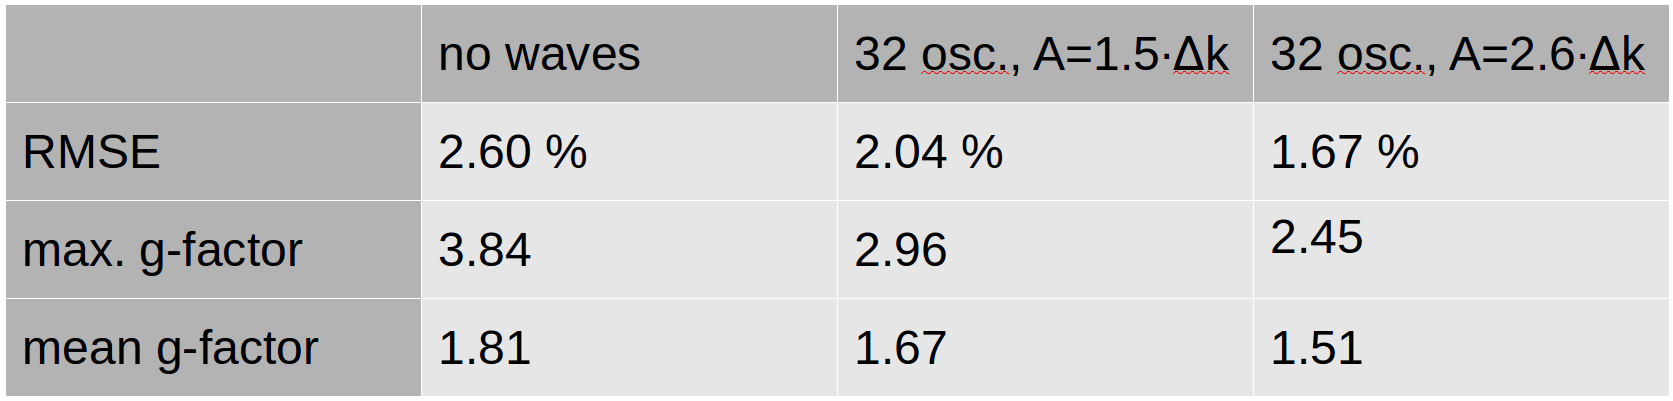
In Figure 3, the RMSE and mean and maximum g-factor are evaluated in the ROI (see Figure 2, upper left) for the CAIPIRINHA and wave-CAIPI measurements. Wave-CAIPI with 32 oscillations and A=2.6·Δk improves the RMSE and maximum g-factor by 36% compared to Cartesian CAIPIRINHA. The results for different wave amplitudes show that gradient waveforms must be optimized to maximize the wave-CAIPI image quality.
Figure 4 depicts the 16-fold accelerated full brain MPRAGE images with 1mm isotropic voxel size acquired in 45 sec. The GRAPPA-based wave-CAIPI reconstruction provided high image quality.
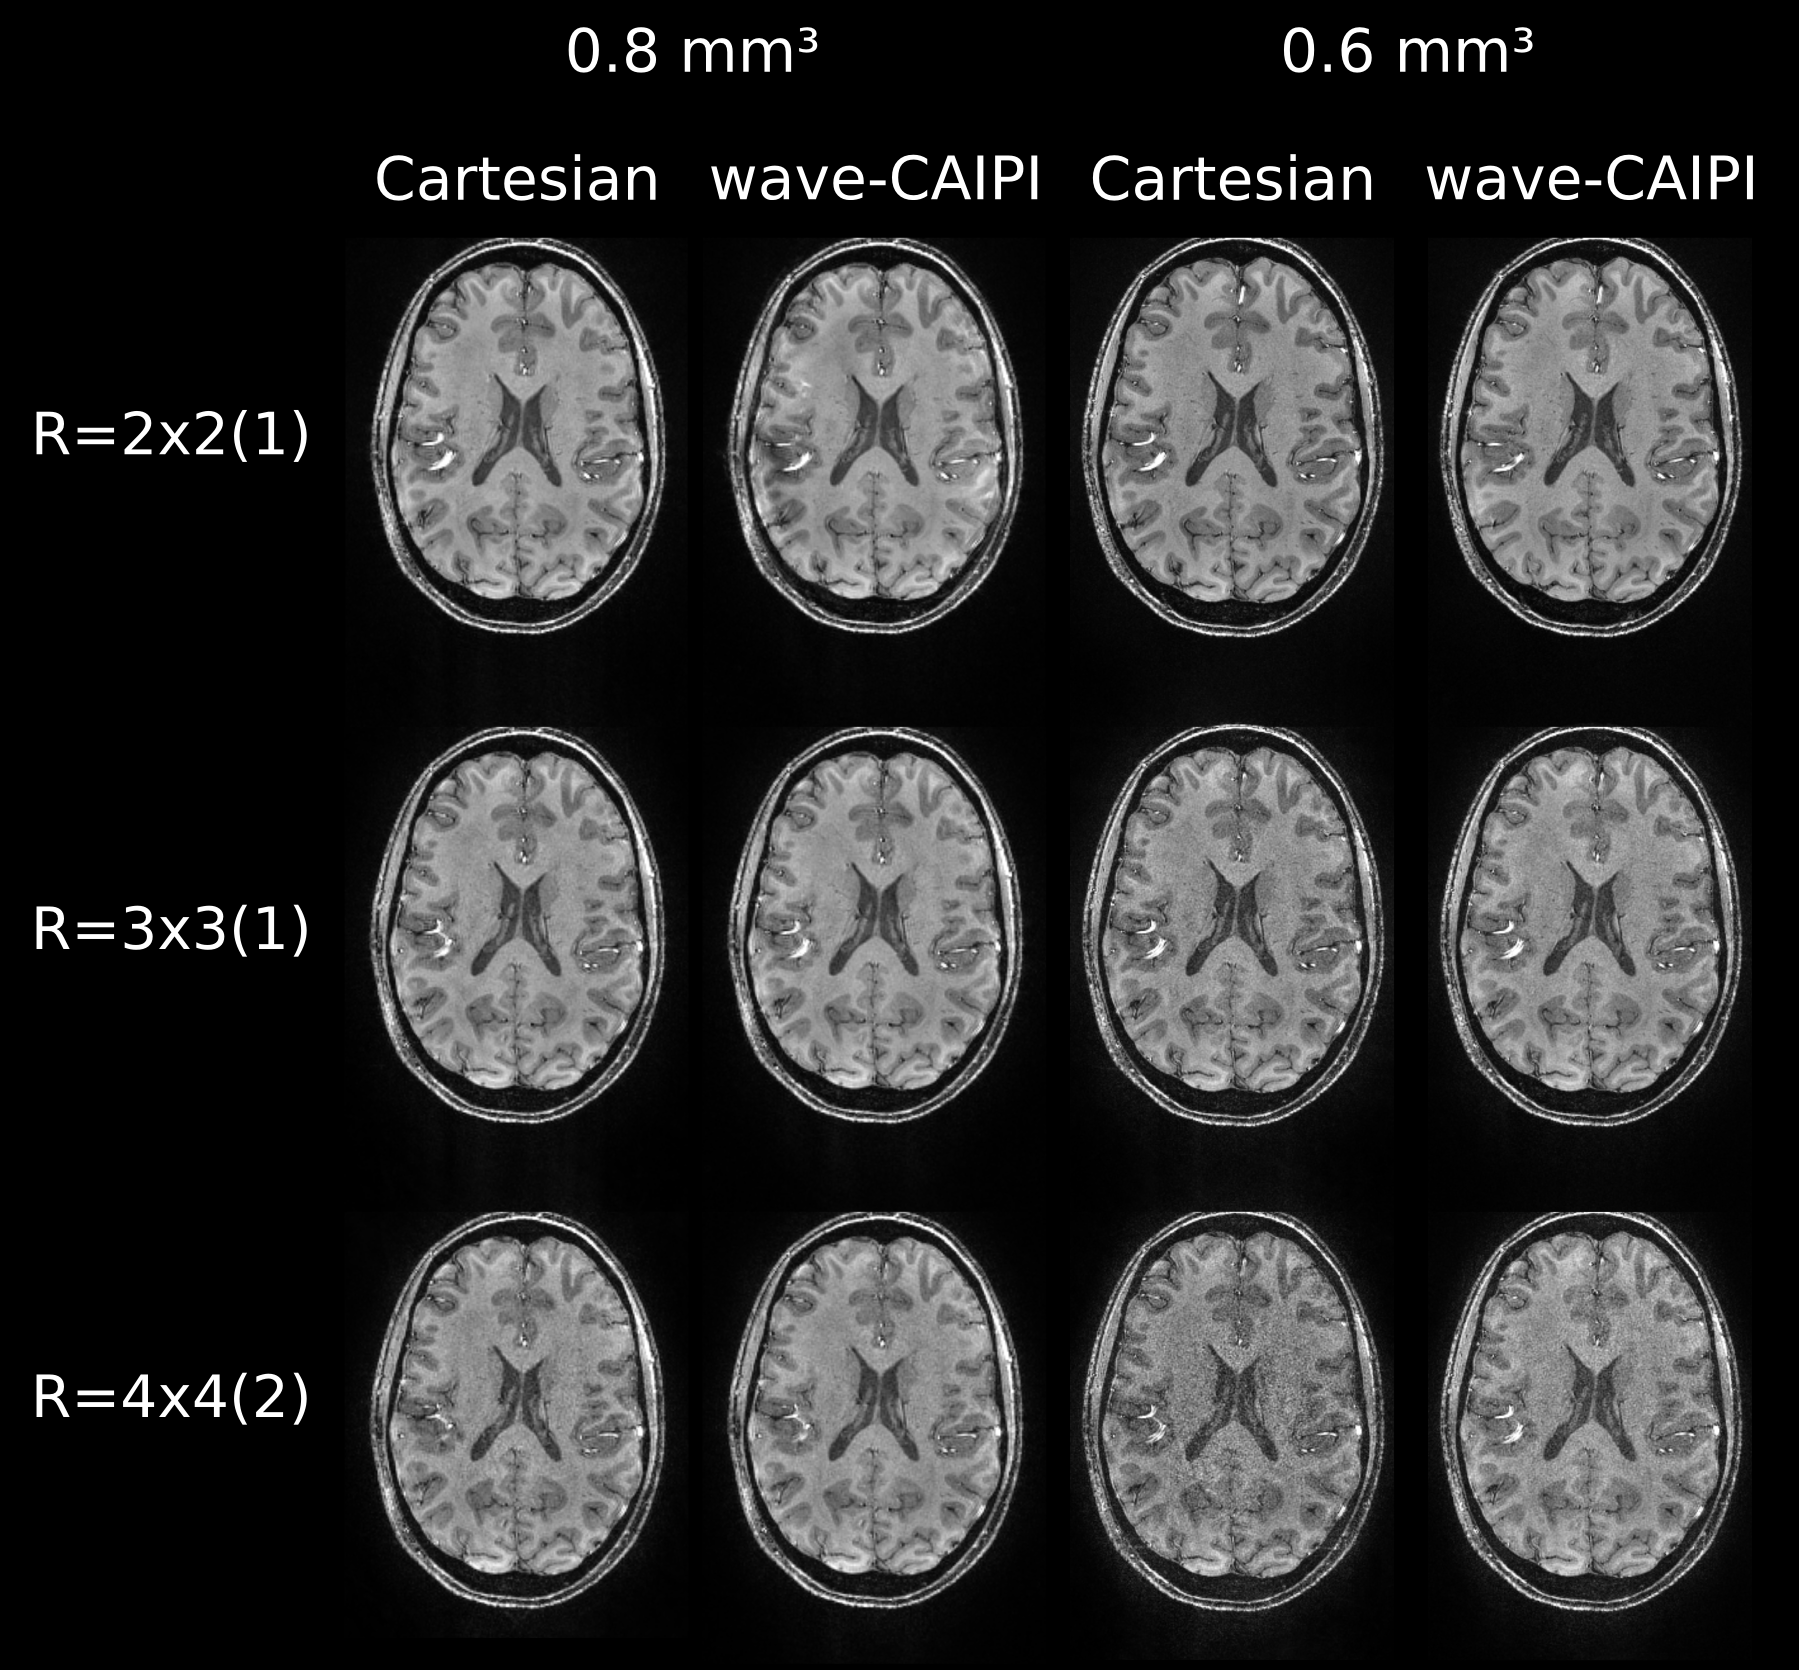
The images with 0.6mm and 0.8mm isotropic resolution are shown in Figure 5. For higher accelerations, a clear improve in signal-to-noise ratio can be observed in the wave-CAIPI images compared to Cartesian acquisition.
Discussion & Conclusion
It was shown that high-quality wave-CAIPI MPRAGE images can be reconstructed by means of a GRAPPA-based algorithm utilizing multiple reconstruction kernels. Even for high acceleration factors, the non-iterative reconstruction is robust and no separate Cartesian calibration scan is needed. Compared to Cartesian CAIPIRINHA, the GRAPPA-based image reconstruction of wave-CAIPI MPRAGE data achieves strongly improved image quality with less artifacts and reduced g-factor penalties. Image quality may further be improved by optimizing waveforms (number of oscillations and wave amplitudes) within the slew rate limit of the scanner.Acknowledgements
No acknowledgement found.References
1. Bilgic B, Gagoski BA, Cauley SF, Fan AP, Polimeni JR, Grant PE, Wald LL, Setsompop K. Wave-CAIPI for highly accelerated 3D imaging. Magn. Reson. Med. 2015;73(6):2152-2162.
2. Griswold MA, Jakob PM, Heidemann RM, Nittka M, Jellus V, Wang J, Kiefer B, Haase A. Generalized Autocalibrating Partially Parallel Acquisitions (GRAPPA). Magn. Reson. Med. 2002;47(6):1202-1210.
3. Mugler JP, Brookeman, JR. Three-dimensional magnetization-prepared rapid gradient-echo imaging (3D MP RAGE). Magn. Reson. Med. 1990;15(1):152-157.
4. Breuer FA, Blaimer M, Mueller MF, Seiberlich N, Heidemann RM, Griswold MA, Jakob PM. Controlled aliasing in volumetric parallel imaging (2D CAIPIRINHA). Magn. Reson. Med. 2006;55(3):549-556.
5. Breuer FA, Moriguchi H, Seiberlich N, Blaimer M, Jakob PM, Duerk JL, Griswold MA. Zigzag sampling for improved parallel imaging. Magn. Reson. Med. 2008;60(2):474-478.
6. De Zanche N, Barmet C, Nordmeyer-Massner JA, Pruessmann KP. NMR Probes for measuring magnetic fields and field dynamics in MR systems. Magn. Reson. Med. 2008;60(1):176-186.
7. Smith SM. Fast robust automated brain extraction. Human Brain Mapping. 2002;17(3):143-155.
8. Robson PM, Grant AK, Madhuranthakam AJ, Lattanzi R, Sodickson DK, Mckenzie CA. Comprehensive Quantification of SNR Ratio and g-Factor for Image-Based and k-space Based Parallel Imaging Reconstructions. Magn. Reson. Med. 2008;60(4):895-907.
9. Brenner D, Stirnberg R, Pracht ED, Stoecker T. Two-dimensional accelerated MP-RAGE imaging with flexible linear reordering. Magn. Reson. Mater. Phy. 2014;27(5):455-462.
10. Tustison NJ, Avants BB, Cook PA, Zheng Y, Egan A, Yushkevich PA, Gee JC. N4ITK: Improved N3 bias correction. IEEE Transactions on Medical Imaging. 2010;29(6):1310-1320.
Figures